GBPCHF GBPCHF has been on a HH and HL move since late August now that its on it HL move, I think this has a good probability to create a new HH at best or a double top at around 1,1360.
Gbplong

GBPUSD 24-31 [OCT] Analysis - PA bouncing off bottom UptrendWe can see PA has rejected off the bottom trend line with an opportunity to go long for ~50 pips. Good luck!


GBPUSD seems to be showing a probable reversal!GBPUSD Which has been on its bearish trend atleast since the beginning of this week seems to be formulating a reversal pattern. The BuyStop orders maybe set as shown. Yellow lines represent more likely filling station zones!

GBPUSD LONG IN THE ZONEM/M GBP coming tomorrow
In the green zone, looking for an escape with a lower low then an explosion at the top
Combining fundamentals and technicals, seems safe to say that after a liitle zig-zag tonight, any GBP asset will go through the roof

GBP/CHF - Bullish Flag Breakout & Strong UptrendOverview: The GBP/CHF pair has not only been in a strong uptrend but has also formed and broken out of a bullish flag pattern, further signaling the continuation of upward momentum. The breakout above the 1.2300 resistance level suggests a potential for further gains.
Technical Analysis:
Bullish Flag: A clear bullish flag pattern has formed, with a breakout confirming further upward movement.
Next Resistance Levels: 1.2550 and 1.2600
RSI: Currently at 65, indicating there’s still room for more upside.
Fundamental Analysis:
GBP Strength: Strong economic data from the UK, including better-than-expected GDP growth and improved employment figures, support the pound’s rise.
CHF Weakness: The Swiss National Bank’s (SNB) dovish stance continues to weaken the franc, providing a favorable environment for the pound’s strength.
Trading Strategy:
Targeting 1.14036 ,1.15070 , 1.16159
Stop Loss: Place a stop below 1.1120 to protect against downside risk.

GBPUSD Rises Above 1.33In European trading hours, the Pound Sterling endeavors to establish a firm position above 1.3300 against the US Dollar. The short - term outlook for the GBP/USD pair remains strong as it stays above the 20 - day Exponential Moving Average (EMA), which is close to 1.3150. Previously, the GBP/USD strengthened following its recovery from a corrective movement towards the trendline drawn from the December 28, 2023, high of 1.2828. After breaking out on August 21, it witnessed a sharp increase from that point.
The 14 - day Relative Strength Index (RSI) moves above 60.00, indicating an active bullish impetus.
Going upwards , the GBP/USD (Cable) will encounter resistance near the psychological level of 1.3500.
On the downward side, the psychological level of 1.3000 becomes crucial support.
MKTNews reports that,
BANK OF ENGLAND'S MANN: PREFERABLE TO STAY RESTRICTIVE LONGER, CAN REDUCE RATES AGGRESSIVELY ONCE INFLATION RISK IS MANAGED
BOE'S MANN: I DID CONSIDER VOTING TO REDUCE RATES IN AUG, BUT AIMED TO AVOID "BOOGIE-DANCE" WITH POLICY RATES
BOE'S MANN: I HOLD CAUTIOUS OUTLOOK ON INITIATING RATE CUTS

EURGBPWe looking for shorts on the third touch of the ascending pattern, We anticipate price to consolidate before selling pressure pushes price bearish

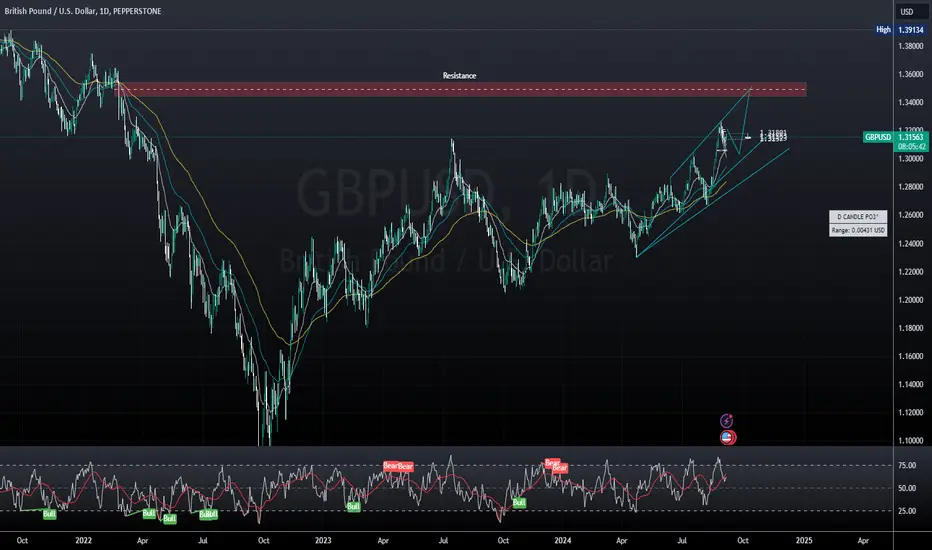
GBPUSD Daily Chart Analysis: Key Resistance and Bullish Channel The daily chart for GBP/USD reveals a clear uptrend with price action forming a bullish channel. The pair is currently trading around 1.31621, approaching a critical resistance zone.
Key Levels:
Resistance Zone:
The price is heading towards a major resistance around 1.39, a level which has historically acted as a strong ceiling. This resistance could halt the upward movement unless a significant breakout occurs.
Support Levels:
The lower trendline of the channel is acting as dynamic support. If the price retraces, the 1.30 level should provide a cushion for potential buying pressure, maintaining the bullish trend.
Trading Strategy:
Buying Strategy:
Traders can look for a pullback to the lower boundary of the channel around 1.30 for a potential buying opportunity. A stop loss can be placed just below the trendline, targeting the resistance at 1.39.
Breakout Strategy:
A breakout above the 1.39 resistance would signal a continuation of the long-term bullish trend, opening up the possibility for further gains toward higher resistance levels.
RSI Confirmation:
The RSI indicator is approaching overbought territory but still has room to push higher. This suggests that the bullish momentum could continue until resistance is tested.
Conclusion:
With GBP/USD trading within a rising channel, the focus remains on how the price interacts with the 1.39 resistance level. A pullback to the lower trendline offers buying opportunities, while a breakout above resistance would signal further bullish potential.
gbpusdgbpusd is in uptrend and will resume uptrend after completing retracement .
GBPUSD can join his HTF trend after taking support from this poi.

Over+750 pip in GBP/AUD in our last call(07/31/2024)in our last analysis
We were expecting a big rally for GBP/AUD. Since then the price moved in our favor and made over +750 pip for us.
Despite weaker CPI data for AUD, we are now looking for a correction in the 1.98 zone.
Our technical view has been shown in the chart.
If you like it then Support us by liking, Following, and Sharing.
Thanks For Reading
Team Fortuna
-RC
(Disclaimer: Published ideas and other Contents on this page are for educational purposes and do not include a financial recommendation. Trading is Risky, so before any action do your research.)

GBPUSD Short Term Buy IdeaH4 - Bullish trend pattern
Currently it looks like a pullback is happening
Until the two strong support zones hold my short term view remains bullish here.

GBPUSD (day trading setup in 15 min )hello dear trader
i think gbp ready for attack on the resistance zone ... now above the fibou 0.618
Even if gbp wants to correct it, I think it should test the flaglimit area and then drop it...
stop loss need for any position
good luck

BUY GBPUSDAs you can notice on the chart, we have our entry at 1.29139 as our OB is showing.
You can buy and set yout TP and SL as shown on the chart.
FOr further questions don't hesitate to ask!

GBP/USDLast week, the Pound Sterling (GBP) and the US Dollar (USD) exchanged minor gains, with the GBPUSD pair surpassing 1.2750 for the first time in two months.
Notwithstanding its robust commencement to the week, the Pound Sterling encountered challenges in the face of a resurging US Dollar, ultimately accumulating moderate gains and perpetuating the preceding week's ascent.
The central theme of this week was the diminishing anticipation of interest rate cuts by the Federal Reserve (Fed) and the Bank of England (BoE). This was partially mitigated by renewed demand for the US Dollar, which tempered optimism surrounding the British Pound.
As expectations of a June rate cut by the BoE were dampened by the delayed decline in UK inflation, GBPUSD reached a two-month high of 1.2762. In contrast, cautious remarks from Fed officials and ardent sentiments expressed in the minutes of the May Fed meeting countered expectations of aggressive rate cuts, reviving demand for the US Dollar and instigating a decline in the GBPUSD pair.
In April, the ONS reported a monthly decline in retail sales of 2.3%, compared to expectations of -0.4% and March's -0.2%. Notwithstanding this, the Pound Sterling managed to maintain its value above 1.2700, as the USD was unable to sustain its strength heading into the weekend due to improving risk sentiment.
In the daily chart of GBP/USD, the recent price showed a buying pressure above the dynamic 20-day EMA line. Moreover, the rising RSI line above the 50.00 level with a confluence of bullish pressure from the 100 day SMA could extend the gain towards the 1.2828 resistance level.
However, a failure to break this line with a daily close below the 20 DMA could initiate a downside correction.

GBPUSD D1 FORCAST (Bullish)
On Friday , The GBPUSD experienced Significant volatility leading to a notable Uptrend moment. This Action in the formation of a low Resistance liquidity Zone, indicatating minimal resistance for the price moment through This level. Additionally the price left relatively equal low, suggesting the pressure of H4 sell Stop.

GBPUSD H1 UPDATE
Hey team hope you are enjoying our Ideas and Analysis , today in trading Running session we are monitoring GBPUSD looking for a buying Opportunity around 1.25092 , once more best Buying Area is 1.24969 so when we will Recieve any conformation the trade willbe Excuted
Good luck Guys

BUY GBP/USDAs you can notice on the chart the market is coming down to the area where we have our OB placed, BUY GBP/USD at 1.26628 and set your TP and SL as sat on the chart!
For further questions, the comment section is all yours!


Are you ready to ride this? More than 3,000 pips { 21/03/2024}Educational Analysis says GBPUSD may move in this range for some time according to my technical.
Broker - FXCM
This is not an entry signal. I have no concerns with your profit and loss from this analysis.
Why this range?
Because the market is in an uptrend on 4 hour zoom out time frame, the market tried to put fake Change of Character duping the traders for a while.
But now we can go long from this zone marked out with risk to reward ratio tool.
Let's see what this pair brings to the table in the future for us.
Please check the Comment section on how it turned out for this trade.
I HAVE NO CONCERNS WITH YOUR PROFIT OR LOSS,
Happy Trading, Fx Dollars.

GBPUSD DAILY TIMEFRAME FORECASTAs the price still in uptrend and have not yet breaking the support so eye will keep on going for LONG and then wait for the profits at the resistence level . So price is likely to keep moving up. So it expect to to buy when ever the price make a support at lower timeframe like 15mins

GBP/USD analysisGBP/USD has broken daily extreme low due to a weekly order block therefore we can say that it is in a down trend. It has been in a consolidation period since half way through December and has finally broken out the range taking liquidity to the downside. In doing so it has left a 4H order block and a huge imbalance on the 1H timeframe. It can either go up to the order block where I would be considering sells, or it could partially fill the imbalance and then start to sell. In the meantime I will be taking buy trades on the 15m and 5m chart until it reaches the premium area of the imbalance. I hope you guys will find this helpful.
