GBP/NZD Breaking OutThis now looks to be breaking above resistance. I said this was happening a couple of days ago but I jumped the gun slightly, hopefully if you opened the trade then you are still in. Now want to see this stabilise above resistance and possibly retrace to test it as support. If you are not in this trade then I suggest waiting for a retrace to support before longing.
Could see some resistance at 1.93237, but target is 1.98013
Providing we see this close above resistance and support holding on a retrace then SL can be around 1.90600
Gbpnzdidea

GBP/NZD - £ Has MomentumGBP is looking very strong and I expect it to push higher. Price on this is currently at resistance but with the momentum this should go straight through it. I have set 2 take profits as I am ultimately aiming for TP 2 but TP 1 allows for exiting the trade and re-entering after a retracement.

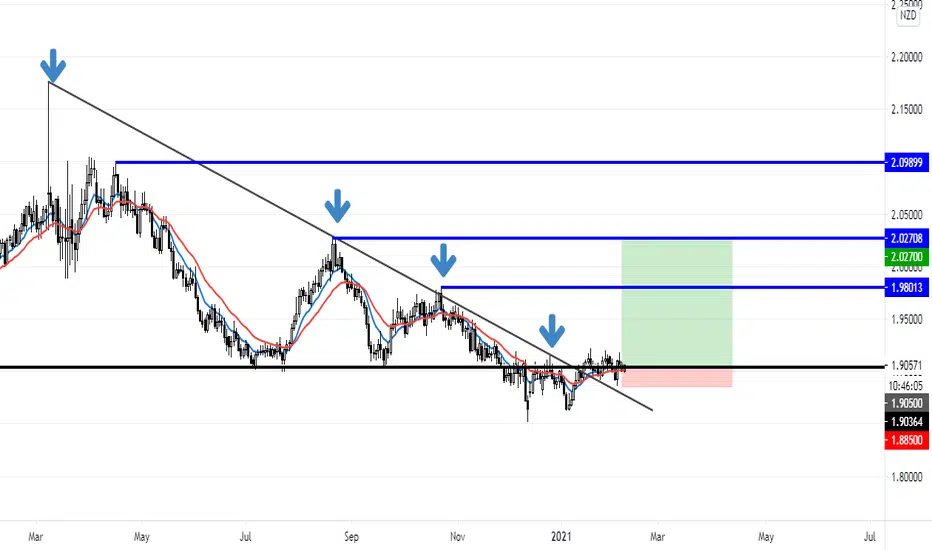
GBPNZD, daily tf, 10-months descending trendline breakoutHello my friends,
Another pair to trade for today is GBPNZD.
You can see price finally broken above the 10-months descending trend line which has acted as resistance.
This could become the beginning for GBPNZD to begin it's journey to the upside.
On the way up, i will look to add more position as price making a continuation pattern.
Buy GBPNZD 1.9050
Stop loss 1.8850
Take profit 2.0270 (6.1R)
Use only 1-2% risk
Good luck
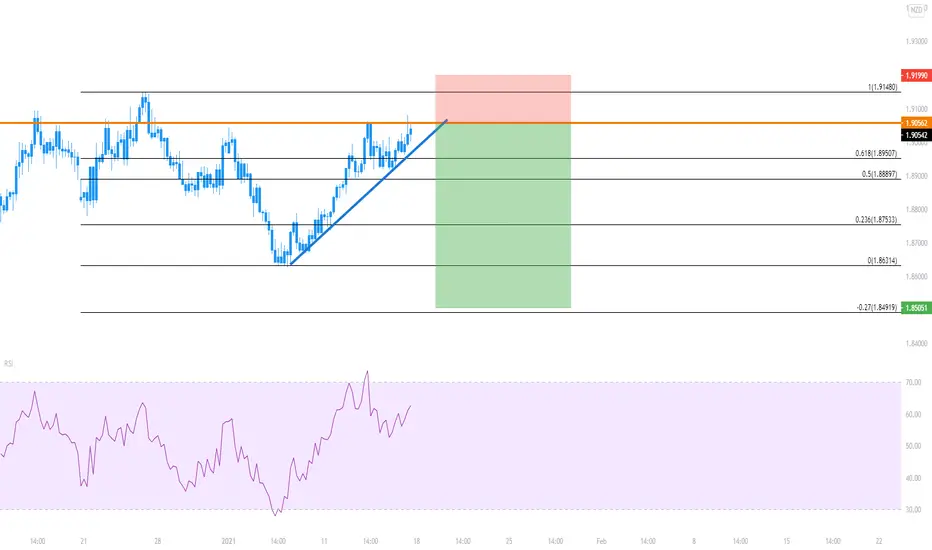
GBP/NZD Should See a RetraceAfter yesterdays Bank of England announcements all GBP pairs have spiked upwards. I would expect a retrace on this soon before generally continuing upwards. I am bullish on GBP in the long term but there should be some short term shorting opportunities coming. This is also at a big monthly and daily resistance level which should make a drop more likely, and at the moment risk off currencies are very strong (NZD, AUD, CAD). Im looking for a TP at 0.5 Fibonacci, although you can also target 0.618 which would complete the neckline of structure (as highlighted in green)
TP - 1.90205
SL - 1.92050

GBPNZD, Strong Price Rejection, LongGBPNZD, Strong Price Rejection due to strong significant Support!

GBPNZD Short (Sell) Trade Setup IdeaWe look at price action as it gets into this sell zone for any signals of a potential reversal.

GBPNZD - buy zone Preconditions:
- accumulation
- key level
- false break out
Push like if you think this is a useful idea!
Before to trade my ideas make your own analysis.
Write your comments and questions here!
Thanks for your support!

Bearish Crab PatternGBPNZD BEARISH CRAB PATTERN
Market Sell Order Set Up.
Sell Entry: (1.91222)
Min Take-Profit: (1.90577)
Max Take-Profit: (1.90055)
Stop-Loss: (1.91975)
Max Risk-Reward: (1.55)
Smash a Like button and leave a Comment, I appreciate every support. Goodluck.

GBPNZD Short (Sell) Trade Setup IdeaGBPNZD is quite interesting as there is no strong structure levels before 1.87. There was a support ledge which has failed to hold and we can now see price failing to the downside.

Wave CorrectionGBPNZD WAVE CORRECTION
Market Sell Order Set Up.
Sell Entry: (1.90687)
Min Take-Profit: (1.89239)
Max Take-Profit: (1.88319)
Stop-Loss: (1.92141)
Max Risk-Reward: (1.63)
Smash a Like button and leave a Comment, I appreciate every support. Goodluck.

GBPNZD short trade ideaPlan : wait for the price to bounce off from trendline or resistance level --> wait for the rejection candle pattern to form e.g. bearish engulfing , pinbar etc --> SELL
**Disclaimer** the content on this analysis is subject to change at any time without notice, and is provided for the sole purpose of assisting traders to make independent investment decisions.
Traders!! if you like my ideas and do take the same trade like i do, please write it in comment so we can manage the trade together.
_____________________________________________________________________________________________________________________
Thank you for your support ;)
GWBFX

GBPNZD 15M TimeFrame Powerful ForecastAs we can see we are inside a consolidation zone. Inside in this area we have noticed that we have formed a strong trendline that represents support, and we have broken this support after 7 hours of trying.
Now we will wait for the retest of this Support which is now resistance and again the Bearish movement until the touch of our Target.

GBPNZD 3rd TL TEST As we can see upper trendline channel, resistence level etc. so we are expecting a reversal near resistence.

GBPNZD, Respecting two strong trend line, LongGBPNZD, Respecting two strong trend line and retesting strong Support! Watch out Friends!

Wave CorrectionGBPNZD WAVE CORRECTION
Market Sell Order Set Up.
Sell Entry: (1.89700)
Take-Profit: (1.87842)
Stop-Loss: (1.90932)
Max Risk-Reward: (1.51)
Smash a Like button and leave a Comment, I appreciate every support. Goodluck.

GBPNZD (REACT DONT PREDICT)GBPNZD has already tested the strong level of support form the weekly perspective so we anticipate price to shoot up, now going down on the h4 time frame we can see a break of structure for potential upside movement ( BUYING AFTER RETEST) But before that GBPNZD has also give us a sell setup because it is on the Trendline RESISTANCE Let's eat the pips

GBPNZD ( LET'S KILL THE BROKERS)GBPNZD LOOKING FOR BUYING BECAUSE THE MARKET HAS REJECTED THE SUPPORT

GBPNZD Opportunities ( I WISH YOU COULD ALL KNOW THIS) GBPNZD will go bullish after a retest, So here we have 2 opportunities which are SELLING and BUYING however it is always a good idea to catch overall market direction opportunities, Generally we will take buys because the market has already tested the support and it is looking forward to test the resistance


GBP/NZD Technical Analysis
The counter has broken down a head and shoulder pattern.
The pattern is right inclined which portrays extreme negativity in the counter.
Hence, we expect the pair to be bearish in the short-term.

GBPNZD- Patience did pay offWhen we posted our GBPNZD ideas some of you came back to us with negative comments, some even stopped following us 😿
Well we did insist on posting it and it did happen and we had the guts, patience, psychology and risk management working for us in order to get to the profits.
Again, technical analysis never lies but you guys need to learn how to TRADE if you will ever be able to use any signals.
GBPNZD, you did what you had to do, thank you.

GBPNZD: No lift-off = possible dropThe third attempt to break over the resistance was not successful either.
Price is in a descending triangle at the moment and volatility is expected in 9x4h candles = 1 to 2 days)
Will need to manage our positions accordingly and be patient enough to get on a good trade here.
