GBPNZD Maintains Bullish Momentum - Is 2.27040 the Next Target?OANDA:GBPNZD is trading within a well-defined ascending channel, with price action respecting both the upper and lower boundaries. The recent bounce off the midline suggests buyers are maintaining control, supporting a potential continuation of the uptrend.
As long as the price remains above the support level and the channel's lower boundary holds, the bullish structure remains intact.
A potential upside target is 2.27040, aligning with the upper boundary of the channel. A break and close above this level could signal further bullish momentum.
However, a decisive break below the channel’s lower boundary or the support zone would invalidate the bullish outlook and could signal a shift in market sentiment.
Remember, always confirm your setups and trade with solid risk management.
Best of luck!
Gbpnzdlong

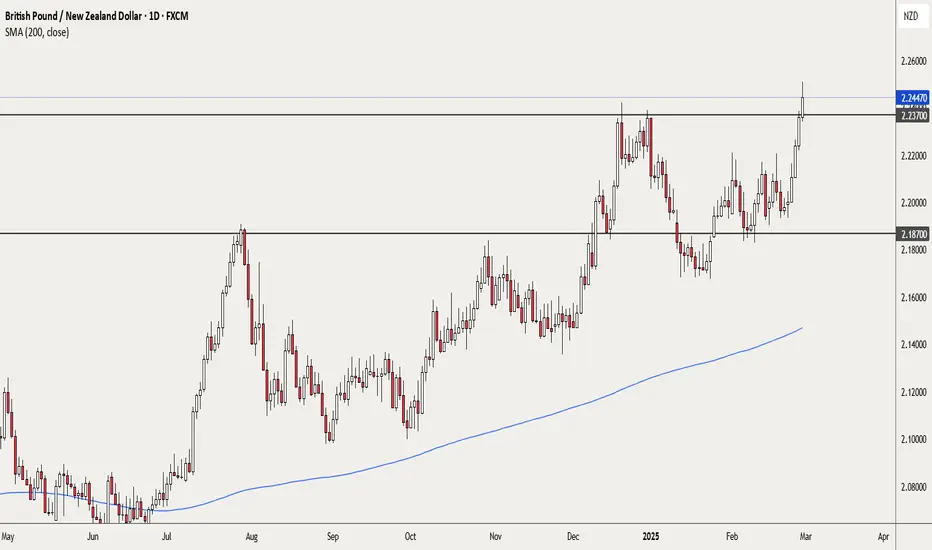
GBPNZD – ready to go long again ... the week of 03 Mar Monthly – bullish
Weekly – bullish
Daily – bullish, broke above previous highs already. Price above 200sma.
H4 – After the break out, price is pulling back. We have no idea where the pullback may terminate, but the support located around 2.2370 or preferably, the zone marked between 2.2212 – 2.21520 (or any other point in between) may hold price.
If there is no further pullback, I will not be interested in trading this pair for now. However, if price action develops as I anticipate, I will be looking for signs of a bullish continuation. My stop would be below the recent swing low and I will at first, target 2.2700 with the potential to extend much higher.
This is not a trade recommendation, merely my own analysis. Trading carries a high level of risk, so only trade with money you can afford to lose and carefully manage your capital and risk. If you like my idea, please give a “boost” and follow me to get even more. Please comment and share your thoughts too!!
It’s not whether you are right or wrong, but how much money you make when you are right and how much you lose when you are wrong – George Soros
gbpnzd analysis elliot. Don't forget about stop-loss.
Write in the comments all your questions and instruments analysis of which you want to see.
Friends, push the like button, write a comment, and share with your mates - that would be the best THANK YOU.
P.S. I personally will open entry if the price will show it according to my strategy.
Always make your analysis before a trade

My GBPNZD Long Idea 22/2/2025This is a trade I probably missed but if I get any sort of correction or retracement I will be entering long on the GBPNZD. Technical setups are aligned for an upward momentum on the price and when speaking fundamentals the BOE is fighting inflation with a cautious easing unlike RBNZ is on the aggressive easing.
I may look at going long GBPCHF aswell.

#gbpnzd long buy setup 20Feb25This count is based on my assumptions so anything can happen not a trading or financial advice just for educational purposes only kindly do your own ta thanks trade with care good luck.

GBPNZD - waiting for bullish continuationWeekly - bullish
Daily - bullish
H4/H1 - waiting for a pullback and then some evidence of a bullish continuation.
The area marked has been used a few times in the past. Also note that the 20ema will provide confluence to my bullish bias.
This is not a trade recommendation, merely my own analysis. Trading carries a high level of risk, so only trade with money you can afford to lose and carefully manage your capital and risk. If you like my idea, please give a “boost” and follow me to get even more. Please comment and share your thoughts too!!
It’s not whether you are right or wrong, but how much money you make when you are right and how much you lose when you are wrong – George Soros

GBPNZD SELL SIGNAl. Don't forget about stop-loss.
Write in the comments all your questions and instruments analysis of which you want to see.
Friends, push the like button, write a comment, and share with your mates - that would be the best THANK YOU.
P.S. I personally will open entry if the price will show it according to my strategy.
Always make your analysis before a trade

GBPNZD LONGGN formed a bullish flag with price respecting the support zone..trade safe and be blessed

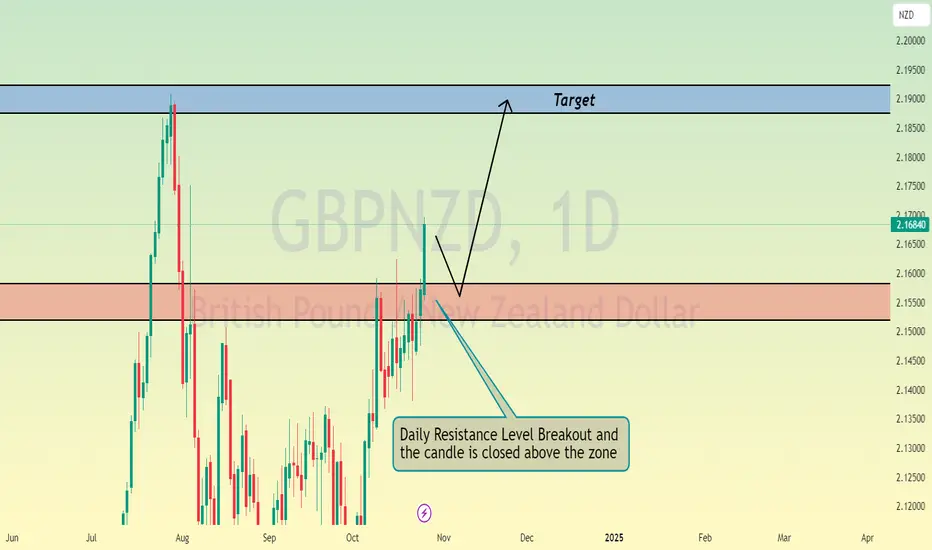
Daily Strong BUY Level GBPNZD - 2.18565 A straightforward yet effective strategy: a strong daily level for profit-taking following a significant downward move. The first target is 2.18998, with a small runner left in place in case of a rebound to higher levels. Please let me know if you have any questions.

GBPNZD - Long from bullish order block !!Hello traders!
‼️ This is my perspective on GBPNZD.
Technical analysis: Here we are in a bullish market structure from daily timeframe perspective, so I look for a long. I wait price to continue the retracement to fill the imbalance lower and then to reject from bullish order block + institutional big figure 2.20000.
Like, comment and subscribe to be in touch with my content!

GBPNZD BUY OPPORTUNITY.gbpnzd my bias is long .it broke stracture to the upside with good momentum.i will wait for retracing.

Buy GBP/NZD Channel BreakoutThe GBP/NZD pair on the M30 timeframe presents a potential Buying opportunity due to a recent downward breakout from a well-defined Channel pattern. This suggests a shift in momentum towards the upside in the coming Hours.
Key Points:
Buy Entry: Consider entering a Long position around close to the breakout level. This offers an entry point near the perceived shift in momentum.
Target Levels:
1st Support – 2.2053
2nd Support – 2.2132
Your likes and comments are incredibly motivating and will encourage me to share more analysis with you.
Best Regards, KABHI FOREX TRADING
Thank you.

GBPNZD - Idea for a long position !!Hello traders!
‼️ This is my perspective on GBPNZD.
Technical analysis: Here we are in a bullish market structure from 4H timeframe perspective, so I look for a long. I expect price to continue the retracement to fill the imbalance and then to reject from bullish OB + institutional big figure 2.18000.
Like, comment and subscribe to be in touch with my content!

gbpnzd sell signal. Don't forget about stop-loss.
Write in the comments all your questions and instruments analysis of which you want to see.
Friends, push the like button, write a comment, and share with your mates - that would be the best THANK YOU.
P.S. I personally will open entry if the price will show it according to my strategy.
Always make your analysis before a trade

GBPNZD SELL signal. Don't forget about stop-loss.
Write in the comments all your questions and instruments analysis of which you want to see.
Friends, push the like button, write a comment, and share with your mates - that would be the best THANK YOU.
P.S. I personally will open entry if the price will show it according to my strategy.
Always make your analysis before a trade

GBPNZD Short Term Buy IdeaH1 - Bullish trend pattern
Currently it looks like a pullback is happening
Until the two strong support zones hold my short term view remains bullish here.

GBPNZD is in Selling Direction Hello Traders
In This Chart GBPNZD 4 HOURLY Forex Forecast By FOREX PLANET
today GBPNZD analysis 👆
🟢This Chart includes GBPNZD market update)
🟢What is The Next Opportunity on GBPNZD Market
🟢how to Enter to the Valid Entry With Assurance Profit
This CHART is For Trader's that Want to Improve Their Technical Analysis Skills and Their Trading By Understanding How To Analyze The Market Using Multiple Timeframes and Understanding The Bigger Picture on the Charts

Pushing up hard right now. GBPNZD. Buy for huge profits
GBPNZD has not crossed up hard with buyers as its renowned for this pair, since around the end of October.
Look at the bullish candle and tail showing the flush of buying right now in this 1hr candle.
Standby.

GBPNZD BULLISH BIAS 1/12/2024Prices have pulled back to the 50 EMA on the daily chart, where there are numerous long lower wicks. This indicates that buyers have reacted and are preventing prices from falling below the 50 EMA.
This area aligns as a confluence point since it represents former resistance turned new support and coincides with the Fibonacci 0.382 level.
The Anchored Volume Profile also highlights this price level as the "Point of Control."
If a bullish engulfing candle forms, it would indicate positive momentum and could provide an opportunity to enter a trade.

gbpnzd buy signal. Don't forget about stop-loss.
Write in the comments all your questions and instruments analysis of which you want to see.
Friends, push the like button, write a comment, and share with your mates - that would be the best THANK YOU.
P.S. I personally will open entry if the price will show it according to my strategy.
Always make your analysis before a trade

#GBPNZD 4HGBPNZD 4-Hour Analysis
The GBPNZD pair is trading within a downtrend channel on the 4-hour chart and is nearing the channel's lower support line. This support zone has historically provided opportunities for bullish reversals within the channel. Waiting for the price to touch this level ensures a safer entry for a potential buy position.
Technical Outlook:
- Pattern: Downtrend Channel Support
- Forecast: Bullish (Wait for Support Touch, Then Buy)
- Entry Strategy: Enter a buy position near the channel’s support line after confirmation of a reversal signal.
Traders should watch for confirmation through bullish candlestick patterns or indicators like RSI reflecting oversold conditions. Proper risk management is essential, with stop-loss orders placed below the support line to guard against a potential breakdown. Targets can be set at the midline or upper boundary of the channel for potential profit.

gbpnzd buy signal. Don't forget about stop-loss.
Write in the comments all your questions and instruments analysis of which you want to see.
Friends, push the like button, write a comment, and share with your mates - that would be the best THANK YOU.
P.S. I personally will open entry if the price will show it according to my strategy.
Always make your analysis before a trade

GBPNZD Pushing itself in a buy directionHello Traders
In This Chart GBPNZD 4 HOURLY Forex Forecast By FOREX PLANET
today GBPNZD analysis 👆
🟢This Chart includes GBPNZD market update)
🟢What is The Next Opportunity on EURNZD Market
🟢how to Enter to the Valid Entry With Assurance Profit
This CHART is For Trader's that Want to Improve Their Technical Analysis Skills and Their Trading By Understanding How To Analyze The Market Using Multiple Timeframes and Understanding The Bigger Picture on the Charts