GBP/USD Slips to 1.2450 on Weak UK Inflation DataGBP/USD faces modest downward pressure, dropping to 1.2450 in European trading on Wednesday. UK CPI inflation fell to 4.6% YoY in October from 6.7% in September, causing the British Pound to lose ground. The pair struggles to find firm footing above the 1.2300 level on daily closing basis, potentially paving the way for an extended recovery toward the psychological level of 1.2350.
The 14-day Relative Strength Index (RSI) points upwards around the midline, indicating an ongoing upward momentum for the pair. The next resistance level is envisioned at the 200-day Simple Moving Average (SMA) at 1.2437.
However, if the upward trend stalls, immediate support will likely be seen at the 50-day SMA at 1.2255, below which the 21-day SMA at 1.2205 may test bullish commitments. Further decline could challenge the 1.2100 demand area.
The extended three-day recovery of GBP/USD in European trading on Tuesday, driven by positive mixed employment data in the UK, appears to be limited as traders exercise caution ahead of the highly significant US Consumer Price Index (CPI) data. The outcome of Wednesday's UK inflation data could significantly impact the Bank of England's interest rate outlook, adding volatility to the British Pound.
Ahead of the crucial US CPI data, FXStreet's Senior Analyst Yohay Elam notes that unexpected results above 0.2% could lead to market reevaluation. A surprise decline in inflation might fuel Wall Street's rally while exerting pressure on the US Dollar. However, an as-expected release may immediately positively affect stocks and create pressure on the US Dollar, even if the core CPI remains high.
Simultaneously, the pair may receive signals from improving risk sentiment, reflected in the slight uptick of 0.12% in the US S&P 500 futures contract.
Gbpnzdsignal

GBP/USD Maintains Uptrend Above 1.2250 GBP/USD saw an increase from the 20-day SMA to 1.2280 on Monday and is consolidating around 1.2275 in the early Asian trading session, supported by the ongoing weakness of the US Dollar. Attention is shifting towards employment data in the UK and crucial US CPI figures on Tuesday. The currency pair reversed its direction after testing the 1.2200 level, with an upward trending line, the 23.6% retracement of the latest downtrend, and the 200-period Simple Moving Average (SMA) on the 4-hour chart aligning, emphasizing the significance of the support level and the sellers' hesitation.
On the upside, GBP/USD faces immediate support at 1.2260 (SMA50) followed by 1.2300 (38.2% Fibonacci retracement) and 1.2340 (static level).
Support levels are set at 1.2200, 1.2140 (static), and 1.2100 (psychological level). What are your thoughts on this currency pair?

GBP/USD Surpasses 1.2200 Level After UK GDPGBP/USD extends its slide below the 1.2200 level in early US trading. UK GDP data reveals a better-than-expected 0.6% year-on-year growth in the third quarter. However, these figures fail to propel the currency pair as investors await next week's key data for clearer direction. The ascending trendline, the Fibonacci retracement level of the latest downtrend, the 100-period Simple Moving Average (SMA) on the 4-hour chart, and the 200-period SMA collectively form a robust support level at 1.2200. If GBP/USD drops below this level and confirms it as resistance, the next downside targets could be set at 1,2140 (static level) and 1,2100 (static level).
On the upside, 1,2250 (SMA 50) is considered a dynamic resistance level ahead of 1,2275 (SMA 20) and 1,2300 (38.2% Fibonacci retracement level).

GBP/USD Surpasses 1.2200 Mark Following UK GDP Data"GBP/USD extends its slide below 1.2200 in early US trading. UK GDP data reveals a year-on-year growth of 0.6% in Q3, surpassing expectations. However, these figures fail to propel the currency pair as investors await next week's key data for clearer direction. What are your thoughts on this currency pair?

GBP/USD Holds above 1.2200 Ahead of UK GDPThe GBP/USD pair entered a consolidation phase on Friday, trading within a narrow range around the 1.2220-1.2225 region, just above the one-week low touched during the Asian trading session. What are your thoughts on this currency pair?

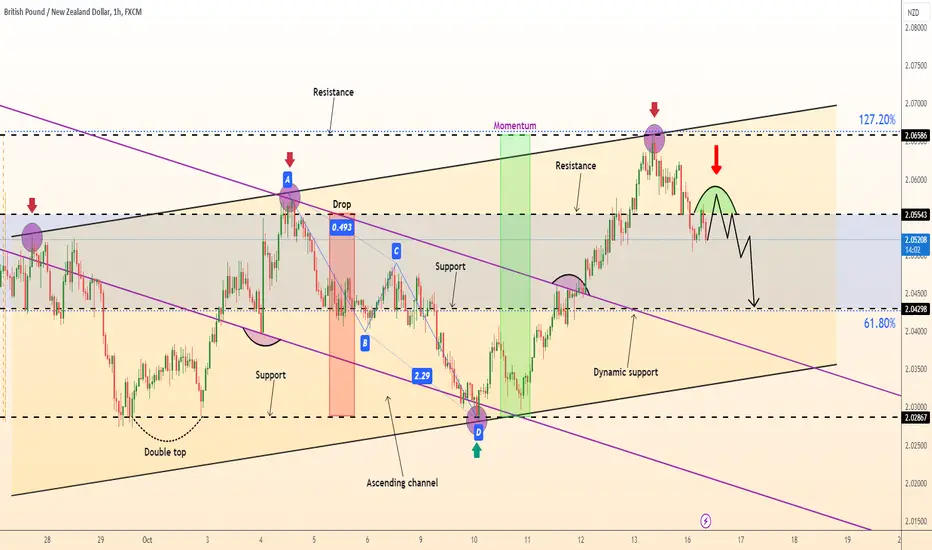
GPNZD BUYHello, according to the analysis of the GBP NZD pair. There is a good opportunity to buy as the pair exits the side channel as shown in the analysis. It also broke the strong Double Bouton pattern. And breaking the resistance at the level of 2.05500. All of these factors confirm that the market is for purchase. Good luck to everyone.

GBP/USD Consolidates Below 1.2200GBP/USD has entered a consolidation phase after testing the resistance at 1.2200. The upward momentum of the British Pound seems to pause, preparing for the Bank of England (BoE) policy announcement on 'Super Thursday.' The Relative Strength Index (RSI) on the 4-hour chart remains near 50, indicating indecision in GBP/USD.
The 100-period Simple Moving Average (SMA) forms immediate resistance at 1.2175, followed by 1.2200 (23.6% Fibonacci retracement level of the latest downtrend, SMA 200). A close above this level in the 4-hour timeframe could attract technical buyers and pave the way for an extended recovery towards 1.2260 (psychological level).
On the flip side, the initial support lies at 1.2100 (psychological, static level) followed by 1.2050 (recent downtrend low) and 1.2000 (psychological, static level).

GBPNZD Breakout From The Wedge!GBP-NZD broke out of
The bullish wedge
While trading in an
Uptrend which confirms
The bullish bias we had
So now a further move up
Is to be expected

GBP/USD Extends Gains Above 1.2150 Level"In the US trading session, GBP/USD rose to its highest level since last Wednesday, surpassing the 1.2170 mark. The pair was supported by a weaker US dollar on Monday, as market participants awaited US employment data, as well as the Fed and BoE meetings. The Relative Strength Index (RSI) on the 4-hour chart remained below 50, and GBP/USD closed the last 4-hour candle below the 20-period Simple Moving Average (SMA), indicating the downtrend is still intact.
On the flip side, 1.2075 (a static level) is considered a temporary support before 1.2050 (the recent low) and 1.2000 (a psychological level).
The 50-period SMA formed dynamic resistance at 1.2140, ahead of 1.2180 (the 100-period SMA) and 1.2200 (the 23.6% Fibonacci retracement level, and the 200-period SMA).

EUR/GBP Extends Gains Near 0.8720 Ahead of German Data"EUR/GBP has continued its upward trend for the second consecutive day, trading near the 0.8720 level in early European trading on Monday. The currency pair received support ahead of significant economic data releases from Germany.
However, preliminary Gross Domestic Product (GDP) data for Germany is expected to show a 0.3% decline for the quarter, with a 0.7% year-on-year decrease, compared to a 0.2% decline in the previous report. Additionally, initial forecasts for the Consumer Price Index (MoM) indicate a decrease of 0.2%, down from the previous 0.3%. Furthermore, the Euro weakened following the European Central Bank's (ECB) decision to maintain the deposit interest rate at 4.0%, reflecting concerns about the deteriorating economic outlook in the Eurozone.
ECB President Christine Lagarde is navigating a delicate balance, steering the central bank through a challenging economic landscape. Maneuvering between a weakening economy and strong inflationary pressures is no easy task. With the increasing complexity of monitoring the Middle East crisis, relying solely on data seems unwise.
On the other hand, the British Pound (GBP) may face challenges as traders adopt a cautious stance ahead of the Bank of England's (BoE) policy meeting scheduled for Thursday. Many predictions suggest that the central bank will maintain its current interest rate at a 15-year high of 5.25% due to growing concerns about economic recession.
The UK economy is feeling the strain due to high-interest rates, adding to the challenges posed by persistent inflation. Economic data indicates significant declines in various sectors, coupled with high inflation, putting additional pressure on household budgets.

GBP/USD Hits Three-Week Low Below 1.2100"GBP/USD extends this week's decline from near 1.2300, touching a three-week low in Asian trading on Thursday, pressured by a stronger US dollar. The pair weakens further below the key 1.2100 level and faces selling pressure. The Relative Strength Index (RSI) on the 4-hour chart drops below 50, and the latest 4-hour candles close below the 100-period and 50-period Simple Moving Averages (SMA), indicating a downtrend.
The level at 1.2100 (a psychological threshold) is considered the main support. If buyers fail to defend this level, further losses towards 1.2050 (the recent low) could be witnessed.
To attract technical buyers, GBP/USD needs to surpass the resistance zone of 1.2190-1.2200, where the 100-period SMA and the 23.6% Fibonacci retracement level converge. In this scenario, 1.2250 (the 200-period SMA) and 1.2300 (the 38.2% Fibonacci retracement level) could be seen as the next resistance levels. After a sharp decline on Tuesday, GBP/USD rallied back to 1.2200 on Wednesday. However, market caution prevented a sustained recovery.
US data released on Tuesday revealed that private sector business activity expanded slightly faster in early October compared to September, with the S&P's global composite PMI improving from 50.2 to 51. While US Treasury bond yields continued to decline, the US dollar benefited from the optimistic PMI data, putting pressure on GBP/USD.
In early European trading on Wednesday, US stock index futures traded negatively, and the yield on the 10-year US Treasury note maintained a modest daily increase of around 4.85%, supporting the US dollar.
In the latter part of the day, the US New Home Sales data for September will be considered for new momentum. Some policymakers at the Federal Reserve have expressed concerns about the negative impact of high-interest rates on the housing market. Therefore, a significant decline in this data could immediately harm the US dollar.
On Thursday, the US Bureau of Economic Analysis will release its initial estimate of third-quarter Gross Domestic Product (GDP) growth.

gbpnzd sell. Don't forget about stop-loss.
Write in the comments all your questions and instruments analysis of which you want to see.
Friends, push the like button, write a comment, and share with your mates - that would be the best THANK YOU.
P.S. I personally will open entry if the price will show it according to my strategy.
Always make your analysis before a trade

GBP/USD Approaches 1.2270 Ahead of PMI DataGBP/USD continues its upward momentum since Thursday, trading above the 1.2270 level in the Asian session on Tuesday. The pair receives support from the US Dollar (USD) adjustment, coupled with improved risk sentiment. Although GBP/USD started higher after testing the 1.2100 level, the Relative Strength Index (RSI) on the 4-hour chart remains below 50, indicating the downward trend persists. If the pair closes below 1.2100 in the 4-hour timeframe, sellers might take action. In this scenario, the 1.2050 level (the recent low) could be the next target before 1.2000 (psychological level).
On the upside, the 20-period Simple Moving Average (SMA) forms a dynamic resistance at 1.2150, preceding 1.2180 (SMA 100) and 1.2200 (23.6% Fibonacci retracement level of the recent downtrend).
Feel free to let me know if you need further assistance or if there's anything specific you'd like to add!

GBPNZD : Short Trade , 4hHello traders, we want to check the GBPNZD chart. The price has broken the ascending channel to the bottom and then marked the key level and also pulled back the downtrend line. If this level can play the role of a resistance level and the price cannot break this level, we expect the price to maintain its downward trend and fall to around 2.03400. Good luck.

GBP/USD Dips, Awaits UK CPI DataGBP/USD faced consecutive losses, trading around 1.2160 in Asian markets on Wednesday. Positive US economic data applied pressure. The pair retreated after reaching 1.2200, the 23.6% Fibonacci retracement level, the 50 and 100-day Simple Moving Averages (SMAs) confirming significant resistance. The 4-hour chart's Relative Strength Index (RSI) dropped to 40, indicating accumulating bearish momentum.
Immediate support lies at 1.2130 (static level). Closing below it in the 4-hour timeframe could bring further selling pressure, possibly testing temporary support at 1,2100 (static, psychological level) before targeting 1,2050, the recent downtrend's endpoint.
If GBP/USD rises above 1,2200 and confirms it as support, it could aim higher towards 1,2250 (static) and 1,2300 (38.2% Fibonacci retracement level). The pair reversed its trend after breaching 1,2200 on Monday, dropping to the 1.2150 region on Tuesday. Short-term technical outlook indicates bearish momentum and potential additional losses if the 1,2130 support fails.
US Retail Sales data for September is on the economic horizon, with a negative surprise possibly impacting the USD. However, GBP/USD might stand firm unless a significant, positive market sentiment change occurs. Stay tuned for updates on this evolving situation.

DeGRAM | GBPNZD rebounded from resistanceGBPNZD rebounced from the resistance and 127.20% fibo inversion.
The market broke and closed below the support 2.0600, which became the resistance.
On the D chart, the trend is bearish, meaning the bears are dominating.
We expect a pullback from the resistance if the price makes a false breakout of the resistance.
-------------------
Share your opinion in the comments and support the idea with a like. Thanks for your support!
GBPNZD Long Term Buying Trading IdeaHello Traders
In This Chart GBPNZD HOURLY Forex Forecast By FOREX PLANET
today GBPNZD analysis 👆
🟢This Chart includes_ (GBPNZD market update)
🟢What is The Next Opportunity on CHFJPY Market
🟢how to Enter to the Valid Entry With Assurance Profit
This CHART is For Trader's that Want to Improve Their Technical Analysis Skills and Their Trading By Understanding How To Analyze The Market Using Multiple Timeframes and Understanding The Bigger Picture on the ChartS

DeGRAM | GBPNZD potential shorting opportunityGBPNZD broke and closed below the consolidation zone, then pulled back to resistance following the double bottom.
The market overall is consolidating, so we anticipate price action between borders.
We expect further consolidation until the new trend is confirmed.
-------------------
Share your opinion in the comments and support the idea with a like. Thanks for your support!

GBPNZD Long Term Buying Trading IdeaHello Traders
In This Chart GBPNZD HOURLY Forex Forecast By FOREX PLANET
today GBPNZD analysis 👆
🟢This Chart includes_ (GBPNZD market update)
🟢What is The Next Opportunity on CHFJPY Market
🟢how to Enter to the Valid Entry With Assurance Profit
This CHART is For Trader's that Want to Improve Their Technical Analysis Skills and Their Trading By Understanding How To Analyze The Market Using Multiple Timeframes and Understanding The Bigger Picture on the ChartS

BEARISH GBPNZD OPPORTUNITY FORMING According To Fibbonacci retracment to 50%&61% the area that happening a pullback
According to Downtrend channel
According to CCI level Zero

GBPNZD BuyGBPNZD could be Bullish from 1.99300
here is reason
1, imbalance
2, unmittigated order block
3, Double Bottom
if im wrong please comments

GBPNZD At the moment, I think it will be too soon for me to say there would be a reversal or a continuation, however a breakout on either side is what I'd love to see before taking a position.
A break above the and its retest, 2.04919 I will go long
A break below the and its retest, 2.04036 I will go short. Until then, fingers crossed
Disclaimer:
All trade ideas are given for educational purposes and should not be treated as an investment advice, hence do your due diligence. Past results does not guarantee future results

GBPNZD Long Term Buying Trading IdeaHello Traders
In This Chart GBPNZD HOURLY Forex Forecast By FOREX PLANET
today GBPNZD analysis 👆
🟢This Chart includes_ (GBPNZD market update)
🟢What is The Next Opportunity on CHFJPY Market
🟢how to Enter to the Valid Entry With Assurance Profit
This CHART is For Trader's that Want to Improve Their Technical Analysis Skills and Their Trading By Understanding How To Analyze The Market Using Multiple Timeframes and Understanding The Bigger Picture on the ChartS
