GBP/JPY Rejection from Resistance Zone GBP/JPY Rejection from Resistance Zone 🧱📌 | Bearish Setup In Play 🔻💹
📌 Technical Analysis Overview:
The chart illustrates a clear rejection from the resistance zone around 198.460, where previous price action formed a double-top pattern (🔴 red arrow). This suggests a strong supply area with selling pressure building.
🔍 Key Observations:
📏 Trendline Break:
The upward trendline (blue) has been decisively broken.
This break signals a loss of bullish momentum.
🧱 Resistance Zone @ 198.000–198.460:
Price tested this zone multiple times but failed to break above.
Acts now as a strong resistance zone.
🟠 Support Turned Resistance:
Former support has now turned into resistance (highlighted in blue text: "SUPPOT").
📉 Bearish Projection:
The projected path indicates a possible retest of the resistance zone before a sell-off continuation.
Target area: around 194.500, marked as “TAEGET FAXS” (typo: should be “TARGET ZONE”).
🔄 Possible Scenarios:
✅ Bearish Continuation:
If price rejects again near 198.000, expect a bearish move toward 194.500.
⚠️ Invalidation:
A strong breakout above 198.460 would invalidate the bearish thesis and may resume bullish momentum.
🔚 Conclusion:
The pair is currently under pressure with a confirmed break in trend structure. As long as price remains below 198.460, the bias remains bearish with a target toward the 194.500 zone. 📉👀
Gbpshort

GBP/USD Bearish Reversal Pattern Detected GBP/USD Bearish Reversal Pattern Detected 🔻🦈
The chart illustrates a potential bearish Gartley pattern formation near the 1.3736 resistance zone, which has historically triggered price rejections (red arrows).
🔍 Key Observations:
📌 Price action completed a bearish harmonic pattern, suggesting a reversal setup.
💡 Multiple rejections at the upper resistance zone (1.3730–1.3780) highlight strong selling pressure.
📉 Break of trendline support confirms shift in structure.
🟠 Historical support zones (orange circles) now align with the projected target level: 1.3512.
🔽 A clean breakdown below 1.3650 could accelerate bearish momentum toward the target.
🎯 Target: 1.35124
🛑 Resistance: 1.3730–1.3780
✅ Support: 1.3510–1.3550 zone

GBPUSD IS LOOKING WEAK FOR A HARD SELL OFF SWING TRADEOANDA:GBPUSD Has broken the bullish swing low on 4 Hour time frame with strong sell off bearish candles leaving behind a big bearish imbalances in price. Which extra confirm that price is extremely bearish on 4 Hour time frame.
Now that trend has shifted from bullish trend to a bearish one, am now bearish on GBPUSD.
Bearish shift in market structure that happened on OANDA:EURUSD EURUSD which is a correlating pair with GBPUSD extra confirm this bearish bias on GBPUSD.
likewise also, the Bullish Shift in Market Structure on OANDA:USDCAD USDCAD, which is an opposite correlating pair confirm this sell on GBPUSD.
So, my focus now is selling GBPUSD in every pullback or retest of key bearish levels.
I will update you as the trade develop.

Fundamental Market Analysis for June 19, 2025 GBPUSDEvent to pay attention to today:
14:00 EET. GBP - Bank of England base rate decision
GBPUSD:
GBP/USD remains down for the third consecutive session, trading around 1.34100 in Asian trading on Thursday. The pair is struggling as the US dollar (USD) strengthens amid rising demand for safe-haven assets triggered by escalating tensions between Israel and Iran. In addition, the Bank of England (BoE) is widely expected to leave interest rates unchanged on Thursday.
In the UK, consumer price index inflation fell to 3.4% year-on-year in May, as expected, from 3.5% in April. However, this figure is still well above the BoE's target of 2%. Nevertheless, markets still expect rates to fall by around 48 basis points by the end of the year.
Bloomberg reported on Thursday that ‘US officials are preparing for a possible strike on Iran in the coming days.’ ‘US plans to attack Iran continue to evolve.’ Another Wall Street Journal report suggests that US President Trump approved plans to attack Iran on Tuesday but wanted to see if Tehran would abandon its nuclear programme.
In addition, the dollar was supported by comments from Federal Reserve Chairman Jerome Powell, who said that inflation remains slightly above target and may rise in the future, citing the impact of US President Donald Trump's tariffs.
The US Federal Reserve (Fed) decided at its June meeting on Wednesday, as expected, to leave the base rate unchanged in the range of 4.25-4.50%. The Federal Open Market Committee (FOMC) still forecasts interest rates to fall by about 50 basis points by the end of 2025.
Trading recommendation: SELL 1.34100, SL 1.34300, TP 1.33200

GBP/USD Trading Idea: Sell Below 1.32056 Targeting 1.27133The GBP/USD pair is currently trading within an Undefined Price Action/Consolidation Zone, suggesting indecision and reduced momentum. Price has been moving sideways for several days with no clear trend direction. This area typically signals accumulation or distribution before a breakout.
Key Levels Identified
Support 1 (Breakout Level): 1.32056
Support 2 (Target Level): 1.27133 – 1.27173 (zone)
Resistance (Invalidation Zone): Around 1.33034
Trade Setup (Bearish Bias Upon Breakout)
Trade Idea
Price is currently ranging but has tested the Support 1 zone multiple times. The more a support level is tested, the weaker it becomes. A clean break below Support 1 (1.32056) would likely signal the end of the consolidation phase and could trigger a strong bearish move. If this breakdown occurs, a short position becomes valid.
Entry
Sell Stop Order below 1.32056 (e.g., at 1.31950) to catch the breakout momentum.
Take Profit (TP)
Primary Target: Support 2 zone between 1.27133 and 1.27173, representing a major historical support level. This provides a potential reward of approximately 480 pips from entry.
Stop Loss (SL)
Placed above recent swing high and resistance of the range: around 1.33034.
Risk is about 90 pips, providing a Risk-Reward Ratio (RRR) of ~1:5 – favorable for short sellers.
Additional Notes
Volume Analysis: Volume appears to have dropped inside the consolidation zone, often indicating a buildup phase. A breakout with rising volume would confirm the trade signal.
Event Risk: UK-related macroeconomic events are marked on May 13 and 15. Monitor for volatility which could trigger the breakout.
Bias: Currently unbiased but leaning bearish due to:
Flat momentum within the zone
Multiple failures to sustain above mid-range
Potential for breakdown continuation aligned with the higher time frame trend

GBPJPY Sell Opportunity There is a sell opportunity. We needed to wait for a retest and sell
Entry:193.215
SL:193.414
TP:191.984
It as already reached a daily resistance and I hope to sell.
Pls comment you opinions

GBPUSD STRONG DOWNTRND PATTERNTechnical Analysis
1. Trend Overview:
The GBP/USD pair is in a strong bearish trend, confirmed by:
Price consistently forming lower highs and lower lows
Breakdown of key support zones(1.3200), turning them into new resistance (especially 1.34400)
Momentum oscillators and moving averages showing sustained downward pressure

GBPUSD SHORT FORECAST Q2 W18 D30 Y25GBPUSD SHORT FORECAST Q2 W18 D30 Y25
Professional Risk Managers👋
Welcome back to another FRGNT chart update📈
Diving into some Forex setups using predominantly higher time frame order blocks alongside confirmation breaks of structure.
Let’s see what price action is telling us today!
💡Here are some trade confluences📝
✅Weekly order block rejection
✅Daily order block rejection
✅Daily high rejection
✅Daily imbalance fill targets
🔑 Remember, to participate in trading comes always with a degree of risk, therefore as professional risk managers it remains vital that we stick to our risk management plan as well as our trading strategies.
📈The rest, we leave to the balance of probabilities.
💡Fail to plan. Plan to fail.
🏆It has always been that simple.
❤️Good luck with your trading journey, I shall see you at the very top.
🎯Trade consistent, FRGNT X

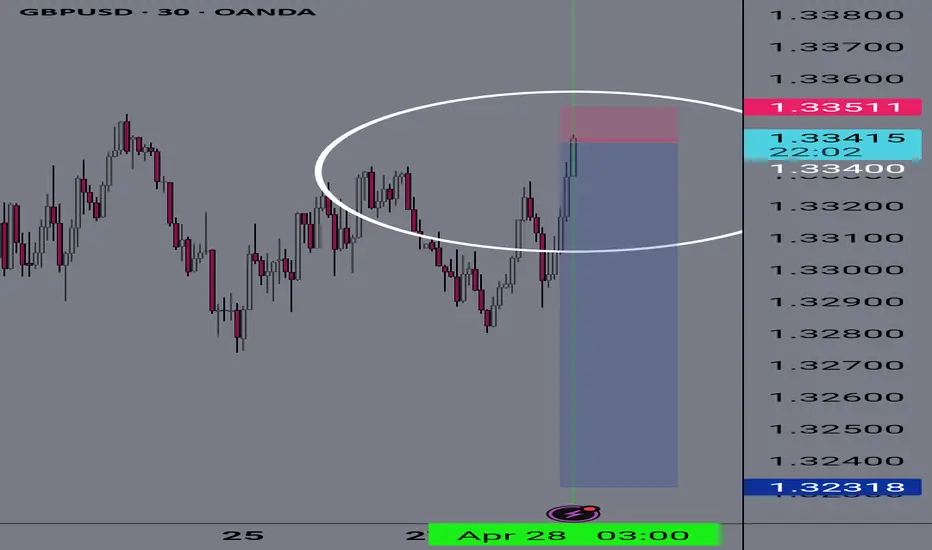
RARE / 10R / Short....SGU @ 1.3340Rare but rewarding!
Just executed Short .... SGU @ 1.3340
💯 solid setup...watch this tank 📉
in engineering....we call this BUCKLE ;)
expecting min DD < 15p max RRR > 10
TP1 and SL as shown until final TP2 projected by system.
Sorry, alert is not based on TA like BoS or OB or SnR SnD PP or Fibs or even ICT etc....since designed to induce and seduce...rather based on multi-system confluence convergence and confirmations.... now system beeping let's test n see
IF u like this...would appreciate any feedback for continuous improvement...
🥂
Still pending clear confirmationPrice Action Overview:
From 1:00 AM to 10:00 AM today, I see the price steadily rising from around 1.2829 to a current close of about 1.29131. The 10:00 candle even touched a high of 1.29248. This sequence suggests that the market is testing the upper bound of the recent consolidation range.
Consolidation and Potential Overextension:
Although the movement from roughly 1.282 up to 1.292 is relatively tight, I interpret this as the price moving near the top of its recent consolidation zone. In earlier analysis, I identified the 1.281–1.285 region as a base, and a rally above that, especially reaching near 1.292, indicates that the move might be overshooting its sustainable range. This aligns with my view that the rally is overextended and a pullback could be imminent.
Candlestick Insights and Intraday Reversal Clues:
Looking at these recent candles, I notice that while the 10:00 candle closed with an upward gain (+21.8 pips) and the 9:00 candle also posted an upward move (+22.3 pips), the overall pattern shows modest moves with small bodies, suggesting that buyers are active but perhaps not strongly in control. There’s also that slight dip at 1:00 AM (a -15.0 pip move) which hints at the underlying volatility and potential exhaustion. These factors lead me to believe that the recent rally may be unsustainable.
Indicator and Fundamental Context Reinforced:
My previous analysis—supported by an overbought RSI reading on the 1‑hour and the overall bearish technical patterns (like the bearish marubozu and long-line bearish candles) on lower timeframes—remains valid. The fresh fundamental news adding volatility likely contributed to this impulsive rally, and now the market appears to be testing its high without much conviction.
What I’m Watching and the Trade Setup Going Forward:
Given this recent data, I’m focused on the area between 1.292 and 1.290. If I see a clear reversal pattern (for example, a bearish engulfing candle or a pin bar developing on the 15‑minute chart around these levels), that would confirm my expectation of sellers stepping in.
I’d look to enter a short position around 1.292–1.290, with a stop-loss set just above the current high (around 1.296–1.297) to account for typical volatility. This approach is consistent with targeting a move down toward support in the 1.278–1.281 range, offering a favorable risk/reward ratio.

GBP/USD Technical Analysis: Key Levels and Trade SetupThis chart represents a technical analysis of the GBP/USD currency pair on a 15-minute timeframe, using exponential moving averages (EMAs) and key levels.
Key Observations:
1. EMA Indicators:
The 200-period EMA (blue) is at 1.29238.
The 30-period EMA (red) is at 1.29155.
Price is currently below the 200 EMA, indicating a potential bearish trend.
2. Support and Resistance:
Resistance Level: 1.29346 (highlighted in blue).
Support Zone: Around 1.28857 (purple highlighted area).
3. Trading Plan:
The price is currently consolidating in a range between the support and resistance levels.
If the price breaks above 1.29346, it could move towards the target of 1.29720.
If the price fails to break resistance and falls below support (1.28857), a bearish

GBPUSD 4H SHORT [UPdate]In line with expectations of a decline in GBPUSD, the price interacted with the primary order block. To feel safe in this position, I move the stop order to $1.29620
I expect the downward trend I mentioned in the main review to continue to my targets:
$1.28609
$1.28030
$1.27534
$1.26722

GBPUSD 4H SHORTAt the moment, GBPUSDT the asset is being marked down. There was a price reaction to the POI range from which a reaction was received instantly. I missed this moment due to personal matters, although there was a reminder. I understand that the risk of not opening, or the receipt of new variables from the market, can break the trend, but I will try to open a short from the designated mark 1.29686$
Targets
$1.28609
$1.28030
$1.27534
$1.26722
Risk for stop order -1%

GBPUSD GBPUSD Analysis & Signal (1H Timeframe)
📅 Date: March 23, 2025
On the GBP/USD chart, the price has reached a key resistance zone around 1.29629 after an uptrend, showing signs of rejection. This resistance aligns with a descending trendline, adding to the selling pressure.
Currently, the price is heading toward the demand zone marked between 1.28613 and 1.28117, which could act as a strong support level.
Signal:
Sell:
📍Entry Point: 1.29114 (current price)
🔴Stop Loss: 1.29629 (above resistance)
🟢Take Profit 1: 1.28613
🟢Take Profit 2: 1.28117
⚠️Risk Management:
With the stop loss set above the resistance, the risk-to-reward ratio (R:R) for this trade is at least 1:2. It’s recommended to risk only 1-2% of your capital on this trade.
📝Note: Before entering the trade, wait for additional confirmations (e.g., reversal candlestick patterns or a break of the zone) and assess market conditions.

GBP/USD Trade idea
GBP/USD is currently around 1.29165.
A recent bearish move has been observed.
There is a Fair Value Gap (FVG) on the H4 timeframe just above the current price.
Expected Price Action (Blue Path):
Price might first move upwards to fill the H4 Fair Value Gap, potentially reaching the 1.29801 level (previous high area).
This area could act as a liquidity grab or inducement zone.
Main Expectation (Red Path):
After hitting the FVG area and liquidity zone, the price is expected to reverse downward.
The target for this move is 1.28121, where there is another key demand area / Weekly Fair Value Gap (W-FVG).
Key Levels:
FVG (H4) – Target for potential upward move.
1.29801 – Liquidity / potential reversal zone.
1.28121 – Main downside target after rejection.

GBPUSD Selling Opportunities SpottedWe are basically anticipating for more selling momentum as price formed a wedge at a resistance level. Also, lower timeframe price action shows more bearish activities.

GBP/USD 30-Minute Bearish Trade Setup & Analysis200 EMA (Blue) at 1.29285 – Represents long-term trend support/resistance.
30 EMA (Red) at 1.29329 – Represents short-term trend direction.
Trade Setup:
Entry: The trade seems to enter near the 30 EMA after price rejects a resistance zone (highlighted in purple).
Stop Loss: Placed above the resistance zone at around 1.29564 - 1.29568.
Take Profit Levels:
TP1: ~1.29250
TP2: ~1.28996
TP3: Final target at ~1.28827
Market Analysis:
The price has rejected the 30 EMA, signaling potential bearish movement.
The downtrend projection suggests a possible break below 1.29250, aiming for the lower support levels.
The risk-to-reward ratio appears favorable, with a tight stop loss and multiple profit-taking points.
Possible Scenarios:
Bearish Case (High Probability): If price stays below the 30 EMA, it may continue down towards the target points.
Bullish Case (Low Probability): If price breaks above the resistance zone, it could invalidate the short setup, triggering the stop loss.
Would you like a deeper analysis or confirmation with another indicator?

GBPUSD SHORTOn the weekly time frame, the first blue line is in a very attractive price range where we are likely to see a trend reversal, even a small one. This reversal can be up to 4%. I have 2 ranges above, the sacred 86 line and the range ceiling line. The POC time band is also in this area and overall it is a very good area and worth the risk. Please enter the trade on the trend reversal. I will update this position again and give an entry point when the trend wants to reverse.

GBP/USD SELL IDEA (R:R=5)Selling GBP/USD now. I placed a sell earlier at 1.29276 after seeing a wonderful BUTTERFLY form on the 30 min chart. Already starting to form lower highs and lower lows on smaller timeframes.
Stop Loss is: 1.29552
(Due to SL hunting)
Please move SL to break even when trade is 100+ pips in profit.
1st Target: 1.26730
2nd Target: 1.26072
3rd Target: 1.25680
Happy Trading! :)

GBPUSD BUY 📊 Technical Analysis & Entry Signal 💹
🔍 The chart shows a strong uptrend where the price has broken a key resistance level and is now pulling back to retest it. As highlighted in the analysis, it's crucial to wait for a complete pullback and confirmation before entering a trade.
📈 Entry Signal:
✅ Entry: After pullback confirmation around 1.27570
🎯 Targets:
First Target: 1.27952
Second Target: 1.28269
Third Target: 1.28645
🛑 Stop Loss: 1.27414 (Risk management is essential)
📝 Important Note: Always manage your risk and avoid entering without confirmation. 📉

British Pound / U.S. DollarPound Chart Update
Hello dear traders,
According to the DXY analysis, I have identified the suitable entry point for the Pound. Friends, please use the 15-minute timeframe for optimal entry, and be sure to pay attention to the reversal zones. You can even take advantage of these zones for minor fluctuations. Note that this chart is bullish in the daily timeframe, and this is a temporary correction, so it has rapid upward movements—be careful.
Important Points:
Support (4H): 1.25232
Secret Order Block (4H): 1.24323 & 1.23748
And finally, our main target is 1.22648.
Thank you for your support. A very simple and clear chart has been drawn for your use.
Wishing you all success!
Fereydoon Bahrami
A retail trader in the Wall Street Trading Center (Forex)
Risk Disclosure:
Trading in the Forex market is risky due to high price volatility. This analysis is solely my personal opinion and should not be considered financial advice. Please do your own research. You are responsible for any profits or losses resulting from this analysis.

GBP/USD at Key Resistance: Potential Reversal or Continuation?The GBP/USD 15-minute chart indicates a strong uptrend, with price action forming a **Crab harmonic pattern**, suggesting a potential overextension. The pair has reached a key resistance zone at **1.26323**, aligning with significant Fibonacci levels, with the **Harmonic Optimal Point (HOP) at 1.26469** acting as a potential reversal area.
If a pullback occurs, the first downside targets are 1.26127 and 1.25993 , while the ** 200 EMA ** below may provide further support. A sustained break above 1.26469 could signal continued bullish momentum. Traders should monitor price action for confirmation before positioning accordingly.

GBP/USD Market Analysis – Bearish Reversal from Harmonic PatternThe GBP/USD pair has completed a Crab harmonic pattern , with price reaching the 1.618 extension level and reacting strongly at resistance near 1.2617. The rejection suggests a potential bearish reversal.
Initial downside targets (T1 and T2) are at 1.2515 and 1.2445. If price sustains below 1.2593 (AB=CD level), further downside is likely. However, a breakout above the high could invalidate the bearish setup. Traders should watch for confirmation signals before taking positions.
