GBPUSD Will Go Lower! Sell!
Take a look at our analysis for GBPUSD.
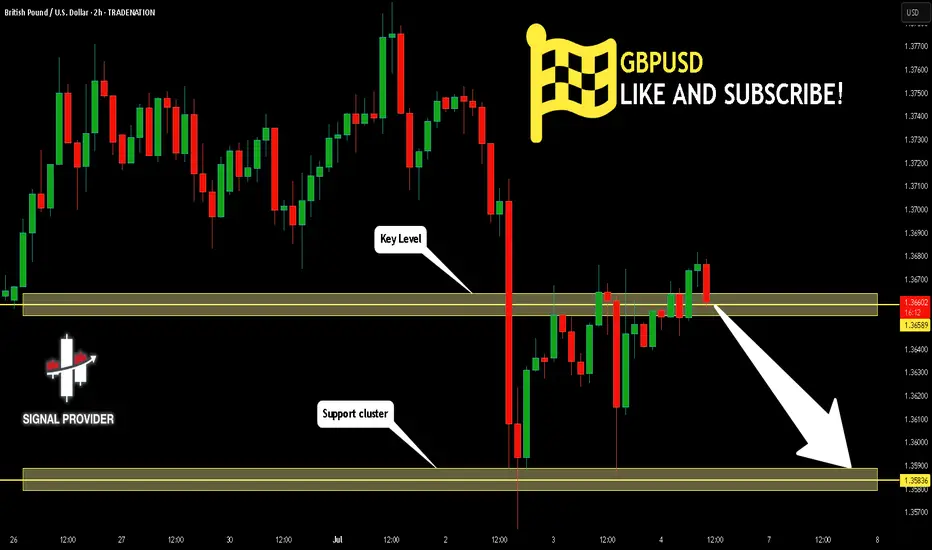
Time Frame: 2h
Current Trend: Bearish
Sentiment: Overbought (based on 7-period RSI)
Forecast: Bearish
The market is testing a major horizontal structure 1.365.
Taking into consideration the structure & trend analysis, I believe that the market will reach 1.358 level soon.
P.S
Overbought describes a period of time where there has been a significant and consistent upward move in price over a period of time without much pullback.
Disclosure: I am part of Trade Nation's Influencer program and receive a monthly fee for using their TradingView charts in my analysis.
Like and subscribe and comment my ideas if you enjoy them!
GBPUSD
Will The Prospect of a BoE Rate Cut Continue to Dampen GBPUSD?Macro approach:
- GBPUSD has weakened since last week, pressured by disappointing UK economic data and rising expectations of a BoE rate cut. Meanwhile, the US dollar found support amid cautious risk sentiment and anticipation of key US inflation data.
- UK GDP contracted for a second consecutive month in May, and recent labor market surveys signaled further cooling, reinforcing the case for the BoE's monetary easing. Governor Bailey reiterated that the path for rates is "downward," with markets now pricing in a high probability of a cut at the Aug meeting.
- Meanwhile, the US dollar was buoyed by safe-haven flows and firm inflation expectations ahead of the US CPI release, highlighting policy divergence between the Fed and BoE.
- GBPUSD may remain under pressure as traders await UK inflation and employment data, which could influence the BoE's next move. The pair could see further volatility with US CPI and Fed commentary also on the radar as potential catalysts.
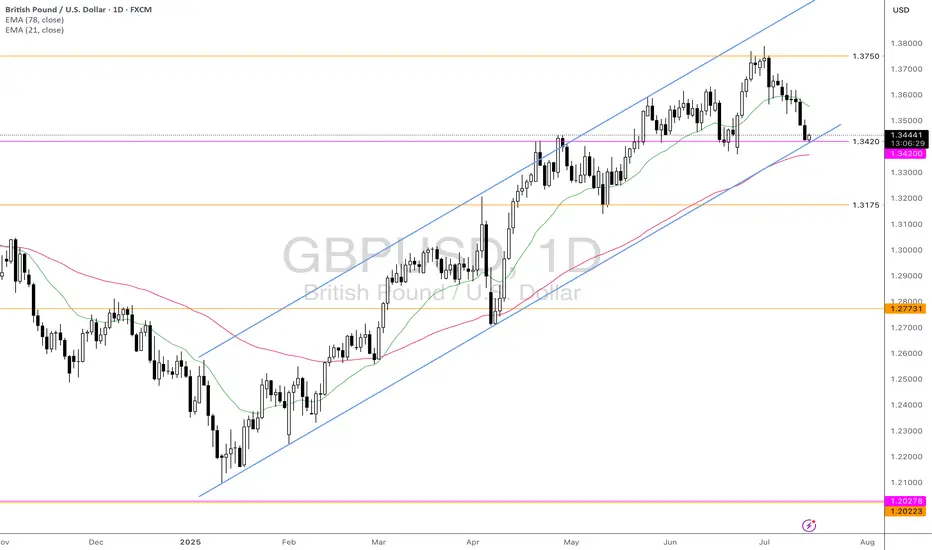
Technical approach:
- GBPUSD is retesting the ascending channel's lower bound, confluence with the key support at 1.3420. The price is between both EMAs, indicating a sideways movement. GBPUSD awaits an apparent breakout to determine the short-term trend.
- If GBPUSD breaches below the support at 1.3420, the price may plunge toward the following support at 1.3175.
- On the contrary, holding above 1.3420 may prompt a short correction to retest EMA21.
Analysis by: Dat Tong, Senior Financial Markets Strategist at Exness
GBPUSD LONG FORECAST Q3 D15 W29 Y25GBPUSD LONG FORECAST Q3 D15 W29 Y25
Welcome back to the watchlist GBPUSD ! Let's go long ! Alignment across all time frames.
Professional Risk Managers👋
Welcome back to another FRGNT chart update📈
Diving into some Forex setups using predominantly higher time frame order blocks alongside confirmation breaks of structure.
Let’s see what price action is telling us today!
💡Here are some trade confluences📝
✅Daily order block
✅1H Order block
✅Intraday breaks of structure
✅4H Order block
📈 Risk Management Principles
🔑 Core Execution Rules
Max 1% risk per trade
Set alerts — let price come to your levels
Minimum 1:2 RR
Focus on process, not outcomes
🧠 Remember, the strategy works — you just need to let it play out.
🧠 FRGNT Insight of the Day
"The market rewards structure and patience — not emotion or urgency."
Execute like a robot. Manage risk like a pro. Let the chart do the talking.
🏁 Final Words from FRGNT
📌 GBPUSD is offering textbook alignment — structure, order flow, and confirmation all check out.
Let’s approach the trade with clarity, conviction, and risk-managed execution.
🔑 Remember, to participate in trading comes always with a degree of risk, therefore as professional risk managers it remains vital that we stick to our risk management plan as well as our trading strategies.
📈The rest, we leave to the balance of probabilities.
💡Fail to plan. Plan to fail.
🏆It has always been that simple.
❤️Good luck with your trading journey, I shall see you at the very top.
🎯Trade consistent, FRGNT X

Triangle Formation (Rising wedge STF) I believe we can see some downside here. Price has bounced of the 61.8 fib level and looks to have created a triangle pattern. I’m not currently in any positions, I will wait for a breakout of the rising wedge for a short position.

Targets Hit So as you can see previously I stated that I was waiting for a breakout of the rising wedge before I entered this trade. Now it didn't go quite as planned as price made a bigger rising wedge from what I originally mapped out but nonetheless I was able to recognise, it re-adjust and enter the trade. Price hit both targets.

Fundamental Market Analysis for July 15, 2025 GBPUSDEvents to watch today:
15:30 EET. USD - Consumer Price Index
23:00 EET. GBP - BOE Governor Andrew Bailey Speaks
GBPUSD:
Sterling is on the back foot—the rate has dropped toward 1.34500—after the U.S. announced sweeping 30‑percent tariffs on goods from the EU and Mexico, triggering capital flows into dollar assets. The pound was further pressured by lacklustre GDP figures: the U.K. economy expanded by only 0.1 % q/q in Q2, bolstering expectations that the Bank of England could cut rates as early as August.
Exclusive for our readers – a 202% bonus on deposits of $202 or more! Give the promo code BTC202 to customer support and start trading with TRIPLED capital.
On the U.S. side, traders await the June CPI print, which is expected to show inflation quickening to 2.7 % y/y. Combined with a resilient labour market, such a reading could deter the Fed from an early policy pivot and lend the dollar extra support. The yield gap and diverging policy trajectories accentuate the downward bias in GBPUSD.
Political risk is likewise working against the pound: talks between London and Brussels on a ‘steel package’ are stalling, and Governor Andrew Bailey’s recent warnings about labour‑market softness underline the BoE’s dovish tilt. As long as the backdrop remains unchanged, the pair can slide toward 1.3350; a rebound above 1.34800 would likely require an unexpectedly soft U.S. inflation print.
Trading recommendation: SELL 1.34500, SL 1.34800, TP 1.33500
GBPUSD pre CPI move potential long into shortGBPUSD resting at support, i prefer to trade into Monday liquidity before major sell off, UK tends to push price higher in mornings to continue sell off later that day. Caution advised, neither are confirmed
GBPUSD downtrend continuesOANDA:GBPUSD is trading in a bearish channel heading towards the important support zone of 1.340. This is the bottom support zone of last month so there is a lot of buying pressure in this zone. Any recovery of GBPUSD is considered a good opportunity to enter a SELL signal to the target. When the price breaks 1.361, the downtrend will really break.
Support: 1.340
Resistance: 1.355-1.361
SELL Trigger: rejection 1.355 with bearish confirmation
SELL zone 1.361 (Strong Resistance zone)
Target: 1.340
Leave your comments on the idea. I am happy to read your views.
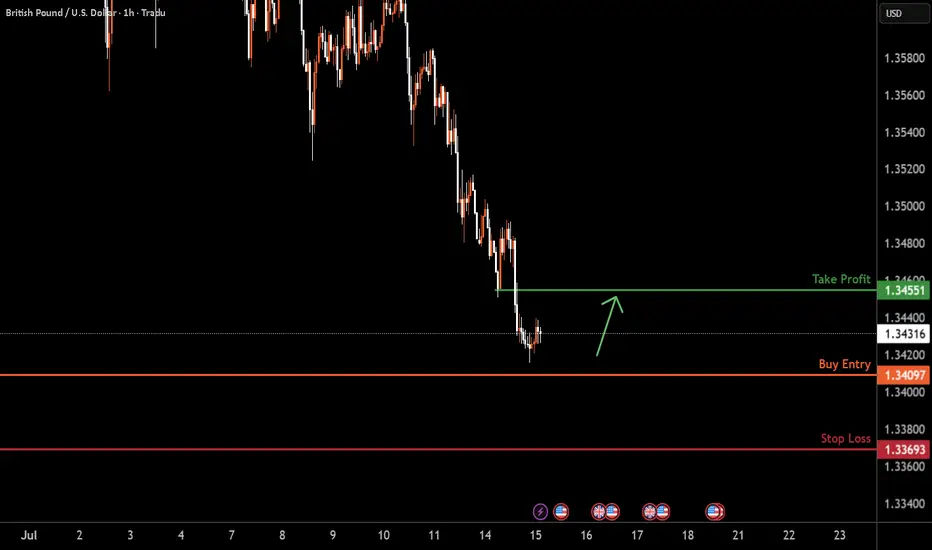
GBPUSD H1 I Bullish Reversal Based on the H1 chart analysis, we can see that the price could fall toward our buy entry at 1.3409, which is a pullback support.
Our take profit will be at 1.3455, which is a pullback resistance level.
The stop loss will be placed at 1.3369, a swing low support
High Risk Investment Warning
Trading Forex/CFDs on margin carries a high level of risk and may not be suitable for all investors. Leverage can work against you.
Stratos Markets Limited (tradu.com ):
CFDs are complex instruments and come with a high risk of losing money rapidly due to leverage. 63% of retail investor accounts lose money when trading CFDs with this provider. You should consider whether you understand how CFDs work and whether you can afford to take the high risk of losing your money.
Stratos Europe Ltd (tradu.com ):
CFDs are complex instruments and come with a high risk of losing money rapidly due to leverage. 63% of retail investor accounts lose money when trading CFDs with this provider. You should consider whether you understand how CFDs work and whether you can afford to take the high risk of losing your money.
Stratos Global LLC (tradu.com ):
Losses can exceed deposits.
Please be advised that the information presented on TradingView is provided to Tradu (‘Company’, ‘we’) by a third-party provider (‘TFA Global Pte Ltd’). Please be reminded that you are solely responsible for the trading decisions on your account. There is a very high degree of risk involved in trading. Any information and/or content is intended entirely for research, educational and informational purposes only and does not constitute investment or consultation advice or investment strategy. The information is not tailored to the investment needs of any specific person and therefore does not involve a consideration of any of the investment objectives, financial situation or needs of any viewer that may receive it. Kindly also note that past performance is not a reliable indicator of future results. Actual results may differ materially from those anticipated in forward-looking or past performance statements. We assume no liability as to the accuracy or completeness of any of the information and/or content provided herein and the Company cannot be held responsible for any omission, mistake nor for any loss or damage including without limitation to any loss of profit which may arise from reliance on any information supplied by TFA Global Pte Ltd.
The speaker(s) is neither an employee, agent nor representative of Tradu and is therefore acting independently. The opinions given are their own, constitute general market commentary, and do not constitute the opinion or advice of Tradu or any form of personal or investment advice. Tradu neither endorses nor guarantees offerings of third-party speakers, nor is Tradu responsible for the content, veracity or opinions of third-party speakers, presenters or participants.
Market Watch UPDATES! FOREX Major PairsWelcome to the Market Watch Updates for Monday, July 14th.
In this video, we will give the forecast updates for the following markets:
USD Index, EURUSD, GBPUSD, AUDUSD, NZDUSD, USDCAD, USDCHF and USDJPY.
Enjoy!
May profits be upon you.
Leave any questions or comments in the comment section.
I appreciate any feedback from my viewers!
Like and/or subscribe if you want more accurate analysis.
Thank you so much!
Disclaimer:
I do not provide personal investment advice and I am not a qualified licensed investment advisor.
All information found here, including any ideas, opinions, views, predictions, forecasts, commentaries, suggestions, expressed or implied herein, are for informational, entertainment or educational purposes only and should not be construed as personal investment advice. While the information provided is believed to be accurate, it may include errors or inaccuracies.
I will not and cannot be held liable for any actions you take as a result of anything you read here.
Conduct your own due diligence, or consult a licensed financial advisor or broker before making any and all investment decisions. Any investments, trades, speculations, or decisions made on the basis of any information found on this channel, expressed or implied herein, are committed at your own risk, financial or otherwise.

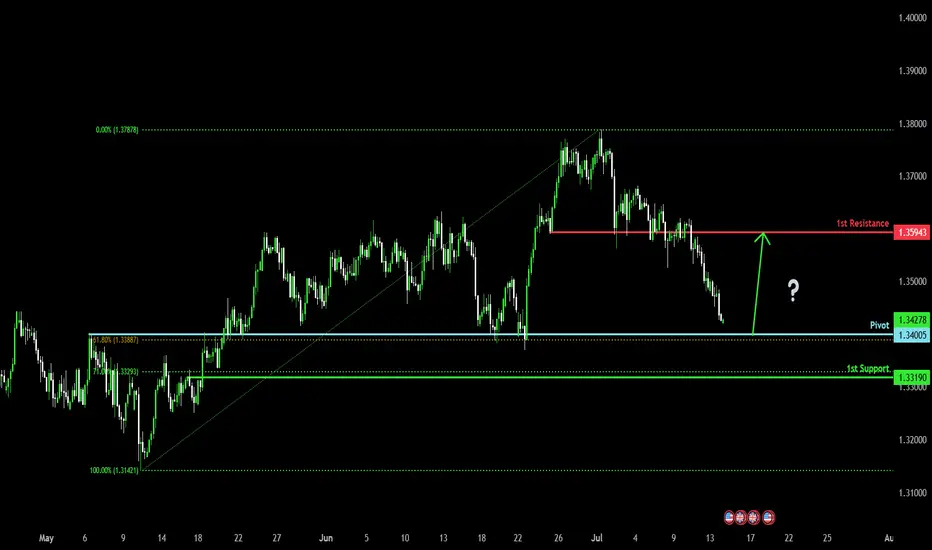
Falling towards major support?The Cable (GBP/USD) is falling towards the pivot which has been identified as an overlap support that lines up with the 61.8% Fibonacci retracement and could reverse to the 1st resistance.
Pivot: 1.3400
1st Support: 1.3319
1st Resistance: 1.3594
Risk Warning:
Trading Forex and CFDs carries a high level of risk to your capital and you should only trade with money you can afford to lose. Trading Forex and CFDs may not be suitable for all investors, so please ensure that you fully understand the risks involved and seek independent advice if necessary.
Disclaimer:
The above opinions given constitute general market commentary, and do not constitute the opinion or advice of IC Markets or any form of personal or investment advice.
Any opinions, news, research, analyses, prices, other information, or links to third-party sites contained on this website are provided on an "as-is" basis, are intended only to be informative, is not an advice nor a recommendation, nor research, or a record of our trading prices, or an offer of, or solicitation for a transaction in any financial instrument and thus should not be treated as such. The information provided does not involve any specific investment objectives, financial situation and needs of any specific person who may receive it. Please be aware, that past performance is not a reliable indicator of future performance and/or results. Past Performance or Forward-looking scenarios based upon the reasonable beliefs of the third-party provider are not a guarantee of future performance. Actual results may differ materially from those anticipated in forward-looking or past performance statements. IC Markets makes no representation or warranty and assumes no liability as to the accuracy or completeness of the information provided, nor any loss arising from any investment based on a recommendation, forecast or any information supplied by any third-party.
GBPUSD(20250714)Today's AnalysisMarket news:
① Fed's Goolsbee: The latest tariff threat may delay rate cuts. ② The Fed responded to the White House's "accusations": The increase in building renovation costs partly reflects unforeseen construction conditions. ③ "Fed's megaphone": The dispute over building renovations has challenged the Fed's independence again, and it is expected that no rate cuts will be made this month. ④ Hassett: Whether Trump fires Powell or not, the Fed's answer to the headquarters renovation is the key.
Technical analysis:
Today's buying and selling boundaries:
1.3518
Support and resistance levels:
1.3621
1.3583
1.3558
1.3479
1.3454
1.3415
Trading strategy:
If the price breaks through 1.3518, consider buying in, with the first target price at 1.3558
If the price breaks through 1.3479, consider selling in, with the first target price at 1.3454

GBPUSD: Two Strong Bullish Area To Buy From ?GU is currently in a bullish trend when examined on a daily time frame. There are two potential areas for purchase. The first area is currently active, as we anticipate a price reversal from this point. There is a significant possibility that price could decline to the second area and subsequently reverse from there directly. The sole reason we believe price could drop to the second area is if the US Dollar experiences corrections, which could cause GU to drop to our second area and subsequently rebound.
If you appreciate our analysis, we kindly request that you consider the following actions:
-Liking the Ideas
-Commenting on the Ideas
-Sharing the Ideas
We extend our sincere gratitude for your continuous support. We trust that our insights have provided even a modicum of assistance.
Team Setupsfx_
❤️🚀

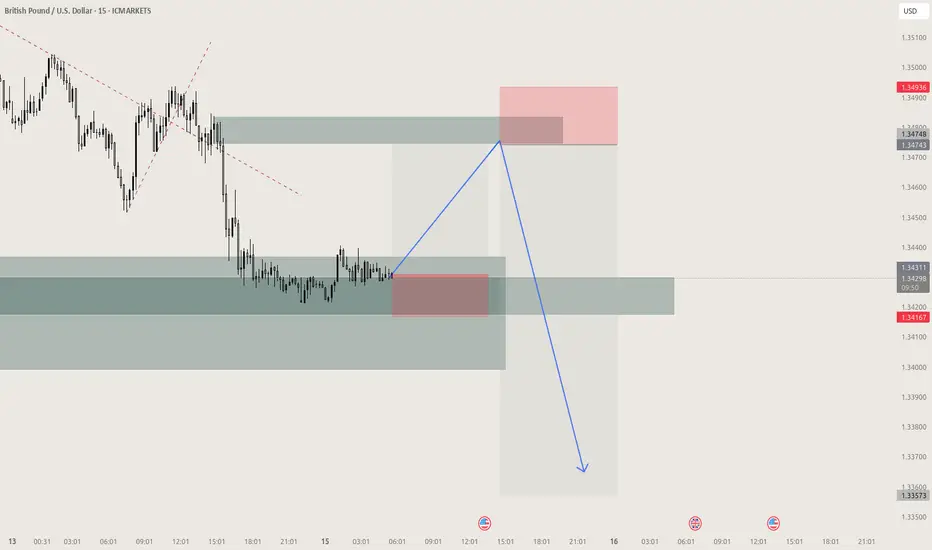
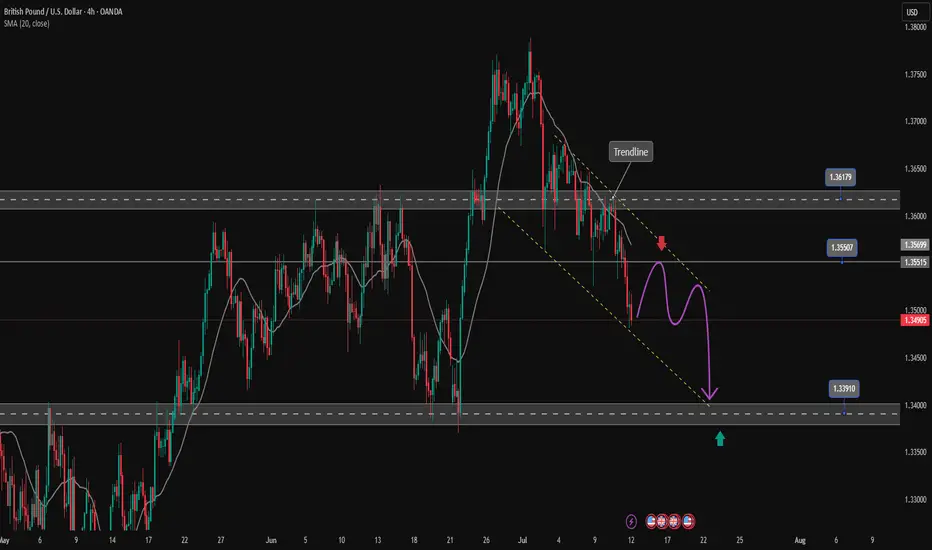
Skeptic | GBP/USD Update: Triggers Fired Up!Hey everyone, it’s Skeptic! ;) yesterday, the support at 1.35672 saw a fake breakout and snapped back into the 4-hour box we’ve been tracking. But bearish momentum is still strong, so here’s the play:
✔️ If you opened a short already , With the fake breakout signaling potential momentum shift, consider taking profits or closing if price consolidates above 1.36089. Why? The fakeout increases the chance of a momentum change.
✨ For new short positions , the 1.35672 break remains a valid trigger. If it breaks again, it could kickstart a major bearish leg, targeting lower supports at 1.35000 and 1.34227 —both strong reaction zones.
📊 The HWC is uptrend, so shorts need extra caution—reduce risk or take profits early.
📉 For longs , wait for a break and consolidation above 1.36406 . This level saw a strong rejection, signaling it’s a key resistance the market respects. A break here, liquidating short positions (which means buying), could spark a solid uptrend leg with great R/R potential.
🔔 Confirmation : Use RSI entering oversold for shorts or overbought for longs. The HWC uptrend means shorts carry higher risk, so tighten your risk management—stick to 1%–2% risk per trade.
🔼 Key Takeaway: Short at 1.35672 if it breaks again, long at 1.36406 with confirmation. Stay sharp for momentum shifts and keep stops tight. I’ll update if the market structure flips!
💬 Let’s Talk!
Which GBP/USD trigger are you locked on? Hit the comments, and let’s crush it together! 😊 If this update lit your fire, smash that boost—it fuels my mission! :)))

XAU/USD : Gold at a Turning Point – Rejection or Breakout Ahead?By analyzing the TVC:GOLD (XAUUSD) chart on the 4-hour timeframe, we can see that price climbed to $3330 today, entering a key supply zone, which triggered a pullback down to $3310. Gold is now trading around $3317, and I’m watching several potential setups closely.
Scenario 1:
If gold stabilizes below $3320, we could see a bearish move toward $3296.
Scenario 2:
If price breaks above the $3333 resistance, it may enter the next supply zone between $3341 and $3351, which could trigger a strong rejection—potentially offering a 100 to 400 pip move.
Now let’s break down the key levels to watch:
Supply zones: $3320, $3333, $3342, $3358
Demand zones: $3303, $3296, $3289, $3278
Monitor how price reacts to each of these zones — they may provide excellent opportunities.

GBPUSD Will Go Up! Long!
Take a look at our analysis for GBPUSD.
Time Frame: 6h
Current Trend: Bullish
Sentiment: Oversold (based on 7-period RSI)
Forecast: Bullish
The market is on a crucial zone of demand 1.347.
The oversold market condition in a combination with key structure gives us a relatively strong bullish signal with goal 1.358 level.
P.S
The term oversold refers to a condition where an asset has traded lower in price and has the potential for a price bounce.
Overbought refers to market scenarios where the instrument is traded considerably higher than its fair value. Overvaluation is caused by market sentiments when there is positive news.
Disclosure: I am part of Trade Nation's Influencer program and receive a monthly fee for using their TradingView charts in my analysis.
Like and subscribe and comment my ideas if you enjoy them!

GBPUSD INTRASDAY corrective pullback support at 1.3430The GBPUSD remains in a bullish trend, with recent price action showing signs of a corrective pullback within the broader uptrend.
Support Zone: 1.3430 – a key level from previous consolidation. Price is currently testing or approaching this level.
A bullish rebound from 1.3430 would confirm ongoing upside momentum, with potential targets at:
1.3600 – initial resistance
1.3670 – psychological and structural level
1.3730 – extended resistance on the longer-term chart
Bearish Scenario:
A confirmed break and daily close below 1.3430 would weaken the bullish outlook and suggest deeper downside risk toward:
1.3370 – minor support
1.3300 – stronger support and potential demand zone
Outlook:
Bullish bias remains intact while the FTSE holds above 1.3430. A sustained break below this level could shift momentum to the downside in the short term.
This communication is for informational purposes only and should not be viewed as any form of recommendation as to a particular course of action or as investment advice. It is not intended as an offer or solicitation for the purchase or sale of any financial instrument or as an official confirmation of any transaction. Opinions, estimates and assumptions expressed herein are made as of the date of this communication and are subject to change without notice. This communication has been prepared based upon information, including market prices, data and other information, believed to be reliable; however, Trade Nation does not warrant its completeness or accuracy. All market prices and market data contained in or attached to this communication are indicative and subject to change without notice.

EURUSD and GBPUSD are preparing to continue the upward trendAfter a significant rise in the EURUSD and GBPUSD, they have formed a descending price channel, and it is expected that this channel will be broken to complete the upward trend, because there is no sign of weakness yet, and the Main Lows have not yet been broken.

GBPUSD → Correction amid a global bullish trend...FX:GBPUSD is testing the 1.345 - 1.35 area as part of a correction. The price is closing the imbalance zone and testing support, which may trigger a reaction. Further developments will largely depend on the dollar, which is testing resistance.
The daily market structure is quite strong. The correction against the backdrop of a strong trend is within acceptable limits, and bulls should fight to keep the price away from risk zones. GBPUSD, as part of the correction, closes the imbalance zone of 1.34 - 1.35 (0.7 - 0.79f) and forms a false breakdown of the intermediate support level of 1.3476. If buyers hold their ground in the 1.347-1.35 zone, the currency pair will be able to return to the global trend.
Support levels: 1.3476, 1.345, 1.3382
Resistance levels: 1.3511, 1.359, 1.375
Price consolidation above 1.349 - 1.350 will confirm the market's intentions. In this case, we can expect growth to 1.36 - 1.374.
Best regards, R. Linda!

Cable H4 | Pullback resistance at 23.6% Fibonacci retracementCable (GBP/USD) is rising towards a pullback resistance and could potentially reverse off this level to drop lower.
Sell entry is at 1.3533 which is a pullback resistance that aligns with the 23.6% Fibonacci retracement.
Stop loss is at 1.3630 which is a level that sits above the 50% Fibonacci retracement and an overlap resistance.
Take profit is at 1.3392 which is a multi-swing-low support.
High Risk Investment Warning
Trading Forex/CFDs on margin carries a high level of risk and may not be suitable for all investors. Leverage can work against you.
Stratos Markets Limited (tradu.com ):
CFDs are complex instruments and come with a high risk of losing money rapidly due to leverage. 63% of retail investor accounts lose money when trading CFDs with this provider. You should consider whether you understand how CFDs work and whether you can afford to take the high risk of losing your money.
Stratos Europe Ltd (tradu.com ):
CFDs are complex instruments and come with a high risk of losing money rapidly due to leverage. 63% of retail investor accounts lose money when trading CFDs with this provider. You should consider whether you understand how CFDs work and whether you can afford to take the high risk of losing your money.
Stratos Global LLC (tradu.com ):
Losses can exceed deposits.
Please be advised that the information presented on TradingView is provided to Tradu (‘Company’, ‘we’) by a third-party provider (‘TFA Global Pte Ltd’). Please be reminded that you are solely responsible for the trading decisions on your account. There is a very high degree of risk involved in trading. Any information and/or content is intended entirely for research, educational and informational purposes only and does not constitute investment or consultation advice or investment strategy. The information is not tailored to the investment needs of any specific person and therefore does not involve a consideration of any of the investment objectives, financial situation or needs of any viewer that may receive it. Kindly also note that past performance is not a reliable indicator of future results. Actual results may differ materially from those anticipated in forward-looking or past performance statements. We assume no liability as to the accuracy or completeness of any of the information and/or content provided herein and the Company cannot be held responsible for any omission, mistake nor for any loss or damage including without limitation to any loss of profit which may arise from reliance on any information supplied by TFA Global Pte Ltd.
The speaker(s) is neither an employee, agent nor representative of Tradu and is therefore acting independently. The opinions given are their own, constitute general market commentary, and do not constitute the opinion or advice of Tradu or any form of personal or investment advice. Tradu neither endorses nor guarantees offerings of third-party speakers, nor is Tradu responsible for the content, veracity or opinions of third-party speakers, presenters or participants.

GBPUSD Week 29 Swing Zone/LevelsAfter 7 straight weeks of profitable gold trading, we’re shifting gears to GBPUSD.
Why this pair? It’s offering a classic low-risk, high-reward setup that many traders appreciate:
🔒 Stop Loss: 10–15 pips
🎯 Take Profit: 50–100 pips
We’re analyzing price action using a simple but powerful concept:
Each zone is drawn based on how the high and low of one day compares with the next. For example:
Monday’s high/low vs Tuesday’s range
Tuesday’s vs Wednesday’s, and so on
This method helps spot potential continuation zones as market structure unfolds across the week.
👉 The key? Patience, and letting the levels tell the story.
As always price action determines trades

GBPUSD LONG FORECAST Q3 D14 W29 Y25GBPUSD LONG FORECAST Q3 D14 W29 Y25
Welcome back to the watchlist GBPUSD ! Let's go long ! Alignment across all time frames.
Professional Risk Managers👋
Welcome back to another FRGNT chart update📈
Diving into some Forex setups using predominantly higher time frame order blocks alongside confirmation breaks of structure.
Let’s see what price action is telling us today!
💡Here are some trade confluences📝
✅Daily order block
✅1H Order block
✅Intraday breaks of structure
✅4H Order block
📈 Risk Management Principles
🔑 Core Execution Rules
Max 1% risk per trade
Set alerts — let price come to your levels
Minimum 1:2 RR
Focus on process, not outcomes
🧠 Remember, the strategy works — you just need to let it play out.
🧠 FRGNT Insight of the Day
"The market rewards structure and patience — not emotion or urgency."
Execute like a robot. Manage risk like a pro. Let the chart do the talking.
🏁 Final Words from FRGNT
📌 GBPUSD is offering textbook alignment — structure, order flow, and confirmation all check out.
Let’s approach the trade with clarity, conviction, and risk-managed execution.
🔑 Remember, to participate in trading comes always with a degree of risk, therefore as professional risk managers it remains vital that we stick to our risk management plan as well as our trading strategies.
📈The rest, we leave to the balance of probabilities.
💡Fail to plan. Plan to fail.
🏆It has always been that simple.
❤️Good luck with your trading journey, I shall see you at the very top.
🎯Trade consistent, FRGNT X

Descending Triangle Formation (GBPUSD)Here I can see a Descending Triangle Formation. I can see all the relevant characteristics such as the 4 touches, breakout and retest. Now it’s just a waiting game to see if it plays out.
