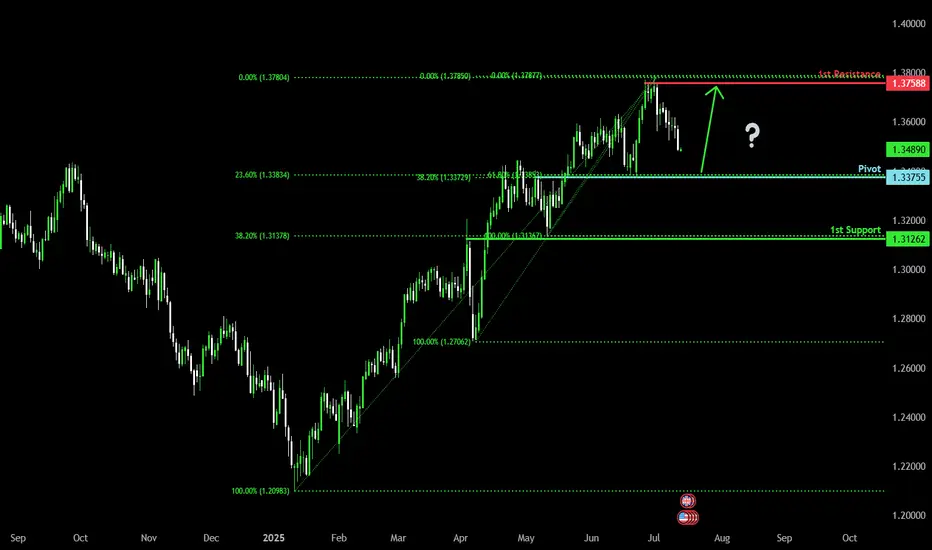
Bullish bounce off overlap support?The Cable (GBP/USD) is falling towards the pivot and could bounce to the 1st resistance which acts as a pullback resistance.
Pivot: 1.3375
1st Support: 1.3126
1st Resistance: 1.3758
Risk Warning:
Trading Forex and CFDs carries a high level of risk to your capital and you should only trade with money you can afford to lose. Trading Forex and CFDs may not be suitable for all investors, so please ensure that you fully understand the risks involved and seek independent advice if necessary.
Disclaimer:
The above opinions given constitute general market commentary, and do not constitute the opinion or advice of IC Markets or any form of personal or investment advice.
Any opinions, news, research, analyses, prices, other information, or links to third-party sites contained on this website are provided on an "as-is" basis, are intended only to be informative, is not an advice nor a recommendation, nor research, or a record of our trading prices, or an offer of, or solicitation for a transaction in any financial instrument and thus should not be treated as such. The information provided does not involve any specific investment objectives, financial situation and needs of any specific person who may receive it. Please be aware, that past performance is not a reliable indicator of future performance and/or results. Past Performance or Forward-looking scenarios based upon the reasonable beliefs of the third-party provider are not a guarantee of future performance. Actual results may differ materially from those anticipated in forward-looking or past performance statements. IC Markets makes no representation or warranty and assumes no liability as to the accuracy or completeness of the information provided, nor any loss arising from any investment based on a recommendation, forecast or any information supplied by any third-party.
GBPUSD
GBP_USD RISING SUPPORT AHEAD|LONG|
✅GBP_USD is going down now
But a strong rising support level is ahead
Thus I am expecting a rebound
And a move up towards the target of 1.3600
LONG🚀
✅Like and subscribe to never miss a new idea!✅
Disclosure: I am part of Trade Nation's Influencer program and receive a monthly fee for using their TradingView charts in my analysis.

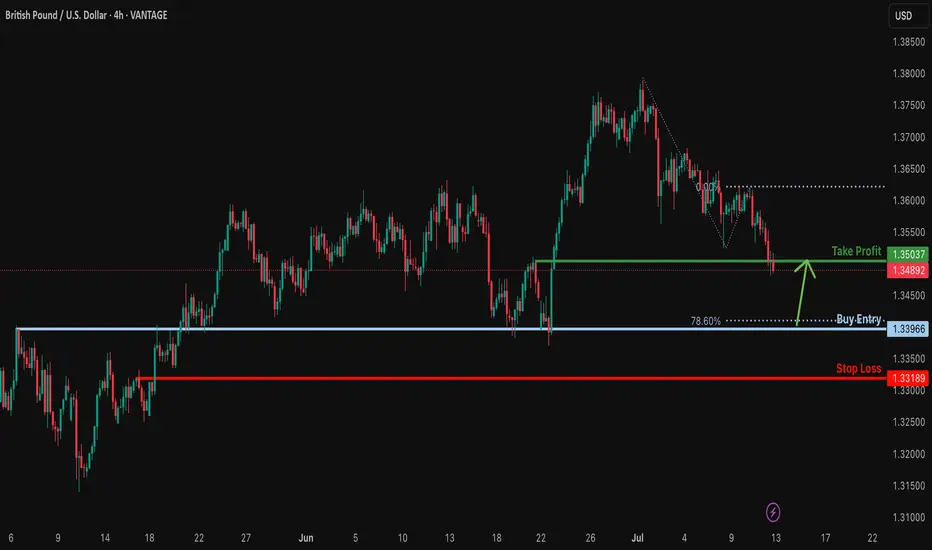
Falling towards major support?The Cable (GBP/USD) is falling towards the support which is an overlap support that lines up with the 78.6% Fibonacci projection and could bounce from this level to our take profit.
Entry: 1.3396
Why we like it:
There is an overlap support that lines up with the 78.6% Fibonacci projection.
Stop loss: 1.3318
Why we like it:
There is a pullback support.
Take profit: 1.3503
Why we like it:
There is a pullback support.
Enjoying your TradingView experience? Review us!
Please be advised that the information presented on TradingView is provided to Vantage (‘Vantage Global Limited’, ‘we’) by a third-party provider (‘Everest Fortune Group’). Please be reminded that you are solely responsible for the trading decisions on your account. There is a very high degree of risk involved in trading. Any information and/or content is intended entirely for research, educational and informational purposes only and does not constitute investment or consultation advice or investment strategy. The information is not tailored to the investment needs of any specific person and therefore does not involve a consideration of any of the investment objectives, financial situation or needs of any viewer that may receive it. Kindly also note that past performance is not a reliable indicator of future results. Actual results may differ materially from those anticipated in forward-looking or past performance statements. We assume no liability as to the accuracy or completeness of any of the information and/or content provided herein and the Company cannot be held responsible for any omission, mistake nor for any loss or damage including without limitation to any loss of profit which may arise from reliance on any information supplied by Everest Fortune Group.
GBPUSD is in the Selling DirectionHello Traders
In This Chart GBPUSD HOURLY Forex Forecast By FOREX PLANET
today GBPUSD analysis 👆
🟢This Chart includes_ (GBPUSD market update)
🟢What is The Next Opportunity on GBPUSD Market
🟢how to Enter to the Valid Entry With Assurance Profit
This CHART is For Trader's that Want to Improve Their Technical Analysis Skills and Their Trading By Understanding How To Analyze The Market Using Multiple Timeframes and Understanding The Bigger Picture on the Charts

USD Strengthens Against GBP With New Tariff AnnouncementsThis is the Weekly FOREX Forecast for the week of July 14 - 18th.
In this video, we will analyze the following FX market: GBPUSD
The latest headlines tell the story. The tariffs are triggering a slow run to the USD safe haven. The previous week showed the USD Index closed pretty strong, while GBPUSD weakened.
There's a good chance we'll see more of the same this coming week.
Look for the strength in USD to continue to be supported by fundamental news, and outperform the other major currencies, including the GBP.
Buy USD/xxx
Sell xxx/USD
Enjoy!
May profits be upon you.
Leave any questions or comments in the comment section.
I appreciate any feedback from my viewers!
Like and/or subscribe if you want more accurate analysis.
Thank you so much!
Disclaimer:
I do not provide personal investment advice and I am not a qualified licensed investment advisor.
All information found here, including any ideas, opinions, views, predictions, forecasts, commentaries, suggestions, expressed or implied herein, are for informational, entertainment or educational purposes only and should not be construed as personal investment advice. While the information provided is believed to be accurate, it may include errors or inaccuracies.
I will not and cannot be held liable for any actions you take as a result of anything you read here.
Conduct your own due diligence, or consult a licensed financial advisor or broker before making any and all investment decisions. Any investments, trades, speculations, or decisions made on the basis of any information found on this channel, expressed or implied herein, are committed at your own risk, financial or otherwise.

GBPUSD Bearish Signal | Technical + Custom AlgoSmart Trend Signal | Technical Analysis + Custom Algorithm
This signal is the result of a combination of classic technical trend analysis and a proprietary software I personally developed.
GBPUSDGBPUSD is close to giving us a good upward reaction, wait for an impulse for upside soon before you look for buys.
Disclosure: We are part of Trade Nation's Influencer program and receive a monthly fee for using their TradingView charts in our analysis.

GBPUSD LONG TERM GBPUSD Live Trading Session/ GBPUSD analysis #forex #forextraining #forexHello Traders
In This Video GBPUSD HOURLY Forecast By World of Forex
today GBPUSD Analysis
This Video includes_ (GBPUSD market update)
GBPUSD Analysis today | Technical and Order Flow
#usdjpy #usdchftechnicalanalysis #usdjpytoday #gold
What is The Next Opportunity on GBPUSD Market
how to Enter to the Valid Entry With Assurance Profit?
This Video is For Trader's that Want to Improve Their Technical Analysis Skills and Their Trading By Understanding How To Analyze The Market Using Multiple Timeframes and Understanding The Bigger Picture on the Charts.
Disclaimer: Financial Trading Has Large Potential Rewards, But Also Large Potential Risk. You must be aware of the Risk and Be Welling to Accept Them in order to Trade the Financial Market . Please be Carefully With Your Money.
We are talking about future market, anything can Happen,Markets are Always like that.dnt Risky more Than 2% of your account
Now you can join with our "vip premium" service
Join us and let's make trading together

GBPUSD - Also continued downside continuationLooking at GU. This is a little bit ahead of its time in comparison to EU.
And what i mean by that is EU is a lot further away from its 4H demand zone compared to GBP so it will be super interesting to see how we react at the level we are fast approaching on GU.
I am in a short position as of Friday. I will be posting a video tomorrow showing exactly how and why i got short on GU so stay tuned for that one.
As always if there is anything else i can be of assistance with give me a message and i will be happy to answer any questions you may have

GBPUSD Long From Rising Support !
HI,Traders !
#GBPUSD is trading along
The rising support line
And the pair will soon hit
A trend-line from where we
Will be expecting a local
Bullish rebound and a
Further bullish move up !
Comment and subscribe to help us grow !

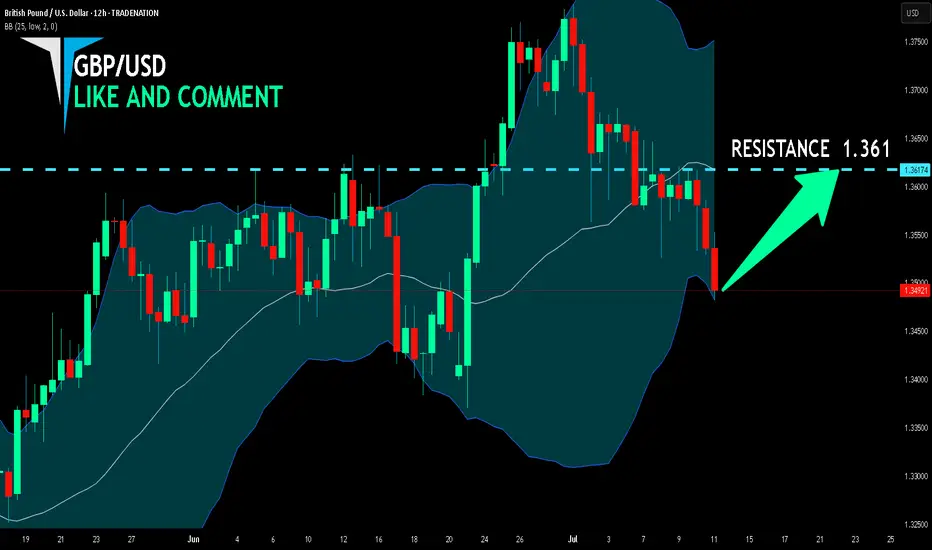
GBP/USD BULLS ARE GAINING STRENGTH|LONG
Hello, Friends!
It makes sense for us to go long on GBP/USD right now from the support line below with the target of 1.361 because of the confluence of the two strong factors which are the general uptrend on the previous 1W candle and the oversold situation on the lower TF determined by it’s proximity to the lower BB band.
Disclosure: I am part of Trade Nation's Influencer program and receive a monthly fee for using their TradingView charts in my analysis.
✅LIKE AND COMMENT MY IDEAS✅
GBP/USD - H1- Bearish Flag (07.07.2025)The GBP/USD Pair on the M30 timeframe presents a Potential Selling Opportunity due to a recent Formation of a Bearish Flag Pattern. This suggests a shift in momentum towards the downside in the coming hours.
Possible Short Trade:
Entry: Consider Entering A Short Position around Trendline Of The Pattern.
Target Levels:
1st Support – 1.3520
2nd Support – 1.3460
🎁 Please hit the like button and
🎁 Leave a comment to support for My Post !
Your likes and comments are incredibly motivating and will encourage me to share more analysis with you.
Best Regards, KABHI_TA_TRADING
Thank you.
Disclosure: I am part of Trade Nation's Influencer program and receive a monthly fee for using their TradingView charts in my analysis.

GBP-USD Swing Long! Buy!
Hello,Traders!
GBP-USD is trading in a
Long-term uptrend along
The rising support support
Line and the pair will soon
Hit it and from there we will
Be expecting a bullish
Rebound on Monday
Buy!
Comment and subscribe to help us grow!
Check out other forecasts below too!
Disclosure: I am part of Trade Nation's Influencer program and receive a monthly fee for using their TradingView charts in my analysis.

GBPUSD. The plan for the next few days.The nearest resistance zones are where it's interesting to look for purchases. We are waiting for a reaction and looking for an entry point.
The post will be adjusted if there are any changes.
Don't forget to click on the Rocket! =)

GBPUSD: Bullish Continuation & Long Signal
GBPUSD
- Classic bullish pattern
- Our team expects retracement
SUGGESTED TRADE:
Swing Trade
Buy GBPUSD
Entry - 1.3503
Stop - 1.3453
Take - 1.3608
Our Risk - 1%
Start protection of your profits from lower levels
Disclosure: I am part of Trade Nation's Influencer program and receive a monthly fee for using their TradingView charts in my analysis.
❤️ Please, support our work with like & comment! ❤️

British Pound Futures (6B1!) Face Supply Area.Pound Futures: 6B1 Area Tests Bearish Resolve
Pound Futures are approaching a critical weekly supply zone (6B1). Today's price action saw a touch and rejection of this level, marked by a bearish candlestick. This suggests a potential for a short-term pullback, and we're eyeing a re-entry opportunity at this level, watching for a drop to the next significant demand zone on our chart.
Further reinforcing the bearish outlook is an intriguing divergence in the Non-Commercial trader positions revealed in the latest Commitment of Traders (COT) report, noticeable on the daily chart. This divergence hints at a possible shift in sentiment, paving the way for a short position. Should the price successfully breach the 6B1 area, our chart indicates another supply zone as the next potential target.
✅ Please share your thoughts about 6B1! in the comments section below and HIT LIKE if you appreciate my analysis. Don't forget to FOLLOW ME; you will help us a lot with this small contribution.

GBPUSD - at ultimate region? Pound long??#GBPUSD... market reached at his ultimate region that is around 1.3450 to 1.3480
Keep close and don't hold shorts until holds.
Good luck
Trade wisely

GBPUSD Resistance Ahead!
HI,Traders !
#GBPUSD made a rebound
From the support and went
Up but will now retest a
Local horizontal level
Of 1.36793 from where
We will be expecting
A local bearish reaction !
Comment and subscribe to help us grow !

Market Trap Alert! GBP/USD Bearish Robbery Plan🔥💸 "The Cable Heist" – GBP/USD Robbery Plan Using Thief Trading Style 💸🔥
— Unfiltered Forex Forecast with Risky Intentions —
🌍 Hey Money-Makers, Market Hustlers & Chart Bandits! 🤑✈️
Hola! Bonjour! Marhaba! Hallo! Ciao! Welcome to the Forex streets where the smart rob the charts, not banks.
Ready for the GBP/USD Heist? Let’s break it down with our infamous Thief Trading Style – raw, unapologetic, and built for profits.
💼 Operation Name: “The Cable Forex Bank Robbery”
🎯 Pair: GBP/USD – aka “The Cable”
⚔️ Style: Scalp / Day Trade / Swing Heist
📊 Bias: Short (Bearish Setup)
🛠 STRATEGY SETUP: "Follow the Shadows"
🔍 Analysis Basis:
Smart-Money Traps at Key Levels
Oversold ≠ Reversal (Read between the candles)
Liquidity Hunting Zones
Retail Stop Clusters Exposed
Thief-style DCA Entries (Staggered Entry Levels)
Multi-timeframe Confirmation
COT, Sentiment & News-Driven Volatility
🎯 ENTRY ZONE:
Enter short (sell) using 15M or 30M chart.
Sell Limits near recent highs (pullback zone).
DCA (Layered Entry) recommended – Thief loves catching price slipping.
Let the liquidity work for us.
🛑 STOP LOSS (SL):
Base SL around 1.36200 on 2H Chart – above swing high.
Adjust SL per position size and total entries.
Manage risk, but remember: thieves don’t panic, they plan!
🎯 TARGET ZONE:
TP near 1.33800 or adjust using price action.
Escape before target if market mood flips – no need to be greedy.
Trail SLs if market momentum dies down.
👀 Scalpers' Special Note:
Only SHORT — don’t mess with long side unless you’re a liquidity donor.
Quick ins & outs. If you're loaded with capital, jump in big – else follow the swing team.
Use trailing SLs for safety — protect the loot.
📢 FUNDAMENTALS TO WATCH:
News Impacting GBP/USD
COT Reports
Sentiment Indicators
Macro Trends / Yield Spreads
US Dollar Strength Index (DXY)
UK Economic Reports (CPI, GDP, Rate Decisions)
⚠️ RISK MANAGEMENT TIPS:
🚨 Avoid new entries during news releases
🚨 Use trailing stops during volatility spikes
🚨 Secure running trades before major announcements
🚀 Boost the Robbery – Support the Strategy
💖 Smash that BOOST BUTTON if you're vibing with this setup. Help the Thief crew grow stronger!
Let’s keep milking the market 💸 – one “heist” at a time. Stay dangerous, stay smart.
🔓 NOTE: This isn't investment advice. Just a wild trading idea from a chart outlaw.
Always DYOR – Do Your Own Robbery (Research).
Market conditions shift fast. Stay alert, adapt, and respect your capital.
#ForexThiefStyle #CableHeist #GBPUSDShort #SmartMoneyMoves #LiquidityHunters #ChartOutlaws #TradingRebels #DayTradeLife #ScalpersParadise #ForexGang #FXHeistPlans


UK GBP contracts, pound dipsThe British pound continues to have a quiet week. In the European session, GBP/USD is trading at 1.3530, down 0.30% on the day.
The UK wrapped up the week on a down note, as GDP contracted in May by 0.1% m/m. This followed a 0.3% decline in April and missed the consensus of 0.1%. The decline was driven by a 1% decline in manufacturing and a 0.6% contraction in construction, which cancelled out a 0.1% expansion in services.
The GDP contractions in April and May point to a weak second quarter of growth, after an impressive 0.7% gain in the first quarter. The economic landscape remains uncertain and the Bank of England has projected weak growth of 1% for 2025. Governor Bailey has said that the rate path will be "gradually downwards" but hasn't hinted as to the timing of the next cut.
The weak GDP data supports the case for an August rate cut, even though headline inflation is running at 3.4% and core inflation at 3.5%, well above the BoE's target of 2%. The money markets have priced in a quarter-point cut in August at 80%, which would lower the cash rate to 4.0%.
The BoE released its financial stability report earlier in the week, noting that the outlook for UK growth over the coming year is "a little weaker and more uncertain". The Bank highlighted President Trump's tariffs and the conflict in the Middle East. The UK has recently signed a trade deal with the US but some tariffs on UK products remain in effect.
GBP/USD is testing support at 1.3534. Below, there is support at 1.3491
The next resistance lines are 1.3577 and 1.3620

DeGRAM | GBPUSD forming the falling wedge📊 Technical Analysis
● Price is testing the rising-channel floor (≈1.3500) while carving a bullish falling-wedge; momentum divergence and prior green arrows hint buyers defend this rail.
● A break of 1.3590 (wedge roof / minor trendline) would confirm reversal, opening 1.3680 mid-band, with 1.3770 channel cap next. Risk is limited to a clean H4 close beneath 1.3450.
💡 Fundamental Analysis
● Softer US CPI trimmed two-year Treasury yields, eroding the dollar bid, while UK May GDP surprised to the upside and labour-market tightness keeps BoE “higher for longer” talk alive—narrowing the rate-gap that had weighed on sterling.
✨ Summary
Long 1.3500-1.3560; breakout above 1.3590 targets 1.3680 → 1.3770. Invalidate on H4 close under 1.3450.
-------------------
Share your opinion in the comments and support the idea with a like. Thanks for your support!

U.K. GDP Report: What It Means for GBPUSD CMCMARKETS:GBPUSD
Today, the U.K. Office for National Statistics (ONS) 📊 will release its monthly Gross Domestic Product (GDP) report 🗓️ at 6:00 a.m. UTC ⏰, likely impacting the British Pound (GBP) and GBP pairs globally 🌍.
🧐 What is GDP, and why does it matter?
GDP (Gross Domestic Product) 💡 measures the total value of all goods and services produced within a country’s economy over a specific period. It is a key indicator of economic health 🏥, influencing central bank decisions, investor sentiment, and currency valuations.
A higher-than-expected GDP 🆙 suggests a strong economy, which can support the currency 💪, while a lower-than-expected GDP 🆘 indicates weakness, often pressuring the currency lower 🔻.
📈 Market Expectations:
The market forecasts UK GDP growth to rise by 0.1% for May 🗓️, but we anticipate the increase may be smaller than expected 📉, implying a potential bearish surprise for GBPUSD.
⚡️ Trade Setup:
🔻 SELL Stop: 1.35330
❌ Stop Loss: 1.35714
✅ Take Profit: 1.34946
Risk-reward ratio: 1:1 ⚖️
🚨 Why Sell Here?
🔸 A weaker-than-expected GDP could lead to a pullback in GBPUSD below 1.3500 🚦.
🔸 Technical levels align with potential downside opportunities.
🔸 Volatility expected during and after the data release — manage risk carefully! ⚠️
📌 Stay tuned for live updates and analysis following the data release!
💬 Support this post if it helps your trading decisions! 🔔
