Fundamental Market Analysis for July 2, 2025 GBPUSDOn Wednesday, during the Asian trading session, the GBP/USD pair is trading unchanged at around 1.37450. However, dovish statements by US Federal Reserve Chairman Jerome Powell and growing concerns about the budget may put pressure on the dollar in the near term. Investors are awaiting the ADP report on US employment for June, which will be released later on Wednesday, in the hope of new momentum.
Powell said on Tuesday that the US central bank would be patient about further interest rate cuts, but did not rule out a rate cut at its July meeting, although the decision would depend on incoming data. According to the CME FedWatch tool, short-term interest rate futures now price in the probability of a rate cut in July at almost 1 in 4, up from less than 1 in 5 previously.
Investors are concerned about US President Donald Trump's massive tax and spending bill, which could increase the national debt by $3.3 trillion. The bill will return to the House of Representatives for final approval. Fiscal concerns could dampen optimism and contribute to a decline in the US dollar.
As for the pound sterling, Bank of England (BoE) Governor Andrew Bailey said last week that there are currently signs of a weakening UK labor market and stressed that interest rates are likely to continue to fall. The UK central bank is expected to cut interest rates three times by the end of 2025, bringing them to 3.5% to combat sluggish economic growth and a weakening labor market. Rate cuts are expected in August, September, and November 2025, with possible quarterly reductions.
Trading recommendation: SELL 1.37450, SL 1.37900, TP 1.36750
GBPUSD

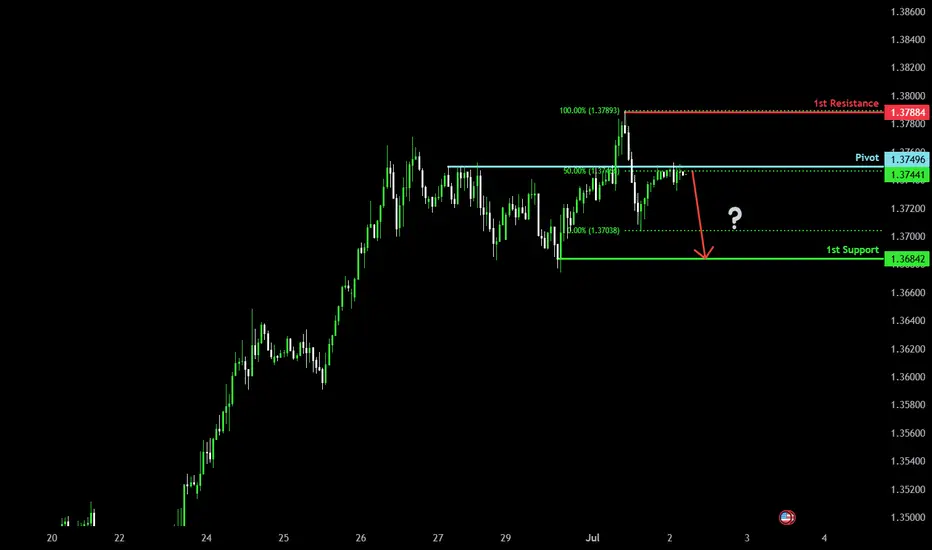
Bearish drop?The Cable (GBP/USD) is reacting off the pivot and could drop to the 1st support.
Pivot: 1.3749
1st Support: 1.3684
1st Resistance: 1.3788
Risk Warning:
Trading Forex and CFDs carries a high level of risk to your capital and you should only trade with money you can afford to lose. Trading Forex and CFDs may not be suitable for all investors, so please ensure that you fully understand the risks involved and seek independent advice if necessary.
Disclaimer:
The above opinions given constitute general market commentary, and do not constitute the opinion or advice of IC Markets or any form of personal or investment advice.
Any opinions, news, research, analyses, prices, other information, or links to third-party sites contained on this website are provided on an "as-is" basis, are intended only to be informative, is not an advice nor a recommendation, nor research, or a record of our trading prices, or an offer of, or solicitation for a transaction in any financial instrument and thus should not be treated as such. The information provided does not involve any specific investment objectives, financial situation and needs of any specific person who may receive it. Please be aware, that past performance is not a reliable indicator of future performance and/or results. Past Performance or Forward-looking scenarios based upon the reasonable beliefs of the third-party provider are not a guarantee of future performance. Actual results may differ materially from those anticipated in forward-looking or past performance statements. IC Markets makes no representation or warranty and assumes no liability as to the accuracy or completeness of the information provided, nor any loss arising from any investment based on a recommendation, forecast or any information supplied by any third-party.
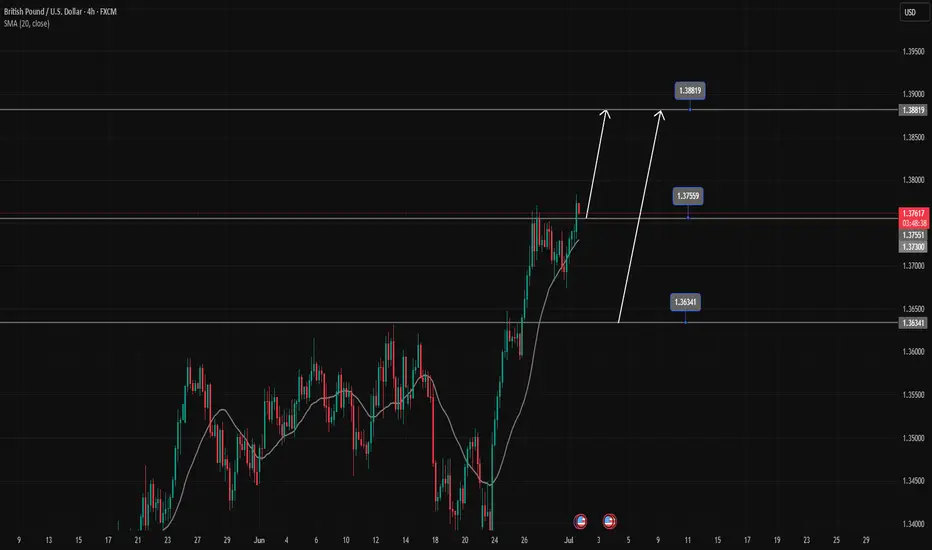
GBPUSD's strong uptrend continuesGBPUSD is in a strong uptrend, Price has just broken the resistance zone of 1.37500.
All the bullish momentum is heading towards the resistance zone of 1.388.
If there is a close of the h4 candle below the resistance zone of 1.375, there will likely be a Pullback to 1.363 to find more buying momentum towards the target at the resistance zone of 1.388
📈 Key Levels
Support: 1.375-1.363
Resistance: 1.388
📊 Recommended Trade Setups
BUY GBPUSD 1.375-1.373 Stoploss 1.37000
BUY GBPUSD 1.363-1.361 Stoploss 1.35800
SELL GBPUSD 1.388-1.390 Stoploss 1.39300
SUI/USDT Short Setup (2025-07-25)SUI/USDT Short setup for day traders.
Please enter with confirmation in 5M time frame.
⚠️ This Analysis will be updated ...
👤 Sadegh Ahmadi: GPTradersHub
📅 2025.Jul.2
⚠️(DYOR)
❤️ If you apperciate my work , Please like and comment , It Keeps me motivated to do better

Sintra Signals: Central Banks Stay Cautious The ECB Forum in Sintra brought together the heads of the world’s most influential central banks—Lagarde (ECB), Powell (Fed), Bailey (BOE), Ueda (BOJ), and Rhee (BOK).
Across the board, central banks are remaining cautious and data-driven, with no firm commitments on timing for rate changes.
Fed Chair Powell said the U.S. economy is strong, with inflation manageable despite expected summer upticks. He noted tariffs have delayed potential rate cuts and confirmed the Fed is proceeding meeting by meeting.
BOE’s Bailey highlighted signs of softening in the UK economy and said policy remains restrictive but will ease over time. He sees the path of rates continuing downward.
BOJ’s Ueda noted headline inflation is above 2%. Any hikes will depend on underlying core inflation which remains below target.

#GBPUSD: Detailed View Of Next Possible Price Move! GBPUSD exhibited a favourable movement after rejecting a pivotal level previously identified. We anticipate a smooth upward trajectory, potentially reaching approximately 1.45. Conversely, the US Dollar is on the brink of collapse around 90, which will directly propel the price into our take-profit range.
During GBPUSD trading, it is imperative to adhere to precise risk management principles. Significant news is scheduled to be released later this week.
We kindly request your support by liking, commenting, and sharing this idea.
Team Setupsfx_

GBPUSD Long, 1 JulyPrice is reacting from a Daily bearish OB, but this setup aims to catch the pullback — making a long valid here despite HTF structure.
LTF gave a clean 15m BOS, followed by reaction from the extreme 15m OB.
Entry was taken after a confirmed 1m BOS + OB retrace, in alignment with structure and location.
🎯 Target: 30 pips (1:3 RR)
⚠️ No clear Asia target, but structure favors this move
📍Entry: 1m OB after BOS
📉 Risk: 0.5%
High-probability pullback play, executed with confirmation and clean structure.

Gold Bounces from Demand Zone – Next Targets in Sight!By analyzing the gold chart on the 4-hour timeframe, we can see that today, price once again dipped into our key demand zone (Bullish Rejection Block) between $3245 and $3262, where it faced strong buying pressure and rallied up to $3296.
Currently, gold is trading around $3281, and as long as price holds above $3273, we expect further upside. The next potential targets are $3294, $3300, and $3309.
🎥 If you enjoyed this video analysis and found it helpful, please show your support with a LIKE and COMMENT below!
These video-style breakdowns take time and effort, and I’ll only continue them with your support 🙌
Your engagement is my biggest motivation to keep going 💛
Thanks for being part of the journey!

GBPUSD – Short-Term Entry Model (Price Action Based)Education time!
This is a quick-execution on GBPUSD this London session based on a failed breakout and structure shift.
Price initially broke above the previous high but failed to sustain the breakout. The second push failed to print a higher high (HH), signaling potential exhaustion. Once the higher low (HL) that led to the failed HH was broken to the downside, a valid short setup was confirmed.
The trade targets the 161.8% Fibonacci extension of the initial move that failed to hold above the high.
📉 Result: The setup played out cleanly, hitting the target with a +17 pip gain.

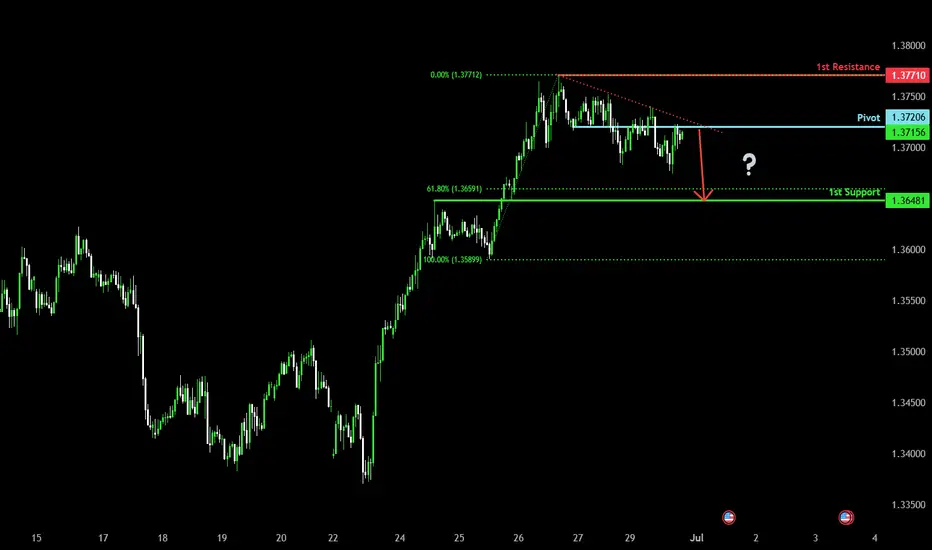
Bearish drop?The Cable (GBP/USD) is reacting off the pivot and could drop to the 1st support.
Pivot: 1.3720
1st Support: 1.3648
1st Resistance: 1.3771
Risk Warning:
Trading Forex and CFDs carries a high level of risk to your capital and you should only trade with money you can afford to lose. Trading Forex and CFDs may not be suitable for all investors, so please ensure that you fully understand the risks involved and seek independent advice if necessary.
Disclaimer:
The above opinions given constitute general market commentary, and do not constitute the opinion or advice of IC Markets or any form of personal or investment advice.
Any opinions, news, research, analyses, prices, other information, or links to third-party sites contained on this website are provided on an "as-is" basis, are intended only to be informative, is not an advice nor a recommendation, nor research, or a record of our trading prices, or an offer of, or solicitation for a transaction in any financial instrument and thus should not be treated as such. The information provided does not involve any specific investment objectives, financial situation and needs of any specific person who may receive it. Please be aware, that past performance is not a reliable indicator of future performance and/or results. Past Performance or Forward-looking scenarios based upon the reasonable beliefs of the third-party provider are not a guarantee of future performance. Actual results may differ materially from those anticipated in forward-looking or past performance statements. IC Markets makes no representation or warranty and assumes no liability as to the accuracy or completeness of the information provided, nor any loss arising from any investment based on a recommendation, forecast or any information supplied by any third-party.
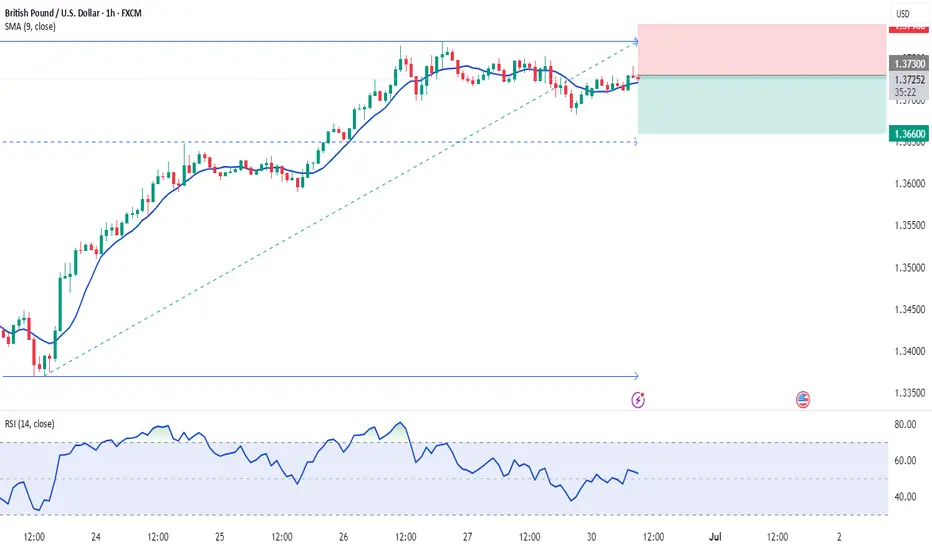
30.06.2025 #GBPUSDSELL 1.37300 | STOP 1.37900 | TAKE 1.36600 | Downward local corrective price movement.
Falling towards pullback support?GBP?USD is falling towards the support level which is a pullback support that lines up with the 38.2% Fibonacci retracement and could drop from this level to our take profit.
Entry: 1.3609
Why we like it:
There is a pullback support level that lines up with the 38.2% Fibonacci retracement.
Stop loss: 1.3534
Why we like it:
There is a pullback support.
Take profit: 1.3746
Why we like it:
There is a pullback resistance.
Enjoying your TradingView experience? Review us!
Please be advised that the information presented on TradingView is provided to Vantage (‘Vantage Global Limited’, ‘we’) by a third-party provider (‘Everest Fortune Group’). Please be reminded that you are solely responsible for the trading decisions on your account. There is a very high degree of risk involved in trading. Any information and/or content is intended entirely for research, educational and informational purposes only and does not constitute investment or consultation advice or investment strategy. The information is not tailored to the investment needs of any specific person and therefore does not involve a consideration of any of the investment objectives, financial situation or needs of any viewer that may receive it. Kindly also note that past performance is not a reliable indicator of future results. Actual results may differ materially from those anticipated in forward-looking or past performance statements. We assume no liability as to the accuracy or completeness of any of the information and/or content provided herein and the Company cannot be held responsible for any omission, mistake nor for any loss or damage including without limitation to any loss of profit which may arise from reliance on any information supplied by Everest Fortune Group.

DXY Game Plan - USD IndexIt is important to watch the DXY to understand the strength of the USD across global markets.
The DXY is a key index that reflects the U.S. dollar’s dominance in foreign exchange. Therefore, tracking it can provide valuable insights into the potential direction of all major asset classes.
In this post, I’ll break down both technical and fundamental expectations.
Technical Analysis
DXY has been in a retracement phase (bearish) since January 2025. During this time, we’ve seen EUR and other major forex pairs form strong bullish trends.
Currently, the DXY is approaching a weekly bullish trendline, where I expect a potential bounce.
Additionally, DXY is trading within a discount zone (below the 0.5 Fibonacci level, also known as equilibrium). Personally, I’m watching for a deeper move into the maximum discount zone (around the 0.75 Fib level).
This area also aligns with key liquidity concepts. Ideally, I want to see a deviation below the bullish trendline, with a sweep of one of the weekly liquidity levels marked on the chart (two black horizontal lines).
I'm not relying on a clean triangle trendline retest, but it's a possibility.
Game Plan
DXY taps the bullish trendline
Deviates below it, running weekly liquidity (black lines)
Hits the max discount zone (~0.75 Fib)
Then shows signs of reversal and strength
Once that setup completes, I’ll be expecting strong USD performance, and will look to short risk assets — including stocks and major forex pairs.
Fundamental Analysis
The Federal Reserve is currently resisting pressure to cut interest rates, while Trump is vocally pushing for rate cuts.
The market is already pricing in a 79% probability of a September rate cut (source: CME FedWatch Tool), so if that happens as expected, I don’t anticipate major market reaction.
However, a surprise rate cut in July would likely trigger a flash crash in DXY/USD — though based on my game plan, I would expect a V-shaped recovery shortly afterward.
EUR, GBP, AUD, and CAD have also hit key resistance zones, so I believe we're likely to see USD strength for a while.

EUR/USD BUY IDEA - SMT WITH GBPHere's my analysis , let me share my A+ set up with you :
1 - WAIT ON ASIA LOW SWEEP WITH EUR / USD
2 - WE WILL POTENTIALLY HAVE A SMT WITH GBP USD IF WE SWEEP ASIA LOW
3 - WAIT ON BOS + FVG IN 5 MIN TIME FRAME
4 - TARGET PREVIOUS WEEK HIGH AS DRAW ON LIQUIDITY
This is what I see happening . After full take profit, we will have our new Weekly Protected High I believe and from there we can start targeting Sellside Liquidity .
I hope you enjoyed the analysis , I will post updates during the day .
Talk to you guys soon ! =D

GBPUSD: Targeting 1.4200 Swing Move Target! Swing Trading GBPUSD: We’ve identified a key reversal zone where our long-term take-profit target is set at 1.4200. This is a long-term approach, but in the short term, we could target 1.3900, which is a reasonable take-profit area. Before taking any buying entry, please do your own analysis.
Good luck and trade safely!
Like
Comment
Share
Team Setupsfx_

GBPUSD AnalaysisGBPUSD Analaysis on 4H frame According to my own analysis strategy
Selling Zones :
1.35150 - 1.35300
1.35530 - 1.35720
buying zones
1.33427 - 1.33080
GBPUSD sideways consolidation support at 1.3550The GBPUSD currency pair continues to exhibit a bullish price action bias, supported by a sustained rising trend. Recent intraday movement reflects a sideways consolidation breakout, suggesting potential continuation of the broader uptrend.
Key Technical Level: 1.3600
This level marks the prior consolidation range and now acts as pivotal support. A corrective pullback toward 1.3600 followed by a bullish rejection would reinforce the bullish trend, targeting the next resistance levels at:
1.3825 – Near-term resistance
1.3865 – Minor swing high
1.3900 – Longer-term bullish objective
On the other hand, a decisive daily close below 1.3600 would invalidate the bullish setup, shifting the outlook to bearish in the short term. This could trigger a deeper retracement toward:
1.3550 – Initial support
1.3500 – Key downside target
Conclusion:
As long as 1.3600 holds as support, the technical outlook remains bullish, favoring long positions on dips. A confirmed break below this level would signal a shift in sentiment and open the door to a corrective pullback phase.
This communication is for informational purposes only and should not be viewed as any form of recommendation as to a particular course of action or as investment advice. It is not intended as an offer or solicitation for the purchase or sale of any financial instrument or as an official confirmation of any transaction. Opinions, estimates and assumptions expressed herein are made as of the date of this communication and are subject to change without notice. This communication has been prepared based upon information, including market prices, data and other information, believed to be reliable; however, Trade Nation does not warrant its completeness or accuracy. All market prices and market data contained in or attached to this communication are indicative and subject to change without notice.

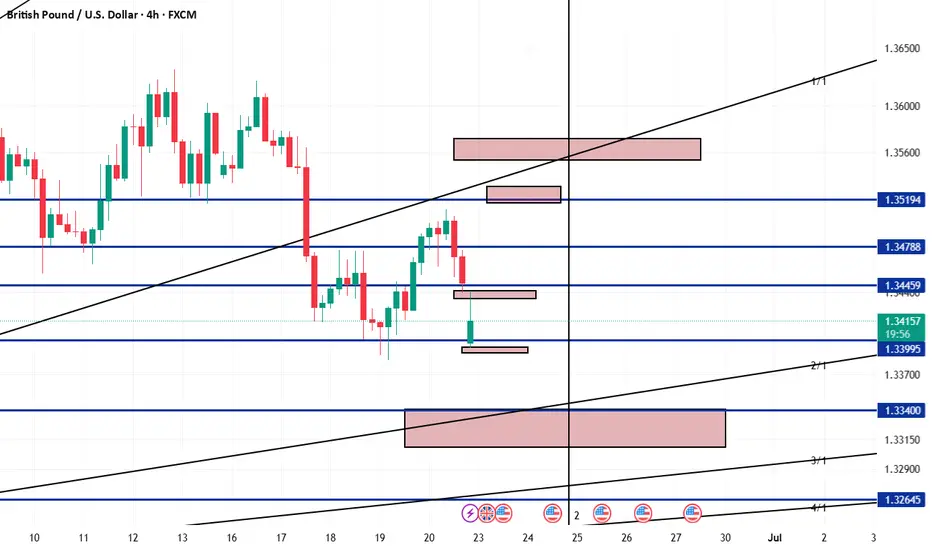
Bullish continuation?The Cable (GBP/USD) is falling towards the pivot, which acts as a pullback support and could bounce to the 1st resistance.
Pivot: 1.3617
1st Support: 1.3442
1st Resistance: 1.3795
Risk Warning:
Trading Forex and CFDs carries a high level of risk to your capital and you should only trade with money you can afford to lose. Trading Forex and CFDs may not be suitable for all investors, so please ensure that you fully understand the risks involved and seek independent advice if necessary.
Disclaimer:
The above opinions given constitute general market commentary, and do not constitute the opinion or advice of IC Markets or any form of personal or investment advice.
Any opinions, news, research, analyses, prices, other information, or links to third-party sites contained on this website are provided on an "as-is" basis, are intended only to be informative, is not an advice nor a recommendation, nor research, or a record of our trading prices, or an offer of, or solicitation for a transaction in any financial instrument and thus should not be treated as such. The information provided does not involve any specific investment objectives, financial situation and needs of any specific person who may receive it. Please be aware, that past performance is not a reliable indicator of future performance and/or results. Past Performance or Forward-looking scenarios based upon the reasonable beliefs of the third-party provider are not a guarantee of future performance. Actual results may differ materially from those anticipated in forward-looking or past performance statements. IC Markets makes no representation or warranty and assumes no liability as to the accuracy or completeness of the information provided, nor any loss arising from any investment based on a recommendation, forecast or any information supplied by any third-party.

GBPUSD H4 I A short-term Bearish DropBased on the H4 chart analysis, we can see that the price is currently at our sell entry at 1.3723 which is an overlap resistance.
Our take profit will be at 1.3631 a pullback support that aligns closely with the 38.2% Fib retracement.
The stop loss will be placed at 1.3787, above a swing high resistance level.
High Risk Investment Warning
Trading Forex/CFDs on margin carries a high level of risk and may not be suitable for all investors. Leverage can work against you.
Stratos Markets Limited (tradu.com ):
CFDs are complex instruments and come with a high risk of losing money rapidly due to leverage. 63% of retail investor accounts lose money when trading CFDs with this provider. You should consider whether you understand how CFDs work and whether you can afford to take the high risk of losing your money.
Stratos Europe Ltd (tradu.com ):
CFDs are complex instruments and come with a high risk of losing money rapidly due to leverage. 63% of retail investor accounts lose money when trading CFDs with this provider. You should consider whether you understand how CFDs work and whether you can afford to take the high risk of losing your money.
Stratos Global LLC (tradu.com ):
Losses can exceed deposits.
Please be advised that the information presented on TradingView is provided to Tradu (‘Company’, ‘we’) by a third-party provider (‘TFA Global Pte Ltd’). Please be reminded that you are solely responsible for the trading decisions on your account. There is a very high degree of risk involved in trading. Any information and/or content is intended entirely for research, educational and informational purposes only and does not constitute investment or consultation advice or investment strategy. The information is not tailored to the investment needs of any specific person and therefore does not involve a consideration of any of the investment objectives, financial situation or needs of any viewer that may receive it. Kindly also note that past performance is not a reliable indicator of future results. Actual results may differ materially from those anticipated in forward-looking or past performance statements. We assume no liability as to the accuracy or completeness of any of the information and/or content provided herein and the Company cannot be held responsible for any omission, mistake nor for any loss or damage including without limitation to any loss of profit which may arise from reliance on any information supplied by TFA Global Pte Ltd.
The speaker(s) is neither an employee, agent nor representative of Tradu and is therefore acting independently. The opinions given are their own, constitute general market commentary, and do not constitute the opinion or advice of Tradu or any form of personal or investment advice. Tradu neither endorses nor guarantees offerings of third-party speakers, nor is Tradu responsible for the content, veracity or opinions of third-party speakers, presenters or participants.

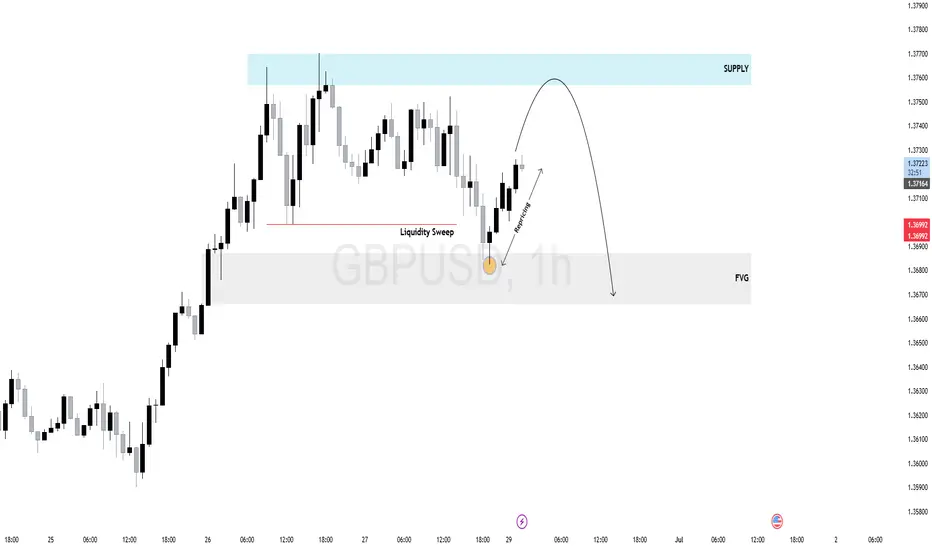
$GU (GBPUSD) 1H AnalysisPrice swept internal liquidity before dropping into a clear 1H Fair Value Gap (FVG), which acted as a draw on liquidity. Following the mitigation, GBPUSD is now retracing toward a high-probability supply zone.
Expect potential rejection as price rebalances inefficiency and seeks sell-side liquidity.
Watch for bearish confirmation inside the supply zone — ideal for intraday shorts if the structure shifts.
Pullbacks = short opportunities.
Exclusive: GBP/USD Swing Heist – Limited-Time Opportunity!🏴☠️ GBP/USD HEIST ALERT: Bullish Loot Grab Before the Cops Arrive! 🚨💰
🌟 Attention, Market Pirates & Profit Raiders! 🌟
"The vault is unlocked—time to swipe those pips!"
🔥 THIEF TRADING STRATEGY (Swing/Day) 🔥
Based on high-risk, high-reward technical & fundamental analysis, here’s the master plan to plunder GBP/USD ("The Cable")!
📈 ENTRY (Bullish Heist Zone)
"The vault is OPEN!" – Long at any price, but for precision:
Buy Limit orders preferred (15m-30m timeframe).
Pullback entries from recent swing lows/highs = sneakiest loot grab!
🛑 STOP LOSS (Escape Route)
Thief SL: Nearest swing low (4H chart).
Adjust based on: Risk tolerance, lot size, & number of orders.
"A good thief always has an exit plan!"
🎯 TARGETS
1.37500 (or escape early if the cops 🚓 (bearish traps) show up!).
Scalpers: Only long-side raids! Use trailing SL to lock profits.
💥 WHY THIS HEIST? (Bullish Momentum)
Technicals + Fundamentals align for a potential breakout.
Overbought? Risky? Yes—but the best loot is guarded!
📢 TRADING ALERT (News & Risk Mgmt)
Avoid new trades during high-impact news (volatility = police sirens!).
Trailing stops = Your getaway car. Protect profits!
🚀 BOOST THE HEIST!
💖 Hit "Like" & "Boost" to fuel our next raid!
💬 Comment your loot tally below!
"Stay sharp, thieves—see you at the next heist! 🤑🔥"

GBPUSD: The Big Short Opportunity?(Breakout Confirmation Needed)🚨 GBP/USD BANK HEIST ALERT: The Bearish Robbery Plan (Swing/Day Trade) 🚨
🔥 Steal Pips Like a Pro – Thief Trading Strategy Inside! 🔥
🌟 GREETINGS, MARKET PIRATES! 🌟
🤑 To all the Money Makers, Risk Takers & Midnight Breakers!
Based on our 🔥Thief Trading Style🔥 (a deadly mix of technical + fundamental + intermarket analysis), we’re plotting a massive bearish heist on GBP/USD ("The Cable").
This is not financial advice—just a strategic robbery plan for those who dare to trade smart.
📉 THE HEIST STRATEGY (SHORT ENTRY FOCUS)
🎯 Target Zone: 1.32300 (or escape earlier if the market turns)
⚡ High-Risk, High-Reward Play: Oversold market, consolidation, trend reversal setup.
💣 Trap Level: Where bullish traders get wrecked.
🔑 ENTRY RULES:
"The Heist is ON!" – Wait for breakout confirmation at 1.33800 before striking.
Sell Stop Orders below breakout MA OR Sell Limit Orders (15-30 min timeframe).
Retest Entry? Ideal if price retraces to recent low/high before dropping.
📌 ALERT SETUP: Don’t miss the breakout—set a chart alert!
🛑 STOP LOSS (Risk Management):
Thief SL at 1.34800 (Swing/Day Trade basis – 3H period).
🚨 Pro Tip: "Yo, rebels! You can place SL wherever you want… but if you ignore this level, don’t cry later. Your risk, your rules."
🎯 PROFIT TARGET:
First Take-Profit: 1.32300 (or bail earlier if momentum fades).
Scalpers: Ride the short side only. Use trailing SL to lock profits.
📰 FUNDAMENTAL BACKUP (Why This Heist Works)
Before executing, check:
✅ COT Report (Are big players dumping GBP?)
✅ Macro News (UK vs. USD economic strength)
✅ Intermarket Analysis (DXY, Bonds, Equities correlation)
✅ Sentiment & Seasonality (Is the crowd too bullish?)
⚠️ WARNING: NEWS & VOLATILITY ALERTS
Avoid new trades during high-impact news (unless you love gambling).
Use trailing stops to protect profits if the market flips.
💥 BOOST THIS HEIST! 💥
🚀 Like & Share to strengthen our Thief Trading Squad!
💸 More heists = More profits. Stay tuned for the next robbery plan!
🤑 See you on the profitable side, bandits! 🏴☠️
🔴 DISCLAIMER: This is entertainment, not financial advice. Trade at your own risk.
#Forex #GBPUSD #TradingStrategy #ThiefTrading #BankHeist #SwingTrading #DayTrading
💬 COMMENT BELOW: Are you joining the heist or waiting for a better setup? 🚨👇

GBP/USD HEIST ALERT: Bullish Breakout or Bearish Trap?🌟 Hey! Hola! Ola! Bonjour! Hallo! Marhaba! 🌟
Calling all Market Robbers & Profit Pirates!💸💰
🔥 Thief Trading Intel: Our crew’s latest heist targets GBP/USD "The Cable"—bullish breakout incoming! Long entry only. High-risk Red Zone ahead: overbought, consolidating, and ripe for a reversal. Don’t get caught in the bear trap! 🏴☠️
"Take your loot and run, trader—you’ve earned this steal!" 💪🎯
🚪 ENTRY: The Heist Begins!
📈 "Wait for MA breakout (1.36000) then STRIKE—bullish profits await!"
Option 1: Buy Stop above Pink Resistance (breakout confirmation).
Option 2: Buy Limit at swing low/high (15-30 min TF).
📌 Pro Tip: SET AN ALERT! Don’t miss the breakout.
🛑 STOP LOSS: Escape Route
🔊 "Yo, listen up! 🗣️
Buy Stop orders? NO SL until after breakout! 🚀
Rebels: Place SL wherever—but you’ve been warned! ⚠️🔥
📍 Thief SL (Smart Crew): Recent/swing low (1.35000, 4H TF).
📍 Adjust based on your risk, lot size, and orders.
🎯 TARGET: Loot & Exit!
🎯 1.37500 (or escape early if the market turns!)
⚡ SCALPERS’ QUICK GRAB
👀 Long scalps ONLY!
Big wallets? Raid now.
Small stacks? Join swing traders.
Trailing SL = Your Money Shield! 🛡️💰
📢 WHY THIS HEIST? (GBP/USD Bullish Momentum)
"The Cable" is heating up! Key drivers:
Fundamentals (COT, Macro Data)
Sentiment & Intermarket Trends
Future Targets & Score Outlook
🔗 Full intel? Bio links below! 👉👉
⚠️ TRADING ALERT: News = Danger Zone! 📰🚨
News = Volatility Spikes! Protect your loot:
❌ Avoid new trades during news.
🔒 Trailing SL = Profit Lock.
💖 SUPPORT THE HEIST CREW!
💥 SMASH THAT BOOST BUTTON! 💥
More boosts = easier money grabs!
Stronger crew = bigger heists!
Profit daily with Thief Trading Style! 🏆🚀
Next heist coming soon—stay tuned! 🤑🐱👤🤩
