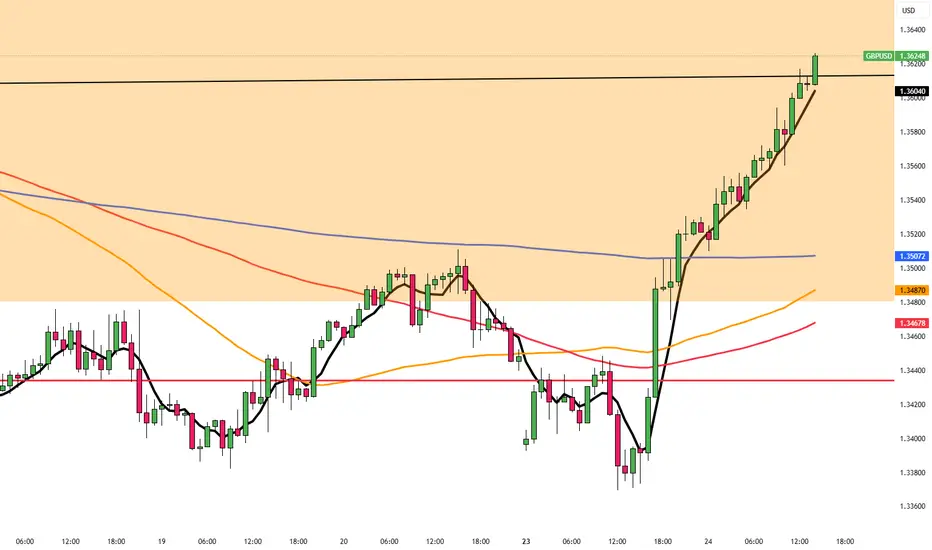
GBPUSD – Bullish Structure Holds, Waiting for a Clean RetestGBPUSD recently bounced strongly from the ascending trendline and hit resistance at 1.36300. The price is now slightly correcting, with a high probability of retesting the 1.35000 support zone – an area of FVG and technical confluence.
The bullish structure remains intact as long as price holds above this level. Positive UK Services PMI data further supports the medium-term uptrend.
Are you waiting for the pullback to jump in?
GBPUSD

GBPUSD is in the Selling DirectionHello Traders
In This Chart GBPUSD HOURLY Forex Forecast By FOREX PLANET
today GBPUSD analysis 👆
🟢This Chart includes_ (GBPUSD market update)
🟢What is The Next Opportunity on GBPUSD Market
🟢how to Enter to the Valid Entry With Assurance Profit
This CHART is For Trader's that Want to Improve Their Technical Analysis Skills and Their Trading By Understanding How To Analyze The Market Using Multiple Timeframes and Understanding The Bigger Picture on the Charts

Risk Sentiment Improves, GBP/USD Nears 1.3650GBP/USD extended its rally for a third session, trading around 1.3620 and holding close to Tuesday’s high of 1.3648, its strongest level since February 2022. The pair continues to benefit from improved risk appetite as Middle East tensions ease following Trump’s announcement of a ceasefire between Iran and Israel.
Despite the initial increase, investors remain cautious as doubts persist over the ceasefire’s durability and potential nuclear negotiations with Iran. Focus is also on Iran’s enriched uranium stockpile, which continues to raise geopolitical concerns.
Meanwhile, Powell, in his congressional testimony, signaled that rate cuts are unlikely before Q4. He acknowledged that new tariffs could push inflation higher from June but maintained that the Fed is prepared to ease policy once conditions allow.
Resistance is seen at 1.3655, while support holds at 1.3540.

GBPUSD Price Action Analysis | Sell Setup Below 1.36106In this GBPUSD market overview, we break down recent price action following yesterday’s strong bullish rally from the momentum low. The session was highly emotional across major forex pairs, which is typical when a major wave structure reaches its end. This often results from incomplete auctions on one side of the market, causing order flow imbalances that drive sharp price movements.
The key price level we're watching on GBPUSD is 1.36326. Price approached this zone with momentum, and the rejection at 1.36267 triggered a classic TCP (Trend Changing Pattern), followed by a single upside break, confirming exhaustion at the highs.
📉 Sell Setup:
According to the Waves of Success execution model, the best short entry is below 1.36106, in alignment with the prevailing bearish structure.
⚠️ Alternative Scenario:
We are not looking for long setups on GBPUSD at this time — our bias remains bearish unless significant structure changes occur.
This analysis combines wave structure, trend confirmation patterns, and institutional price levels for a professional, risk-managed approach.
🔑 Key Levels:
Resistance: 1.36326
Rejection High: 1.36267
Sell Trigger: 1.36106

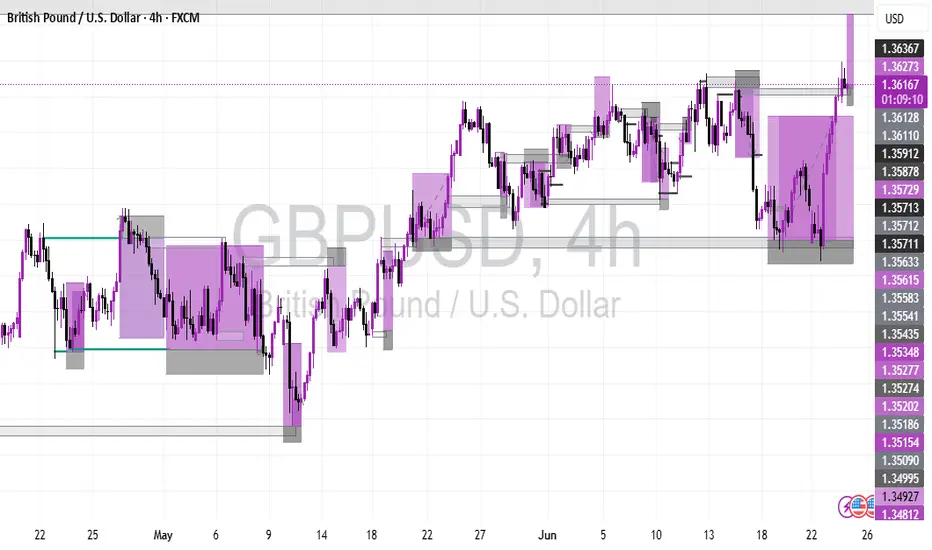
How I’m Planning My Next GBPUSD Trade Setup📉 GBPUSD Analysis Update
Currently keeping a close eye on GBPUSD 👀. On both the Daily and 4H charts, we’ve seen a strong bullish rally, driving price into a premium zone and tapping into key buy-side liquidity resting above previous highs 🔼💧.
The pair now appears overextended and is trading into a significant resistance level 🧱. Given this context, I’m anticipating a potential retracement. If we see a pullback followed by a clean bullish break in market structure, that’s when I’ll be looking to enter a long position 🎯📈.
⚠️ As always, this is not financial advice — just sharing my personal view of the markets.

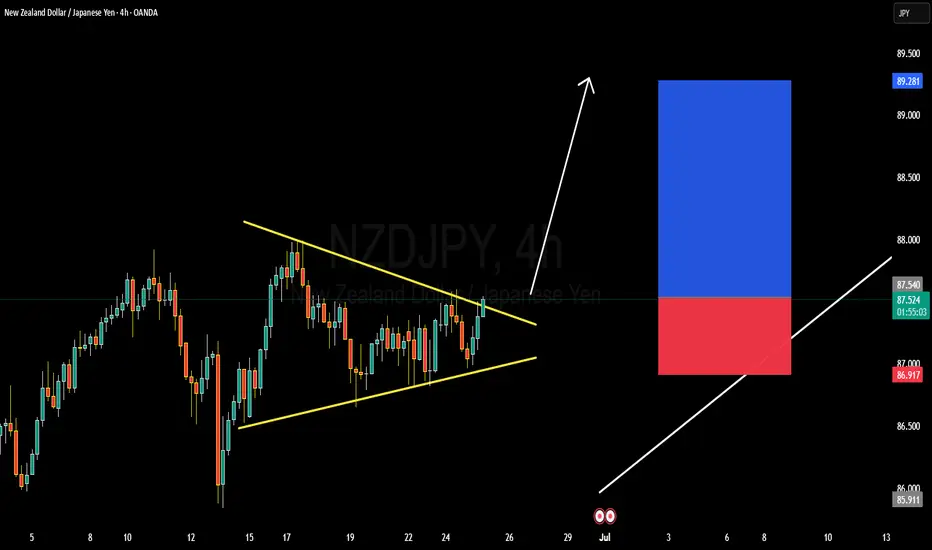
NZDJPY TECHNICAL AND FUNDAMENTALS DETAILED ANALYSISNZDJPY has just completed a bullish breakout from a well-defined symmetrical triangle on the 4H chart, confirming the start of a fresh impulsive move. Price action has broken cleanly above the descending trendline resistance around 87.400, supported by consecutive bullish candles with momentum. This breakout structure is signaling trend continuation, and I’m now targeting 89.500 as the next key resistance zone. The pair has also held higher lows consistently, showing strong bullish pressure in the medium term.
Fundamentally, the New Zealand Dollar remains supported by the Reserve Bank of New Zealand’s persistent hawkish stance. With the RBNZ maintaining higher interest rates to combat sticky domestic inflation, NZD has found strong backing in recent sessions. On the other hand, the Japanese Yen continues to weaken across the board, with the Bank of Japan maintaining ultra-loose monetary policy and no real signals of tightening. Japan’s latest inflation reading came in weaker than expected, further dimming any hawkish BOJ bets.
Today’s sentiment also reflects a global risk-on environment, with equities up and commodity-linked currencies like NZD benefiting. This reinforces bullish momentum in NZDJPY, especially as yield differentials between New Zealand and Japan favor carry trades. Technically, the pair could see brief pullbacks toward 87.100–86.900, which may offer fresh entries for bulls aiming to ride the breakout wave toward 89.500.
With technical confirmation, bullish momentum, and a supportive macro backdrop, NZDJPY looks well-positioned for further upside. I’ll be watching for sustained price action above the breakout zone, and any dips will be viewed as buying opportunities. The trend is up, and momentum is real—this is a textbook breakout setup aligned with both fundamentals and price action.
Bearish reversal off pullback resistance?The Cable (GBP/USD) is reacting off the pivot and could drop to the 1st support which is a pullback support.
Pivot: 1.3632
1st Support: 1.3533
1st Resistance: 1.2711
Risk Warning:
Trading Forex and CFDs carries a high level of risk to your capital and you should only trade with money you can afford to lose. Trading Forex and CFDs may not be suitable for all investors, so please ensure that you fully understand the risks involved and seek independent advice if necessary.
Disclaimer:
The above opinions given constitute general market commentary, and do not constitute the opinion or advice of IC Markets or any form of personal or investment advice.
Any opinions, news, research, analyses, prices, other information, or links to third-party sites contained on this website are provided on an "as-is" basis, are intended only to be informative, is not an advice nor a recommendation, nor research, or a record of our trading prices, or an offer of, or solicitation for a transaction in any financial instrument and thus should not be treated as such. The information provided does not involve any specific investment objectives, financial situation and needs of any specific person who may receive it. Please be aware, that past performance is not a reliable indicator of future performance and/or results. Past Performance or Forward-looking scenarios based upon the reasonable beliefs of the third-party provider are not a guarantee of future performance. Actual results may differ materially from those anticipated in forward-looking or past performance statements. IC Markets makes no representation or warranty and assumes no liability as to the accuracy or completeness of the information provided, nor any loss arising from any investment based on a recommendation, forecast or any information supplied by any third-party.

GBPAUD → Countertrend liquidity captureFX:GBPAUD is forming a countertrend correction within a global uptrend and testing the support level with W1-D1, forming a false breakdown...
Against the backdrop of the dollar's correction, GBP/XXX pairs are strengthening. On the weekly timeframe, GBPAUD is forming a retest of support at 1.067 (false breakdown) within an upward bullish trend.
Unable to continue falling, the price returns above 1.0673 and consolidates in the buying zone. A breakdown of the structure will confirm the bullish sentiment.
Support levels: 2.0673
Resistance levels: 2.0785, 2.0852
If the bulls manage to hold their ground above the 2.067 support level within the current structure, the currency pair will have a good chance of returning to the bullish trend.
Best regards, R. Linda!

Nothing more beautiful than thisgbpusd has shown an uptrend for the past few months, did you get the picture?
GBPUSD Breakout and Potential RetraceHey Traders, in today's trading session we are monitoring GBPUSD for a buying opportunity around 1.35900 zone, GBPUSD was trading in a downtrend and successfully managed to break it out. Currently is in a correction phase in which it is approaching the retrace area at 1.35900 support and resistance area.
Trade safe, Joe.

GBPUSD Technical Analysis! SELL!
My dear friends,
GBPUSD looks like it will make a good move, and here are the details:
The market is trading on 1.3622 pivot level.
Bias - Bearish
Technical Indicators: Supper Trend generates a clear short signal while Pivot Point HL is currently determining the overall Bearish trend of the market.
Goal - 1.3558
Recommended Stop Loss - 1.3653
About Used Indicators:
Pivot points are a great way to identify areas of support and resistance, but they work best when combined with other kinds of technical analysis
Disclosure: I am part of Trade Nation's Influencer program and receive a monthly fee for using their TradingView charts in my analysis.
———————————
WISH YOU ALL LUCK

Technical + Fundamental Alignment: GBPUSD Short in PlayGBPUSD ( FX:GBPUSD ) is moving near the Resistance zone($1.354-$1,350) and has managed to break the Support line .
In terms of Elliott Wave theory , it seems that GBPUSD has completed the Zigzag Correction(ABC/5-3-5) , we can expect the next five bearish waves .
--------------------------------------------------------
Fundamental Analysis
1-Weak UK Economic Data:
Recent reports including Retail Sales, Industrial Output, and PMIs have come in below expectations.
Labour market is softening, and wage growth is decelerating.
2-Dovish Expectations for BoE:
With inflation cooling down, the Bank of England is expected to hold or even cut rates soon, reducing support for the pound.
3-Stronger USD Outlook
Despite some weaker U.S. data, the Fed maintains a hawkish stance. U.S. retail sales and inflation still support the dollar overall.
4-UK Political Risk
Upcoming UK elections on July 4 are adding uncertainty and downside risk to GBP.
--------------------------------------------------------
I expect GBPUSD to attack at least the Support lines based on the above explanation.
Targets: 1.3
1)1.3353 USD =>Risk-To-Reward: 1.51
2)1.3315 USD =>Risk-To-Reward: 2.00
Note: Stop Loss(SL): 1.3549 USD
Please respect each other's ideas and express them politely if you agree or disagree.
British Pound / U.S Dollar Analyze (GBPUSD), 1-hour time frame.
Be sure to follow the updated ideas.
Do not forget to put a Stop loss for your positions (For every position you want to open).
Please follow your strategy and updates; this is just my Idea, and I will gladly see your ideas in this post.
Please do not forget the ✅' like '✅ button 🙏😊 & Share it with your friends; thanks, and Trade safe.

GBPUSD– Rejection at Resistance: Technical and Macro PullbackGBPUSD has climbed back into a strong multi-week resistance zone just beneath 1.3670. While the recent rally was sharp, it now confronts both structural resistance and weakening UK fundamentals. The British economy is losing steam—GDP contracted more than expected, manufacturing output is weak, and the latest CBI survey paints a grim industrial outlook. Meanwhile, Fed officials continue to push back on early rate cut expectations, lending resilience to the USD. Technically, this aligns with a potential top forming near 1.3630–1.3670, offering a compelling risk-reward for sellers.
🔻 Bias: Bearish
• Favoring short setups from resistance, backed by weak UK data and a sticky Fed narrative.
🔑 Key Fundamentals
🇬🇧 UK:
May GDP: –0.3% m/m (worse than forecast)
CBI Industrial Trends: Output volumes and orders well below long-run average
Inflation slowing, but BoE hesitant amid stagnant growth – classic stagflation
🇺🇸 US:
Fed officials (Barkin, Collins, Cook) emphasize caution
Core services inflation still elevated
Fed rate cuts now expected in September, not July
⚠️ Risks to the Bearish View
Hawkish surprise from the BoE (if they hike or signal tightening)
U.S. Core PCE comes in soft, pressuring the USD
Sustained global risk-on rally pulling GBP higher via equities
📅 Important Events to Watch
June 25–26: Fed Chair Powell testimony to Congress
June 28: U.S. Core PCE inflation report
UK CPI revisions, retail sales, and BoE commentary
U.S. jobs and consumer confidence (early July)
📉 Technical Setup – Short from Key Supply Zone
Chart Structure:
Major confluence resistance at 1.3625–1.3665 (blue zone)
Multiple rejection wicks + ascending wedge structure
Bearish divergence building on momentum (not shown)
🎯 Trade Setup:
Entry Zone:
🔹 Sell between 1.3625 and 1.3665, ideally after a bearish engulfing/pin bar or 4H rejection
Take Profits:
TP1: 1.3535 – local support
TP2: 1.3465 – fib and horizontal confluence
TP3: 1.3390 – wedge breakdown target
Stop Loss / Invalidation:
🔸 SL above 1.3685**
A 4H/1D candle close above invalidates the setup and opens the door to new highs.
Risk-Reward:
RR to TP1: ~1.8
RR to TP3: 3.5+
🧭 Summary:
GBPUSD is technically stretched and facing key resistance. With UK macro data deteriorating and Fed members holding the line, this rally looks increasingly vulnerable. As long as 1.3685 holds, sellers may dominate with clear downside targets over the next 1–2 weeks.

GBPUSD Sell - June, 24📍Context:
Reaction from Weekly & Daily OBs
Price tapped into a 4H OB
Asia low to fill
15m & 5m POIs showing clear rejection
Presence of wicks signaling slowdown + bearish engulfing confirming seller control
📍Entry:
Based on 15m imbalance left behind
SL placed above recent highs – structure still valid
🎯 TP:
Minimum 1:3 RR
Final target: Asia lows

British Pound Slips to One-Month LowGBP/USD briefly climbed to 1.3560 in early European trading, supported by dollar softness and anticipation of upcoming speeches from BoE Governor Bailey and Fed Chair Powell. However, the pair remains under pressure, as market doubts linger around the ceasefire’s durability, especially after new missile activity by Israel’s IDF.
Fed rate cut expectations continue to build: odds for July are now at 23%, and 78% for September, fueled by dovish remarks from Governor Bowman.
Resistance is seen at 1.3600, while support holds at 1.3500.
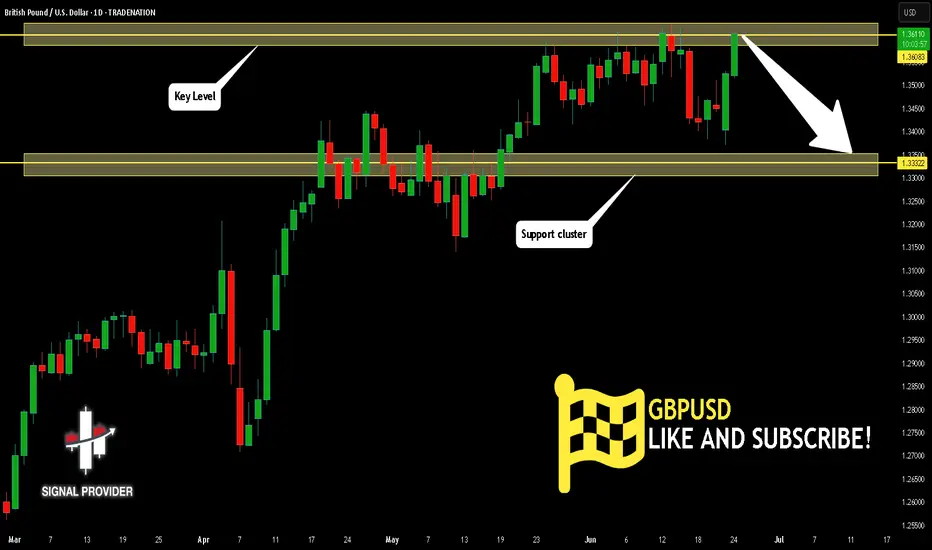
GBPUSD Will Move Lower! Sell!
Please, check our technical outlook for GBPUSD.
Time Frame: 1D
Current Trend: Bearish
Sentiment: Overbought (based on 7-period RSI)
Forecast: Bearish
The market is approaching a key horizontal level 1.360.
Considering the today's price action, probabilities will be high to see a movement to 1.333.
P.S
Please, note that an oversold/overbought condition can last for a long time, and therefore being oversold/overbought doesn't mean a price rally will come soon, or at all.
Disclosure: I am part of Trade Nation's Influencer program and receive a monthly fee for using their TradingView charts in my analysis.
Like and subscribe and comment my ideas if you enjoy them!
Fundamental Market Analysis for June 24, 2025 GBPUSDThe GBP/USD pair is strengthening to 1.3560 in the early European session on Tuesday, helped by a weaker US Dollar (USD).
Federal Reserve (Fed) Governor Michelle Bowman said on Monday that she would favor an interest rate cut at the next meeting in July if inflationary pressures remain muted. Bowman's comments echoed those of Fed chief Christopher Waller, who said on Friday that he believes the U.S. central bank may consider a rate cut in July.
Traders now put the probability of a rate change at the July meeting at nearly 23%, and the probability that the Fed will cut rates in September at about 78%.
On the other hand, uncertainty surrounding the ceasefire between Israel and Iran and renewed tensions in the Middle East could increase safe-haven flows, supporting the Pound Sterling (GBP). The Israel Defense Forces said early Tuesday it had detected rockets launched from Iran towards southern Israel, despite US President Donald Trump saying a “full and final” ceasefire between Israel and Iran would take effect.
Trading recommendation: SELL 1.3545, SL 1.3645, TP 1.3345

GBPAUD XABCD Short from PRZ/D TP1/TP2 Swing Trade🔸Hello traders, let's review the 20 MINUTE chart for GBPAUD. Strong gains off the lows recently, however price getting overextended and expecting reversal later at/near PRZ/D.
🔸Speculative XABCD structure defined by point X 1000 point A 0700 point B 0930 point C 0640 point D/PRZ 1080 still pending.
🔸Currently most points validated, point D/PRZ still pending 1080, so traders should wait until we hit D before SHORTING.
🔸Recommended strategy for GA traders: wait for price to max out to complete at point D near 1080, short/hold, SL 80 pips, TP1/TP2/TP3 0940/0840/0780. SHORT/HOLD at point D/PRZ at 1080 swing trade setup. keep in mind this is a swing trade setup, patience required.
🎁Please hit the like button and
🎁Leave a comment to support our team!
RISK DISCLAIMER:
Trading Futures , Forex, CFDs and Stocks involves a risk of loss.
Please consider carefully if such trading is appropriate for you.
Past performance is not indicative of future results.
Always limit your leverage and use tight stop loss.

GBPUSD SHORT FORECAST Q2 W26 D24 Y25GBPUSD SHORT FORECAST Q2 W26 D24 Y25
Professional Risk Managers👋
Welcome back to another FRGNT chart update📈
Diving into some Forex setups using predominantly higher time frame order blocks alongside confirmation breaks of structure.
Let’s see what price action is telling us today!
💡Here are some trade confluences📝
✅Daily order block
✅1H Order block
✅Intraday breaks of structure
✅4H Order block
🔑 Remember, to participate in trading comes always with a degree of risk, therefore as professional risk managers it remains vital that we stick to our risk management plan as well as our trading strategies.
📈The rest, we leave to the balance of probabilities.
💡Fail to plan. Plan to fail.
🏆It has always been that simple.
❤️Good luck with your trading journey, I shall see you at the very top.
🎯Trade consistent, FRGNT X

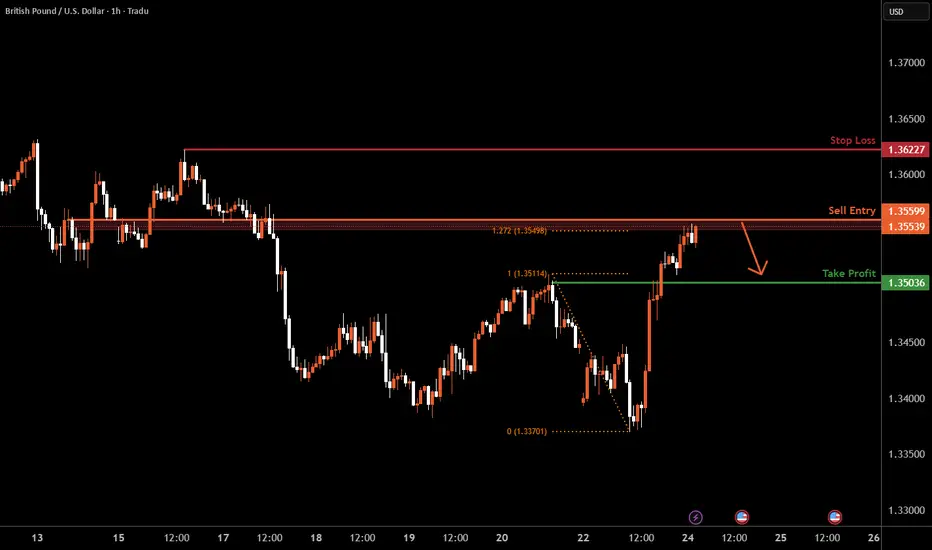
GBPUSD H1 I Bearish Reversal Based on the H4 chart, the price is trading near our sell entry level at 1.3559, a pullback resistance that aligns with the127.2Fib extension.
Our take profit is set at 1.3503, a pullback support.
The stop loss is set at 1.3622, a swing high resistance.
High Risk Investment Warning
Trading Forex/CFDs on margin carries a high level of risk and may not be suitable for all investors. Leverage can work against you.
Stratos Markets Limited (tradu.com ):
CFDs are complex instruments and come with a high risk of losing money rapidly due to leverage. 63% of retail investor accounts lose money when trading CFDs with this provider. You should consider whether you understand how CFDs work and whether you can afford to take the high risk of losing your money.
Stratos Europe Ltd (tradu.com ):
CFDs are complex instruments and come with a high risk of losing money rapidly due to leverage. 63% of retail investor accounts lose money when trading CFDs with this provider. You should consider whether you understand how CFDs work and whether you can afford to take the high risk of losing your money.
Stratos Global LLC (tradu.com ):
Losses can exceed deposits.
Please be advised that the information presented on TradingView is provided to Tradu (‘Company’, ‘we’) by a third-party provider (‘TFA Global Pte Ltd’). Please be reminded that you are solely responsible for the trading decisions on your account. There is a very high degree of risk involved in trading. Any information and/or content is intended entirely for research, educational and informational purposes only and does not constitute investment or consultation advice or investment strategy. The information is not tailored to the investment needs of any specific person and therefore does not involve a consideration of any of the investment objectives, financial situation or needs of any viewer that may receive it. Kindly also note that past performance is not a reliable indicator of future results. Actual results may differ materially from those anticipated in forward-looking or past performance statements. We assume no liability as to the accuracy or completeness of any of the information and/or content provided herein and the Company cannot be held responsible for any omission, mistake nor for any loss or damage including without limitation to any loss of profit which may arise from reliance on any information supplied by TFA Global Pte Ltd.
The speaker(s) is neither an employee, agent nor representative of Tradu and is therefore acting independently. The opinions given are their own, constitute general market commentary, and do not constitute the opinion or advice of Tradu or any form of personal or investment advice. Tradu neither endorses nor guarantees offerings of third-party speakers, nor is Tradu responsible for the content, veracity or opinions of third-party speakers, presenters or participants.
GBPUSDPresident Trump claims the war is over we will observe if this will make volatility stabilize, GU is aiming a Key level which might potentially create a new LL, lets see how it goes!

Bullish rise off pullback support?The Cable (GBP/USD) is falling towards the pivot which is a pullback support and could bounce to the 1st resistance.
Pivot: 1.3503
1st Support: 1.3455
1st Resistance: 1.3616
Risk Warning:
Trading Forex and CFDs carries a high level of risk to your capital and you should only trade with money you can afford to lose. Trading Forex and CFDs may not be suitable for all investors, so please ensure that you fully understand the risks involved and seek independent advice if necessary.
Disclaimer:
The above opinions given constitute general market commentary, and do not constitute the opinion or advice of IC Markets or any form of personal or investment advice.
Any opinions, news, research, analyses, prices, other information, or links to third-party sites contained on this website are provided on an "as-is" basis, are intended only to be informative, is not an advice nor a recommendation, nor research, or a record of our trading prices, or an offer of, or solicitation for a transaction in any financial instrument and thus should not be treated as such. The information provided does not involve any specific investment objectives, financial situation and needs of any specific person who may receive it. Please be aware, that past performance is not a reliable indicator of future performance and/or results. Past Performance or Forward-looking scenarios based upon the reasonable beliefs of the third-party provider are not a guarantee of future performance. Actual results may differ materially from those anticipated in forward-looking or past performance statements. IC Markets makes no representation or warranty and assumes no liability as to the accuracy or completeness of the information provided, nor any loss arising from any investment based on a recommendation, forecast or any information supplied by any third-party.

Major resistance ahead?GBP/USD is rising towards the resistance level which is an overlap resistance and could reverse from this level to our take profit.
Entry: 1.3535
Why we like it:
There is an overlap resistance level.
Stop loss: 1.3449
Why we like it:
There is a pullback resistance level that lines up with the 161.8% Fibonacci extension.
Take profit: 1.3449
Why we like it:
There is a pullback support level.
Enjoying your TradingView experience? Review us!
Please be advised that the information presented on TradingView is provided to Vantage (‘Vantage Global Limited’, ‘we’) by a third-party provider (‘Everest Fortune Group’). Please be reminded that you are solely responsible for the trading decisions on your account. There is a very high degree of risk involved in trading. Any information and/or content is intended entirely for research, educational and informational purposes only and does not constitute investment or consultation advice or investment strategy. The information is not tailored to the investment needs of any specific person and therefore does not involve a consideration of any of the investment objectives, financial situation or needs of any viewer that may receive it. Kindly also note that past performance is not a reliable indicator of future results. Actual results may differ materially from those anticipated in forward-looking or past performance statements. We assume no liability as to the accuracy or completeness of any of the information and/or content provided herein and the Company cannot be held responsible for any omission, mistake nor for any loss or damage including without limitation to any loss of profit which may arise from reliance on any information supplied by Everest Fortune Group.
