GBPUSD Trading Strategy for the WeekGBPUSD is reacting at the support zone of 1.34000. This is the last important support zone that the pair is facing. If this support zone is broken, the pair will enter a prolonged Downtrend phase. 1.325 could be the target for this decline.
If the 1.34000 zone is pushed up by buyers, the pair will touch the 1.35000 border zone. If this zone is broken, the pair will form a double bottom pattern and continue to increase back to the peak of last week around 1.36000. In case the buying force is not strong enough to break 1.35000, the pair will return to the sideway in the rectangular border.
Support: 1.32500
Resistance: 1.36000
Break out: 1.34000-1.35000
Recommended good trading strategy:
Trade when price confirms in Break out zone.
BUY 1.32600-1.32400 Stoploss 1.32000
SELL 1.35900-1.36100 Stoploss 1.36400
GBPUSD

GBPUSDHello Traders! 👋
What are your thoughts on GBPUSD?
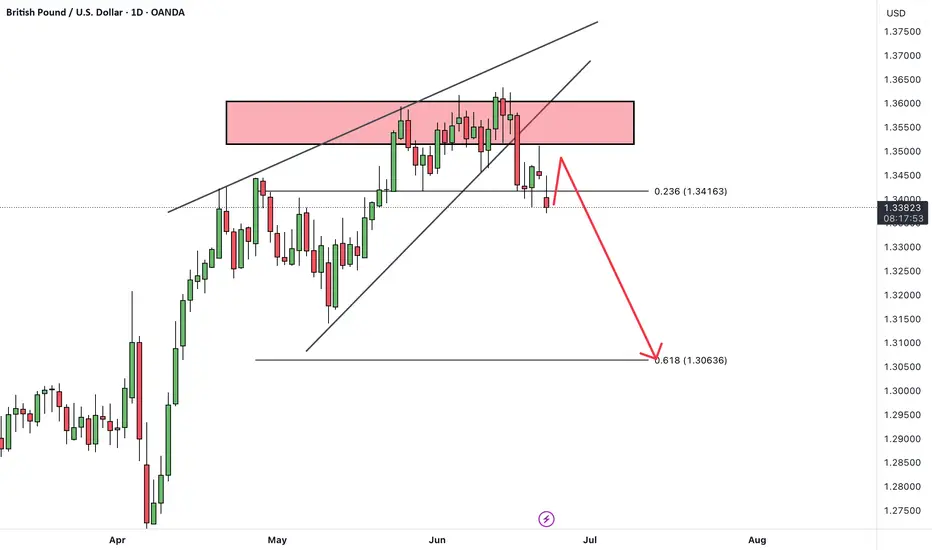
On the GBPUSD chart, we can see that the price has repeatedly tested a key resistance zone but failed to break above it, resulting in multiple rejections.
After forming a rising wedge pattern, the pair has broken down below the wedge, and is now completing a pullback toward the broken trendline.
We expect that after some consolidation in this area and completion of the pullback, the price will likely resume its decline toward lower targets.
As long as price remains below the resistance zone and broken trendline, the bearish scenario remains valid.
Is the pullback complete and ready for the next leg down? Share your view below! 🤔👇
Don’t forget to like and share your thoughts in the comments! ❤️
GBPUSD Will Fall! Sell!
Here is our detailed technical review for GBPUSD.
Time Frame: 6h
Current Trend: Bearish
Sentiment: Overbought (based on 7-period RSI)
Forecast: Bearish
The market is approaching a significant resistance area 1.349.
Due to the fact that we see a positive bearish reaction from the underlined area, I strongly believe that sellers will manage to push the price all the way down to 1.341 level.
P.S
The term oversold refers to a condition where an asset has traded lower in price and has the potential for a price bounce.
Overbought refers to market scenarios where the instrument is traded considerably higher than its fair value. Overvaluation is caused by market sentiments when there is positive news.
Disclosure: I am part of Trade Nation's Influencer program and receive a monthly fee for using their TradingView charts in my analysis.
Like and subscribe and comment my ideas if you enjoy them!

GBPUSD Is Very Bearish! Sell!
Take a look at our analysis for GBPUSD.
Time Frame: 5h
Current Trend: Bearish
Sentiment: Overbought (based on 7-period RSI)
Forecast: Bearish
The market is testing a major horizontal structure 1.357.
Taking into consideration the structure & trend analysis, I believe that the market will reach 1.351 level soon.
P.S
The term oversold refers to a condition where an asset has traded lower in price and has the potential for a price bounce.
Overbought refers to market scenarios where the instrument is traded considerably higher than its fair value. Overvaluation is caused by market sentiments when there is positive news.
Disclosure: I am part of Trade Nation's Influencer program and receive a monthly fee for using their TradingView charts in my analysis.
Like and subscribe and comment my ideas if you enjoy them!

GBP/USD BEARS ARE STRONG HERE|SHORT
Hello, Friends!
We are going short on the GBP/USD with the target of 1.344 level, because the pair is overbought and will soon hit the resistance line above. We deduced the overbought condition from the price being near to the upper BB band. However, we should use low risk here because the 1W TF is green and gives us a counter-signal.
Disclosure: I am part of Trade Nation's Influencer program and receive a monthly fee for using their TradingView charts in my analysis.
✅LIKE AND COMMENT MY IDEAS✅

GBP/USD Breakout Done , Best Place To Get 150 Pips Clear !Here is my opinion on GBP/USD On 2H T.F , We have a very good breakout now clear not as the old one and we have a very good bearish price action , so i think it will be a good entry if the price go back to retest my res with the news today and give us a good touch and go to downside , and also we might see a random move and fake wicks to take all stop losses before going down or even back to upside so be careful today and use a good risk , i`m waiting the price to back to retest the broken support and new res and then i will enter a sell trade with a very small lot size .

GBP/USD Weakens Ahead of PMI ReleasesGBP/USD fell to around 1.3405 during Monday’s Asian session as safe-haven flows strengthened the US dollar amid rising Middle East tensions. Fears of Iranian retaliation after US airstrikes on three nuclear sites lifted demand for the Greenback. Trump said Iran’s facilities were “totally obliterated” and warned of stronger attacks unless peace is reached. Iran vowed to respond, saying it “reserves all options.”
Investors await June PMI data from the UK and US due later Monday. The Pound remains under pressure after UK retail sales dropped 2.7% MoM in May, well below the expected 0.5% decline and April’s revised 1.3% gain.
The BoE held rates at 4.25% last Thursday. Governor Bailey said rates are on a gradual downward path but warned of global unpredictability. Reuters expects 25 bps cuts in both August and Q4.
Resistance is seen at 1.3500, while support holds at 1.3415.

Market Analysis: GBP/USD Dips Below SupportMarket Analysis: GBP/USD Dips Below Support
GBP/USD started a fresh decline below the 1.3620 zone.
Important Takeaways for GBP/USD Analysis Today
- The British Pound started another decline from the 1.3620 resistance zone.
- There was a break below a connecting bullish trend line with support at 1.3460 on the hourly chart of GBP/USD at FXOpen.
GBP/USD Technical Analysis
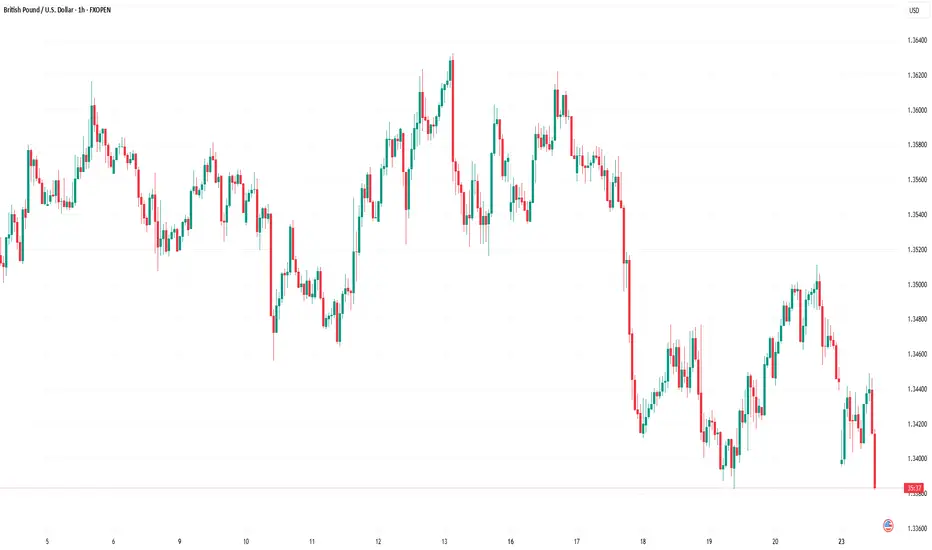
On the hourly chart of GBP/USD at FXOpen, the pair struggled to continue higher above the 1.3620 resistance zone. The British Pound started a fresh decline and traded below the 1.3550 support zone against the US Dollar, as discussed in the previous analysis.
The pair even traded below 1.3500 and the 50-hour simple moving average. Finally, the bulls appeared near the 1.3380 level. There was a recovery wave above the 1.3450 level and the 23.6% Fib retracement level of the downward move from the 1.3622 swing high to the 1.3382 low.
However, the bears were active near the 1.3500 zone and the 50% Fib retracement level. As a result, there was a fresh bearish reaction below a connecting bullish trend line with support at 1.3460.
Initial support on the GBP/USD chart sits at 1.3380. The next major support is at 1.3350, below which there is a risk of another sharp decline. In the stated case, the pair could drop toward 1.3200.
Immediate resistance on the upside is near 1.3440. The first major resistance is near the 1.3500 zone. The main hurdle sits at 1.3530. A close above the 1.3530 resistance might spark a steady upward move. The next major resistance is near the 1.3565 zone. Any more gains could lead the pair toward the 1.3620 resistance in the near term.
This article represents the opinion of the Companies operating under the FXOpen brand only. It is not to be construed as an offer, solicitation, or recommendation with respect to products and services provided by the Companies operating under the FXOpen brand, nor is it to be considered financial advice.
GBPUSD LONG FORECAST Q2 W26 D23 Y25GBPUSD LONG FORECAST Q2 W26 D23 Y25
Professional Risk Managers👋
Welcome back to another FRGNT chart update📈
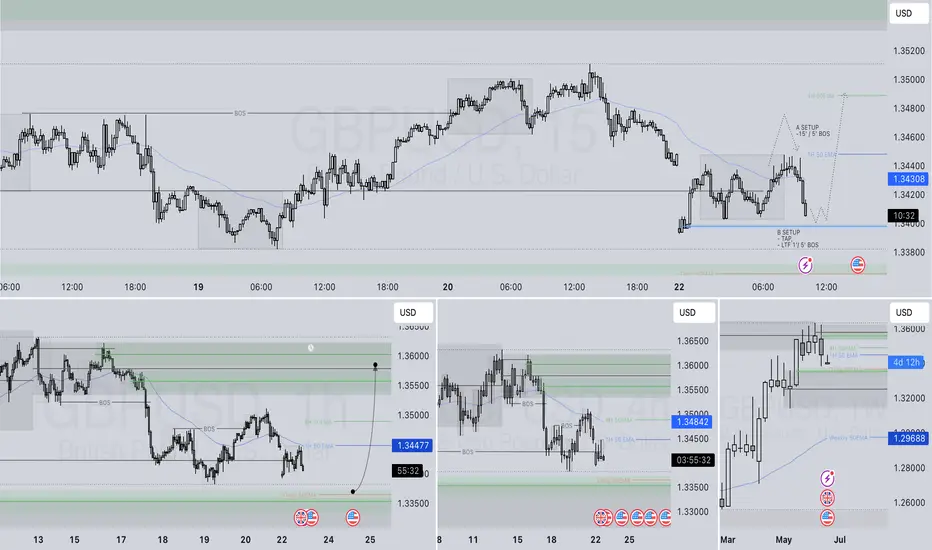
Diving into some Forex setups using predominantly higher time frame order blocks alongside confirmation breaks of structure.
Let’s see what price action is telling us today!
💡Here are some trade confluences📝
✅Daily order block
✅15' order block
✅Intraday breaks of structure
✅4H Order block
🔑 Remember, to participate in trading comes always with a degree of risk, therefore as professional risk managers it remains vital that we stick to our risk management plan as well as our trading strategies.
📈The rest, we leave to the balance of probabilities.
💡Fail to plan. Plan to fail.
🏆It has always been that simple.
❤️Good luck with your trading journey, I shall see you at the very top.
🎯Trade consistent, FRGNT X
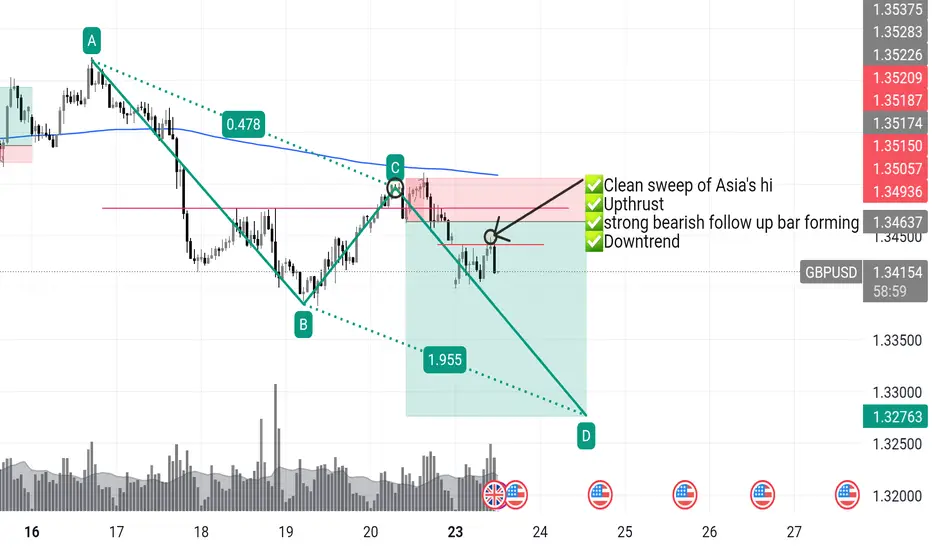
GBPUSD short re-entryGBPUSD – I Got Clipped. Now I’m Coming Back With Intent.
📅 Monday | June 23, 2025
Yes — I got stopped out. That’s execution, not failure.
Clean sweep of Asia’s high. Textbook.
Liquidity taken. Weak hands shaken. Now the real move can begin.
🔁 This 1H close is my greenlight for re-entry.
I don’t hesitate when the market gives me the same setup twice —
It’s still:
✅ Downtrend dominant
✅ Upthrust confirmed
✅ Sellers stepping back in
✅ Price under key rejection zone
If this bar closes bearish, I’m short again — this time with full intent.
📉 Target: 3r+ and beyond
🔥 London
GBPUSD INTRADAY bullish consolidation supported at 1.3380The GBPUSD currency pair maintains a bullish price action structure, supported by the ongoing rising trend. Current intraday movement appears to be a corrective pullback within a consolidation phase, potentially offering a buying opportunity within the broader uptrend.
Key Technical Levels:
Support (Key Trading Level): 1.3380 (prior consolidation zone)
Additional Support: 1.3340 and 1.3300
Upside Resistance Targets:
1.3480
1.3550
1.3600 (longer-term target)
Bullish Scenario:
A bounce from the 1.3380 support would confirm the continuation of the bullish trend. Sustained upside momentum could then target 1.3480, with further extensions toward 1.3550 and 1.3600 over the medium term.
Bearish Alternative:
A confirmed daily close below 1.3380 would invalidate the bullish outlook and suggest deeper downside retracement. In that case, the next support levels to monitor would be 1.3340 and 1.3300.
Conclusion:
The bias remains bullish while GBPUSD holds above 1.3380. A rebound from this level supports long positions toward higher resistance zones. However, a break and close below 1.3380 would shift the outlook to neutral-to-bearish, favouring further downside correction. Traders should watch price action around 1.3380 for directional confirmation.
This communication is for informational purposes only and should not be viewed as any form of recommendation as to a particular course of action or as investment advice. It is not intended as an offer or solicitation for the purchase or sale of any financial instrument or as an official confirmation of any transaction. Opinions, estimates and assumptions expressed herein are made as of the date of this communication and are subject to change without notice. This communication has been prepared based upon information, including market prices, data and other information, believed to be reliable; however, Trade Nation does not warrant its completeness or accuracy. All market prices and market data contained in or attached to this communication are indicative and subject to change without notice.

GBPUSD London Session | Live Forex Analysis & Trade ideasIn today’s London session, we conducted a detailed intraday analysis on the GBPUSD currency pair using wave structure analysis on the 5-minute (M5) timeframe.
Price action confirmed a break below bullish market structure that had previously formed the Asian session high, signalling a potential shift in market sentiment to the downside. This breakdown confirmed short-term bearish momentum shift.
Following the completion of the bearish wave, the price retraced to form a structural pullback (trend reset), providing a discounted price zone for new short positions and offering profit-taking opportunities for earlier sellers.
Our trading plan for this session is to sell GBPUSD at 1.3488, anticipating a move below the midline (ML) support at 1.3462. The technical target for this trade, based on our London-New York session projection, is set at 1.3417.
The stop-loss for this setup is placed above MH of the bearish structure at 1.3505, maintaining proper risk management.
This trade idea aligns with our trend-following strategy and is supported by real-time price action analysis.
📉 Short Bias Confirmed
🎯 Entry: 1.3488
🛑 Stop Loss: 1.3505
✅ Take Profit: 1.3417
Trade safe, manage your risk, and stay blessed.

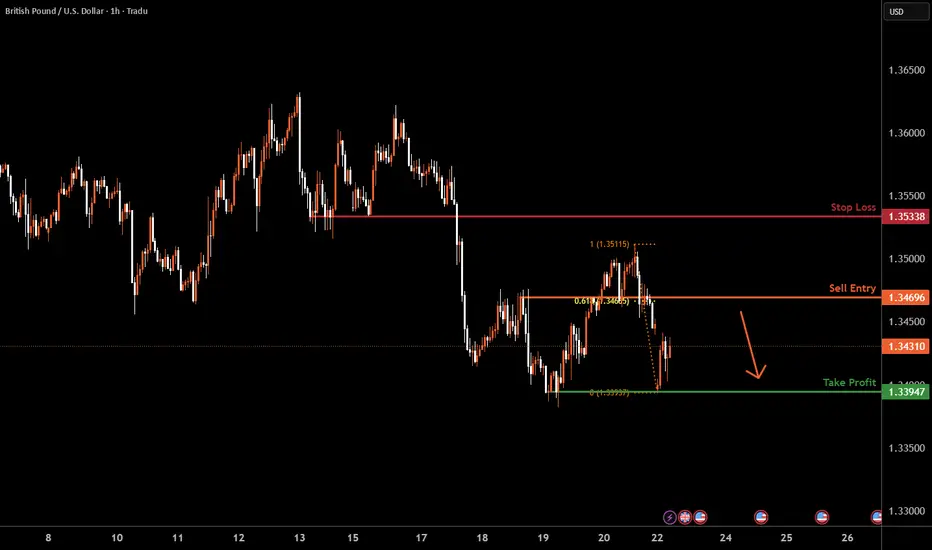
GBPUSD H1 I Bearish Reversal Based on the H4 chart, the price is rising our sell entry level at 1.3469, a pullback resistance that aligns with the 61.8% Fib retracement.
Our take profit is set at 1.3394, a swing low support.
The stop loss is set at 1.3533, a pullback resistance.
High Risk Investment Warning
Trading Forex/CFDs on margin carries a high level of risk and may not be suitable for all investors. Leverage can work against you.
Stratos Markets Limited (tradu.com ):
CFDs are complex instruments and come with a high risk of losing money rapidly due to leverage. 63% of retail investor accounts lose money when trading CFDs with this provider. You should consider whether you understand how CFDs work and whether you can afford to take the high risk of losing your money.
Stratos Europe Ltd (tradu.com ):
CFDs are complex instruments and come with a high risk of losing money rapidly due to leverage. 63% of retail investor accounts lose money when trading CFDs with this provider. You should consider whether you understand how CFDs work and whether you can afford to take the high risk of losing your money.
Stratos Global LLC (tradu.com ):
Losses can exceed deposits.
Please be advised that the information presented on TradingView is provided to Tradu (‘Company’, ‘we’) by a third-party provider (‘TFA Global Pte Ltd’). Please be reminded that you are solely responsible for the trading decisions on your account. There is a very high degree of risk involved in trading. Any information and/or content is intended entirely for research, educational and informational purposes only and does not constitute investment or consultation advice or investment strategy. The information is not tailored to the investment needs of any specific person and therefore does not involve a consideration of any of the investment objectives, financial situation or needs of any viewer that may receive it. Kindly also note that past performance is not a reliable indicator of future results. Actual results may differ materially from those anticipated in forward-looking or past performance statements. We assume no liability as to the accuracy or completeness of any of the information and/or content provided herein and the Company cannot be held responsible for any omission, mistake nor for any loss or damage including without limitation to any loss of profit which may arise from reliance on any information supplied by TFA Global Pte Ltd.
The speaker(s) is neither an employee, agent nor representative of Tradu and is therefore acting independently. The opinions given are their own, constitute general market commentary, and do not constitute the opinion or advice of Tradu or any form of personal or investment advice. Tradu neither endorses nor guarantees offerings of third-party speakers, nor is Tradu responsible for the content, veracity or opinions of third-party speakers, presenters or participants.
Bullish bounce?The Cable (GBP/USD) is falling towards the pivot and could bounce to the 1st resistance.
Pivot: 1.3328
1st Support: 1.3133
1st Resistance: 1.3636
Risk Warning:
Trading Forex and CFDs carries a high level of risk to your capital and you should only trade with money you can afford to lose. Trading Forex and CFDs may not be suitable for all investors, so please ensure that you fully understand the risks involved and seek independent advice if necessary.
Disclaimer:
The above opinions given constitute general market commentary, and do not constitute the opinion or advice of IC Markets or any form of personal or investment advice.
Any opinions, news, research, analyses, prices, other information, or links to third-party sites contained on this website are provided on an "as-is" basis, are intended only to be informative, is not an advice nor a recommendation, nor research, or a record of our trading prices, or an offer of, or solicitation for a transaction in any financial instrument and thus should not be treated as such. The information provided does not involve any specific investment objectives, financial situation and needs of any specific person who may receive it. Please be aware, that past performance is not a reliable indicator of future performance and/or results. Past Performance or Forward-looking scenarios based upon the reasonable beliefs of the third-party provider are not a guarantee of future performance. Actual results may differ materially from those anticipated in forward-looking or past performance statements. IC Markets makes no representation or warranty and assumes no liability as to the accuracy or completeness of the information provided, nor any loss arising from any investment based on a recommendation, forecast or any information supplied by any third-party.

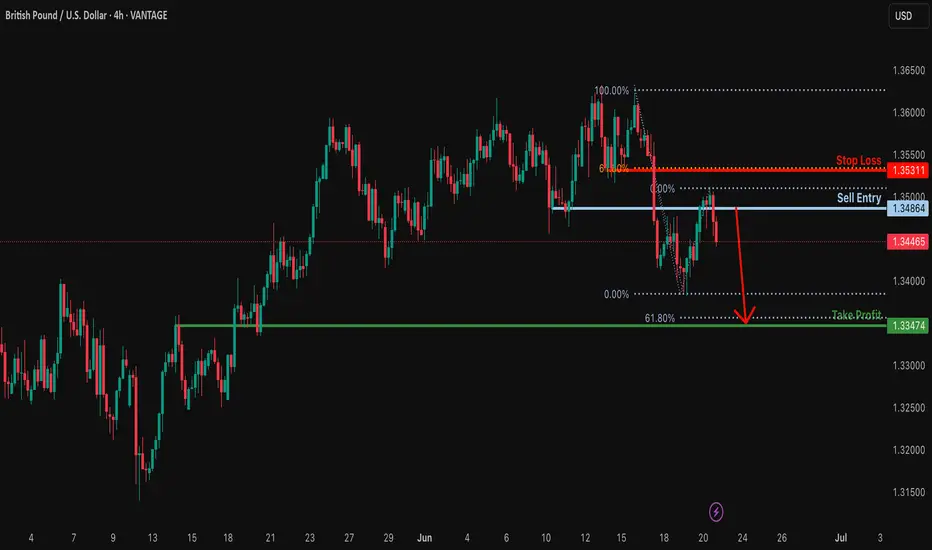
Bearish drop off pullback resistance?GBP/USD has rejected off the resistance level which is a pullback resistance and could drop from this level to our take profit.
Entry: 1.3486
Why we like it:
There is a pullback resistance level.
Stop loss: 1.3531
Why we like it:
There is a pullback resistance level that aligns with the 61.8% Fibonacci retracement.
Take profit: 1.3347
Why we like it:
There is a pullback support level that lines up with the 61.8% Fibonacci projection.
Enjoying your TradingView experience? Review us!
Please be advised that the information presented on TradingView is provided to Vantage (‘Vantage Global Limited’, ‘we’) by a third-party provider (‘Everest Fortune Group’). Please be reminded that you are solely responsible for the trading decisions on your account. There is a very high degree of risk involved in trading. Any information and/or content is intended entirely for research, educational and informational purposes only and does not constitute investment or consultation advice or investment strategy. The information is not tailored to the investment needs of any specific person and therefore does not involve a consideration of any of the investment objectives, financial situation or needs of any viewer that may receive it. Kindly also note that past performance is not a reliable indicator of future results. Actual results may differ materially from those anticipated in forward-looking or past performance statements. We assume no liability as to the accuracy or completeness of any of the information and/or content provided herein and the Company cannot be held responsible for any omission, mistake nor for any loss or damage including without limitation to any loss of profit which may arise from reliance on any information supplied by Everest Fortune Group.
Bearish GBP/USD Outlook: Shorting the Pound Against the DollarI can write a lot of text here but let make it short, liek and sub from you for that:
3 options:
pump till PDH then dump to weekly FVG 1.34 area
dump from here till weekly FVG 1.34 area
if it breaks above PWH with good volume and closing at least on 4h then only longs

GBPUSD: Bullish Continuation & Long Signal
GBPUSD
- Classic bullish setup
- Our team expects bullish continuation
SUGGESTED TRADE:
Swing Trade
Long GBPUSD
Entry Point - 1.3449
Stop Loss - 1.3413
Take Profit - 1.3520
Our Risk - 1%
Start protection of your profits from lower levels
Disclosure: I am part of Trade Nation's Influencer program and receive a monthly fee for using their TradingView charts in my analysis.
❤️ Please, support our work with like & comment! ❤️

GBPUSDGBPUSD still needs some more correction before it goes to 1.365.
Disclosure: We are part of Trade Nation's Influencer program and receive a monthly fee for using their TradingView charts in our analysis.

AI Algo Systems vs. Manual Trading: Which Delivers Real Results?AI Algo Systems vs. Manual Trading: Which Delivers Real Results? ⚖️
________________________________________
Introduction
With the explosive rise of artificial intelligence (AI) in financial markets, traders everywhere are asking the million-dollar question:
Should I trust my trades to automation, or keep my hands on the wheel? 🧠🤖
This guide offers a real-world, side-by-side comparison between AI-powered algorithmic trading systems and traditional manual trading. We’ll highlight where each method dominates, when they fail, and how you can combine both to build a system that outperforms the rest. 💡
What Are AI Algo Systems? 🤖
AI trading systems use advanced machine learning models to:
• Analyze huge volumes of historical and real-time data 📈
• Detect patterns and trading opportunities faster than any human
• Automatically execute trades using coded logic, without emotion
🔬 Real-World Examples:
• Neural networks (LSTM, CNN): Predicting EUR/USD direction based on years of tick data
• Reinforcement learning agents: Managing position sizing dynamically in crypto scalping
• Predictive classifiers: Spotting likely trend reversals on S&P 500 based on 20+ indicators
Key Benefits:
• 🔄 Emotionless execution: No fear, no greed, just rules
• ⏱️ Lightning-fast trades: React to price action instantly
• 📊 Pattern recognition: Finds subtle correlations people miss
________________________________________
What Is Manual Trading? 👤
Manual trading is powered by human intelligence and judgment. Traders use:
• Price action and SMC/ICT techniques (e.g., order blocks, BOS)
• Fundamental analysis: News, sentiment, macro reports
• Intuition and experience: Reading between the lines the way only humans can
🧑💼 Real-World Examples:
• A trader spots an untested order block on GBP/JPY and waits for liquidity sweep before entering
• Reading a dovish tone in FOMC minutes and fading the initial spike on DXY
• Using “market structure shifts” after a big news event to catch a reversal
Key Benefits:
• 🔍 Contextual awareness: Understand the full market story
• 🎯 Real-time adaptability: Adjust plans on the fly
• 🧠 Creative edge: Find setups no algorithm can code for
________________________________________
Side-by-Side Comparison Table 📋
Feature AI Algo Trading 🤖 Manual Trading 👤
Execution Speed Instant Slower, can lag
Emotions Involved None Prone to fear/greed
Adaptability Limited (needs retrain) High
Learning Curve High (coding/tech) Medium (market logic)
Strategy Flexibility Pre-coded only Unlimited creativity
Backtesting Automated Manual/semi-auto
Session Monitoring 24/5 via server Human-limited hours
________________________________________
When AI Algo Systems Work Best 💾
AI is unbeatable when you need:
• Scalability: Watching 10, 20, or even 100+ pairs 24/5
• High-frequency execution: Entering/exiting trades within milliseconds
• Repetitive strategies: Like mean reversion, breakout scalps, or arbitrage
📈 Example:
• Strategy: EUR/USD London open breakout
• Process: AI model detects volume and volatility spike, enters trade with 0.3% risk, targets FVG
• Results: 60% win rate, 1.8R average reward over 3 months
________________________________________
When Manual Trading Wins 🧠
Manual skills shine when you need:
• Discretionary entries: Especially with complex SMC/ICT structures
• Adapting to breaking news: Sudden CPI, FOMC shocks, geopolitical headlines
• Making sense of market narrative: When volatility is off the charts and AI gets confused
🗞️ Example:
• News: Surprise ECB rate hike
• Setup: Price sweeps liquidity and forms new order block
• Action: Trader enters based on confluence of structure, sentiment, and news
• Why AI fails: Model trained on normal volatility might get stopped out or miss entry entirely
________________________________________
Hybrid Strategy: The Best of Both Worlds 🌐
Elite traders combine the power of AI with human oversight.
Hybrid Workflow:
1. AI scans markets: Flags setups (order blocks, FVGs, volume spikes)
2. You review: Confirm bias with news, sentiment, or higher time frame
3. Entry:
o Manual (you pull the trigger)
o Semi-automated (AI suggests, you approve)
🔁 You save time, avoid missing setups, but keep critical discretion and control.
________________________________________
Risk Management: Algo vs. Manual 📊
AI:
• Stops, lot size, SL/TP are auto-calculated
• Consistent, never emotional
• Example: EA manages all USD pairs with 0.5% fixed risk per trade
Manual:
• Trader might override risk plan
• Discipline needed—easy to “revenge trade” after a loss
• Example: You up your risk size after a losing streak, breaking your rules
Best Practice:
📌 Let AI calculate risk size. Manually approve or override the entry. Double safety net.
________________________________________
Trader Case Study 👤
Name: Ray – $100K funded prop trader
Style: Hybrid (AI scanner + manual ICT confirmations)
Process:
• Sets HTF bias each morning
• AI scans for OB/BOS setups during NY session
• Manual review before entry
Performance:
• Win rate: 63%
• Avg R: 2.5
• Monthly gain: 9.7%
Ray’s Words:
“AI catches what I can’t see. I catch what it can’t understand.”
________________________________________
Mistakes to Avoid ❌
• 🚫 Blindly trusting black-box AI: Always verify signals
• 🚫 Micromanaging every tick: Let automation work, don’t over-interfere
• 🚫 Running AI during high-impact news: Most bots aren’t built for chaos
• 🚫 Ignoring psychology: Even if AI executes, your mindset impacts risk and management
________________________________________
Conclusion ✅
There’s no one-size-fits-all answer. The best traders in 2025 master both worlds. Here’s the winning formula:
• Harness AI’s speed and pattern recognition
• Lean on manual judgment for narrative and nuance
• Blend them with intention and structure for a trading system that’s fast, flexible, and resilient.
💥 Don’t pick sides. Master both.
That’s how the top 1% trade today—and win. 🚀⚙️📊

USDCAD DETAILED ANALYSISUSDCAD has formed a classic falling wedge pattern on the daily timeframe, with price currently pressing against the upper trendline resistance near 1.37300. This is a high-probability bullish reversal setup, and the pair is showing early signs of a potential breakout. The recent bullish momentum from the lows suggests buyers are stepping in aggressively, and if we get a strong daily close above the wedge, it could confirm the start of a new upward leg. My near-term target for this breakout is 1.47300, offering an excellent risk-reward profile.
From a fundamental perspective, the Canadian Dollar is currently under pressure due to weakening oil prices and softening domestic economic data. The Bank of Canada has recently signaled a dovish tilt following its latest rate cut in June, citing slower GDP growth and easing inflation. On the other hand, the US Dollar is finding renewed strength backed by sticky inflation and the Fed’s cautious stance on rate cuts. The divergence in monetary policy between the Fed and BoC is creating a favorable environment for USDCAD bulls.
Technically, the confluence of wedge resistance, bullish divergence on the RSI, and a clear higher low formation all point toward a breakout scenario. A break above 1.37600–1.38000 would unlock the next wave of bullish continuation, potentially accelerating momentum toward the 1.47 handle. This area also aligns with the previous March highs, making it a strong technical magnet.
I remain bullish on USDCAD and will be watching the breakout closely this week. If the pair holds above 1.36800 and breaks structure convincingly, I’ll be adding to longs on confirmation. The current setup presents a textbook breakout opportunity supported by strong fundamentals, technical structure, and market sentiment leaning in favor of the USD.

Forex and Gold Market Highlights June 21 2025Forex & Gold Market Highlights – June 21, 2025
🕒 Key Events This Week:
• 🏦 Fed officials signaling possible rate cuts vs. cautious economic tone
• 🌍 Escalating Israel–Iran tensions boosting safe-haven flows
• 🏭 Mixed U.S. macro data (retail sales, Philly Fed, housing) shaping Fed expectations
________________________________________
💶 EUR/USD Nears 1.1520 on Safe-Haven Flows
EUR/USD edged up to about 1.1520 amid weakness in the U.S. dollar, driven by global risk-off sentiment. Mixed signals from the Fed kept traders cautious.
________________________________________
💷 GBP/USD Hovering Around 1.3500 on USD Strength
GBP/USD remains near 1.3500, slipping slightly off highs after weaker UK retail data. The pair faces resistance in the 1.3550–1.3600 zone.
________________________________________
💴 USD/JPY Eyeballing 146 Resistance
USD/JPY climbed toward 146.00, driven by risk-averse USD demand and dovish BOJ stance. The pair is testing key retracement resistance near 146.76.
________________________________________
🥇 Gold Pulls Back but Holds Ground
Spot gold slid to around $3,334 3,381 this week, under pressure from a stronger dollar and diminished Fed rate-cut hopes. Still, geopolitical jitters kept it from falling hard.
• Weekly drop of ~2.5%, trading in a $3,330–$3,400 range.
________________________________________
📈 DXY Index Rallies on Risk Aversion
The U.S. Dollar Index rose ~0.45%, marking its strongest weekly gain in over a month due to heightened safe-haven flows amid Middle East tensions.
________________________________________
📌 Market Outlook:
• EUR/USD: Mixed bias. May test 1.1550–1.1600 if risk-off continues; downside risk near 1.1400 if U.S. data surprises.
• GBP/USD: Expected to stay in the 1.3450–1.3550 range; UK economic data and USD momentum will be key.
• USD/JPY: Bullish tilt remains toward 146.76, but any BOJ hints of policy tightening could shake it.
• Gold: Pressure from a firm dollar is likely to persist. Watch for geopolitical developments and upcoming Fed signals for reversal clues.

-0.5% Week | A Tough Reminder: Risk Management is EverythingFirst trade hit 2R , exited early due to the bank holiday.
Next day, I gave it all back. 3 stop-losses. Poor risk management .
I got overconfident after being in profit and paid the price.
Also realized mobile tools (like SL placement on TradingView app) can hurt if not set up right.
Last week was +6% with strict risk rules.
This week? A reminder that trading is 90% mindset and discipline.
Lessons:
• Protect your capital, always.
• Don’t loosen your rules after a win.
• Your edge only works if you follow your plan.
Stay disciplined. Survive the noise. Let your edge play out.

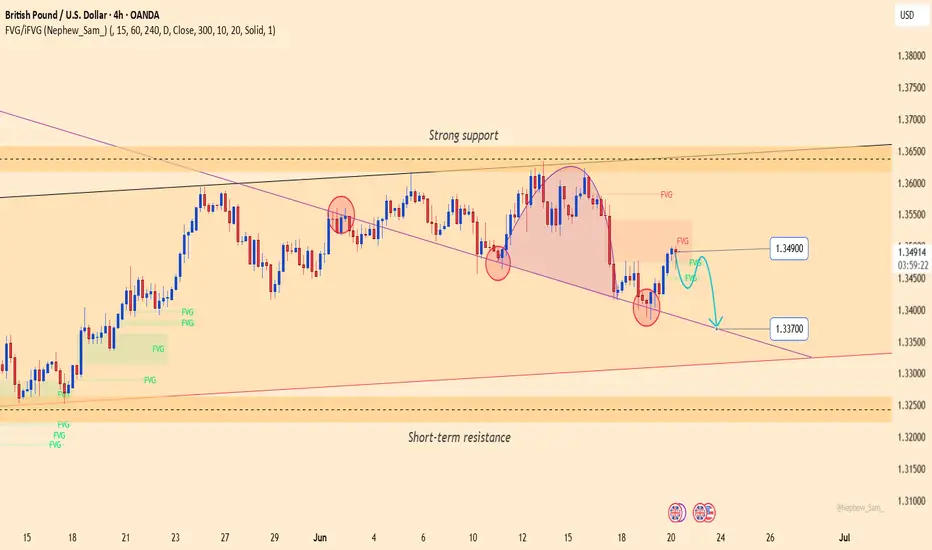
GBPUSD: Bearish pressure persistsGBPUSD is consolidating below a key medium-term resistance zone, with a rounding top and a minor head-and-shoulders pattern forming. The price is currently retesting the Fair Value Gap near 1.34900 — a potential reversal zone if it fails to break higher.
On the fundamental side, the Bank of England's decision to hold interest rates on June 19 disappointed the market. Meanwhile, the US dollar remains supported by safe-haven demand and the Federal Reserve’s hawkish tone, adding further pressure on GBP.
If GBPUSD fails to hold the trendline support near 1.33700, the risk of a deeper decline increases. Both the technical structure and macro fundamentals favor the bears.