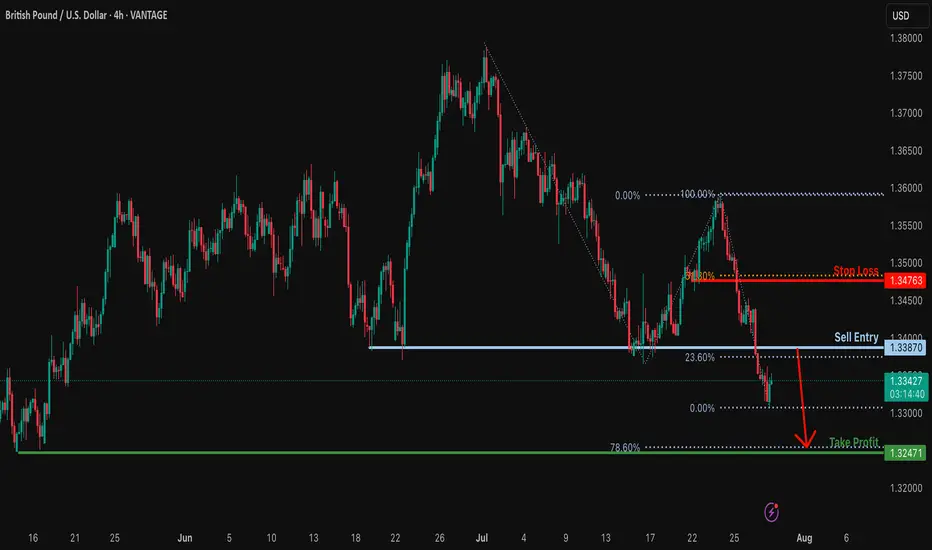
Bearish reversal for the Cable?The price is rising towards the resistance level, which is a pullback resistance that aligns with the 23.6% Fibonacci retracement and could potentially reverse from this level to our take-profit.
Entry: 1.3387
Why we like it:
There is a pullback resistance that lines up with the 23.6% Fibonacci retracement.
Stop loss: 1.3476
Why we like it:
There is a pullback resistance that aligns with the 61.8% Fibonacci retracement.
Take profit: 1.3247
Why we like it:
There is a multi-swing low support that aligns with the 78.6% Fibonacci projection.
Enjoying your TradingView experience? Review us!
TradingView (www.tradingview.com)
Please be advised that the information presented on TradingView is provided to Vantage (‘Vantage Global Limited’, ‘we’) by a third-party provider (‘Everest Fortune Group’). Please be reminded that you are solely responsible for the trading decisions on your account. There is a very high degree of risk involved in trading. Any information and/or content is intended entirely for research, educational and informational purposes only and does not constitute investment or consultation advice or investment strategy. The information is not tailored to the investment needs of any specific person and therefore does not involve a consideration of any of the investment objectives, financial situation or needs of any viewer that may receive it. Kindly also note that past performance is not a reliable indicator of future results. Actual results may differ materially from those anticipated in forward-looking or past performance statements. We assume no liability as to the accuracy or completeness of any of the information and/or content provided herein and the Company cannot be held responsible for any omission, mistake nor for any loss or damage including without limitation to any loss of profit which may arise from reliance on any information supplied by Everest Fortune Group.
GBPUSD
GBPUSD Will Explode! BUY!
My dear friends,
Please, find my technical outlook for GBPUSD below:
The instrument tests an important psychological level 1.3339
Bias - Bullish
Technical Indicators: Supper Trend gives a precise Bullish signal, while Pivot Point HL predicts price changes and potential reversals in the market.
Target - 1.3419
About Used Indicators:
Super-trend indicator is more useful in trending markets where there are clear uptrends and downtrends in price.
Disclosure: I am part of Trade Nation's Influencer program and receive a monthly fee for using their TradingView charts in my analysis.
———————————
WISH YOU ALL LUCK

EUR/USD | Sweeps Liquidity and Rebounds – Eyes on 1.16700!By analyzing the EURUSD chart on the 4-hour timeframe, we can see that after our previous analysis, the price continued its decline and eventually swept the liquidity below 1.15580. Following that, strong demand kicked in, and the pair is currently trading around 1.15810. If the price can hold above this level, we can expect further bullish movement. The next potential targets are 1.1600, 1.16280, 1.16430, and 1.16700.
Please support me with your likes and comments to motivate me to share more analysis with you and share your opinion about the possible trend of this chart with me !
Best Regards , Arman Shaban

GBPUSD H4 I Bullish Rise toward the resistanceBased on the H4 chart analysis, we can see that the price is testing our buy entry at 1.3346, which is an overlap support.
Our take profit will be at 1.3402, which is a pullback resistance level.
The stop loss will be placed at 1.3288, a pullback support.
High Risk Investment Warning
Trading Forex/CFDs on margin carries a high level of risk and may not be suitable for all investors. Leverage can work against you.
Stratos Markets Limited (tradu.com ):
CFDs are complex instruments and come with a high risk of losing money rapidly due to leverage. 65% of retail investor accounts lose money when trading CFDs with this provider. You should consider whether you understand how CFDs work and whether you can afford to take the high risk of losing your money.
Stratos Europe Ltd (tradu.com ):
CFDs are complex instruments and come with a high risk of losing money rapidly due to leverage. 66% of retail investor accounts lose money when trading CFDs with this provider. You should consider whether you understand how CFDs work and whether you can afford to take the high risk of losing your money.
Stratos Global LLC (tradu.com ):
Losses can exceed deposits.
Please be advised that the information presented on TradingView is provided to Tradu (‘Company’, ‘we’) by a third-party provider (‘TFA Global Pte Ltd’). Please be reminded that you are solely responsible for the trading decisions on your account. There is a very high degree of risk involved in trading. Any information and/or content is intended entirely for research, educational and informational purposes only and does not constitute investment or consultation advice or investment strategy. The information is not tailored to the investment needs of any specific person and therefore does not involve a consideration of any of the investment objectives, financial situation or needs of any viewer that may receive it. Kindly also note that past performance is not a reliable indicator of future results. Actual results may differ materially from those anticipated in forward-looking or past performance statements. We assume no liability as to the accuracy or completeness of any of the information and/or content provided herein and the Company cannot be held responsible for any omission, mistake nor for any loss or damage including without limitation to any loss of profit which may arise from reliance on any information supplied by TFA Global Pte Ltd.
The speaker(s) is neither an employee, agent nor representative of Tradu and is therefore acting independently. The opinions given are their own, constitute general market commentary, and do not constitute the opinion or advice of Tradu or any form of personal or investment advice. Tradu neither endorses nor guarantees offerings of third-party speakers, nor is Tradu responsible for the content, veracity or opinions of third-party speakers, presenters or participants.

GBPUSD BUY TIGER SETUP LOOOOOOOOOOOONGwelcome
we have strong mitigation order block on time frame weekly and daily
and on 4H we have break downtrend and retest on it
and we in well discount area
and we have demand on high time frame
so this is good idea for buying
Don't forget to follow me
so that get refresh analysis

GBPUSD Week 31 Swing Zone/LevelsPEPPERSTONE:GBPUSD keeps giving and simply does.
Strategy for this week is highlighted; sell at the zone and look for buy around 33683.
Zones/Levels are calculated based previous Week X's difference High & Low (dHL)
Trade Parameters:
sl: 10-15pips
dTP: dynamic TP means because momentum can push fast past say 33683, TP is a soft target. However typically 5-10x
As always price action determines trades.

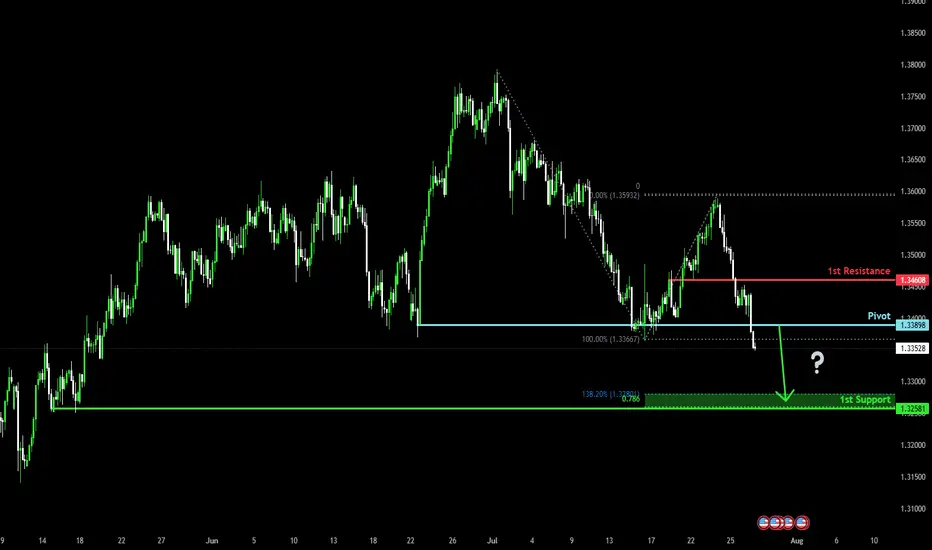
Potential bearish drop?The Cable (GBP/USD) has broken below the support level, which is a multi-swing low support. A potential pullback to the pivot, followed by a rejection, could lead the price to drop to the 1st support.
Pivot: 1.3389
1st Support: 1.3258
1st Resistance: 1.3460
Risk Warning:
Trading Forex and CFDs carries a high level of risk to your capital and you should only trade with money you can afford to lose. Trading Forex and CFDs may not be suitable for all investors, so please ensure that you fully understand the risks involved and seek independent advice if necessary.
Disclaimer:
The above opinions given constitute general market commentary, and do not constitute the opinion or advice of IC Markets or any form of personal or investment advice.
Any opinions, news, research, analyses, prices, other information, or links to third-party sites contained on this website are provided on an "as-is" basis, are intended only to be informative, is not an advice nor a recommendation, nor research, or a record of our trading prices, or an offer of, or solicitation for a transaction in any financial instrument and thus should not be treated as such. The information provided does not involve any specific investment objectives, financial situation and needs of any specific person who may receive it. Please be aware, that past performance is not a reliable indicator of future performance and/or results. Past Performance or Forward-looking scenarios based upon the reasonable beliefs of the third-party provider are not a guarantee of future performance. Actual results may differ materially from those anticipated in forward-looking or past performance statements. IC Markets makes no representation or warranty and assumes no liability as to the accuracy or completeness of the information provided, nor any loss arising from any investment based on a recommendation, forecast or any information supplied by any third-party.
Candle Close July 2025I made a post about a draw to sell side. Objective met today. unexpected for a Monday but all good. We could continue lower but it's likely we get a pull back or consolidation considering this is the last week of the month thus a candle close for July 2025. let's watch. I'm gonna stay out for the rest of the week. toodles

GBP_USD BEARISH BREAKOUT|SHORT|
✅GBP_USD is going down currently
As the pair broke the key structure level of 1.3380
Which is now a resistance, and after the pullback
And retest, I think the price will go further down
SHORT🔥
✅Like and subscribe to never miss a new idea!✅
Disclosure: I am part of Trade Nation's Influencer program and receive a monthly fee for using their TradingView charts in my analysis.

Market Trap Alert! GBP/USD Bearish Robbery Plan🔥💸 "The Cable Heist" – GBP/USD Robbery Plan Using Thief Trading Style 💸🔥
— Unfiltered Forex Forecast with Risky Intentions —
🌍 Hey Money-Makers, Market Hustlers & Chart Bandits! 🤑✈️
Hola! Bonjour! Marhaba! Hallo! Ciao! Welcome to the Forex streets where the smart rob the charts, not banks.
Ready for the GBP/USD Heist? Let’s break it down with our infamous Thief Trading Style – raw, unapologetic, and built for profits.
💼 Operation Name: “The Cable Forex Bank Robbery”
🎯 Pair: GBP/USD – aka “The Cable”
⚔️ Style: Scalp / Day Trade / Swing Heist
📊 Bias: Short (Bearish Setup)
🛠 STRATEGY SETUP: "Follow the Shadows"
🔍 Analysis Basis:
Smart-Money Traps at Key Levels
Oversold ≠ Reversal (Read between the candles)
Liquidity Hunting Zones
Retail Stop Clusters Exposed
Thief-style DCA Entries (Staggered Entry Levels)
Multi-timeframe Confirmation
COT, Sentiment & News-Driven Volatility
🎯 ENTRY ZONE:
Enter short (sell) using 15M or 30M chart.
Sell Limits near recent highs (pullback zone).
DCA (Layered Entry) recommended – Thief loves catching price slipping.
Let the liquidity work for us.
🛑 STOP LOSS (SL):
Base SL around 1.34850 on 4H Chart – above swing high.
Adjust SL per position size and total entries.
Manage risk, but remember: thieves don’t panic, they plan!
🎯 TARGET ZONE:
TP near 1.32500 or adjust using price action.
Escape before target if market mood flips – no need to be greedy.
Trail SLs if market momentum dies down.
👀 Scalpers' Special Note:
Only SHORT — don’t mess with long side unless you’re a liquidity donor.
Quick ins & outs. If you're loaded with capital, jump in big – else follow the swing team.
Use trailing SLs for safety — protect the loot.
📢 FUNDAMENTALS TO WATCH:
News Impacting GBP/USD
COT Reports
Sentiment Indicators
Macro Trends / Yield Spreads
US Dollar Strength Index (DXY)
UK Economic Reports (CPI, GDP, Rate Decisions)
⚠️ RISK MANAGEMENT TIPS:
🚨 Avoid new entries during news releases
🚨 Use trailing stops during volatility spikes
🚨 Secure running trades before major announcements
🚀 Boost the Robbery – Support the Strategy
💖 Smash that BOOST BUTTON if you're vibing with this setup. Help the Thief crew grow stronger!
Let’s keep milking the market 💸 – one “heist” at a time. Stay dangerous, stay smart.
🔓 NOTE: This isn't investment advice. Just a wild trading idea from a chart outlaw.
Always DYOR – Do Your Own Robbery (Research).
Market conditions shift fast. Stay alert, adapt, and respect your capital.
#ForexThiefStyle #CableHeist #GBPUSDShort #SmartMoneyMoves #LiquidityHunters #ChartOutlaws #TradingRebels #DayTradeLife #ScalpersParadise #ForexGang #FXHeistPlans

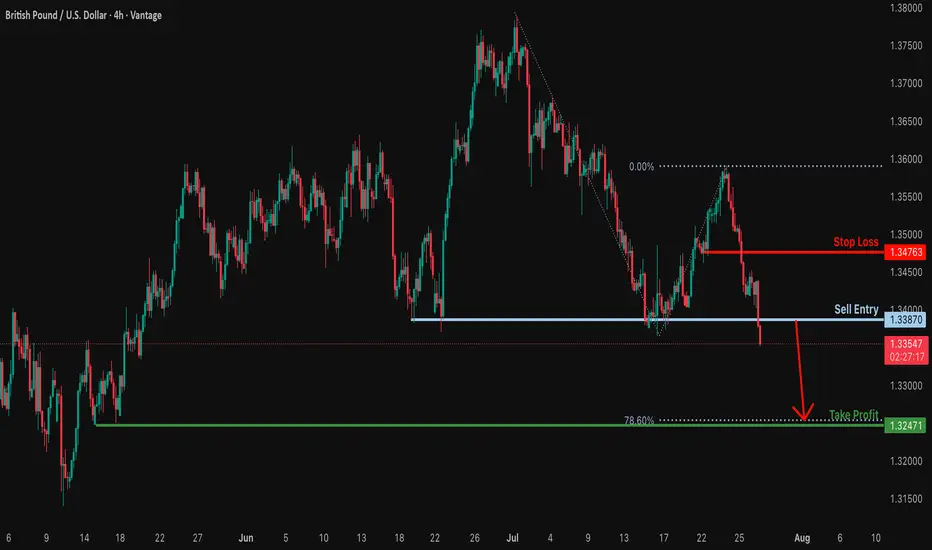
Potential bearish drop?GBP/USD has reacted off the support level which is a multi swing low support and could drop from this levle to our take profit.
Entry: 1.3387
Why we like it:
There is a multi swing low support.
Stop loss: 1.3476
Why we like it:
There is a pullback resistance.
Take profit: 1.3247
Why we like it:
There is a multi swing low support that aligns with the 78.6% Fibonacci projection.
Enjoying your TradingView experience? Review us!
Please be advised that the information presented on TradingView is provided to Vantage (‘Vantage Global Limited’, ‘we’) by a third-party provider (‘Everest Fortune Group’). Please be reminded that you are solely responsible for the trading decisions on your account. There is a very high degree of risk involved in trading. Any information and/or content is intended entirely for research, educational and informational purposes only and does not constitute investment or consultation advice or investment strategy. The information is not tailored to the investment needs of any specific person and therefore does not involve a consideration of any of the investment objectives, financial situation or needs of any viewer that may receive it. Kindly also note that past performance is not a reliable indicator of future results. Actual results may differ materially from those anticipated in forward-looking or past performance statements. We assume no liability as to the accuracy or completeness of any of the information and/or content provided herein and the Company cannot be held responsible for any omission, mistake nor for any loss or damage including without limitation to any loss of profit which may arise from reliance on any information supplied by Everest Fortune Group.

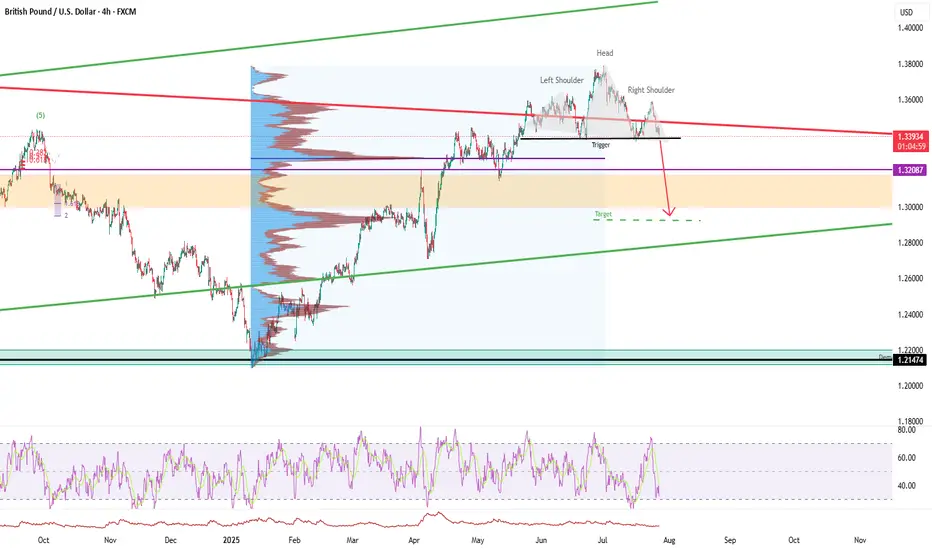
GBPUSD - Head and shoulder Potential break of neck line of H&S .. in this cas we can have a deep retest of support zone
GBPUSD SHORTGBPUSD SHORT | 15s entry | 5m confirmation | 4H bias
Price mitigated 4H supply. Waited for 5M alignment, then dropped to 15s to spot another liquidity grab before entry — doubling the probability.
Caught the shift as 5M structure broke, creating a flip liquidity grab for the zone above and making it even stronger.
That move also left behind a weak low likely to be taken, giving clear reason for lower prices.
Same system. Different pair. Same outcome.
Zero emotion. Just posting what works.

XAU/USD | Gold Holding Strong – Watching for Next Bullish Move!By analyzing the gold chart on the 4-hour timeframe, we can see that yesterday, as expected, when the price dropped to around $3357, it faced strong buying pressure and rallied up to $3377. After that, it corrected again, pulling back to $3338 so far, and is currently trading around $3341. If gold manages to hold above $3337, we can expect another bullish move, with potential targets at $3347, $3354, $3364, and $3374.
Please support me with your likes and comments to motivate me to share more analysis with you and share your opinion about the possible trend of this chart with me !
Best Regards , Arman Shaban

This Chart Screams Breakout – Are You In?AUD/USD – Bullish Setup Brewing
AUD/USD has been respecting this rising channel beautifully, with clean higher highs and higher lows.
Back in April, we saw a classic bear trap, price wicked below support, lured in shorts, and then reversed sharply. That fakeout sparked a strong rally and confirmed demand.
Currently, price is consolidating near the Key Resistance Zone and bouncing off the lower trendline again a sign of strength.
If this pattern continues, we could soon see a breakout above the upper trendline, potentially sending AUD/USD flying toward 0.68+.
Outlook:
As long as the structure holds, dips are for buying. Bulls remain in control.
DYOR, NFA
Thanks for the reading

EUR/USD | Correction Near Key Demand – Watching for Rebound!By analyzing the EURUSD chart on the 4-hour timeframe, we can see that after the last analysis, the price started a correction and is currently trading around 1.17150. I expect that once it enters the 1.16780–1.17100 zone, we could see a rebound from this key demand area. If the price holds above this zone, the next bullish targets will be 1.17370 as the first target and 1.17730 as the second.
Please support me with your likes and comments to motivate me to share more analysis with you and share your opinion about the possible trend of this chart with me !
Best Regards , Arman Shaban

GBP/USD Long Setup: Loot & Escape Before Bears Attack!🏴☠️ GBP/USD HEIST ALERT: "The Cable" Bank Robbery Plan! 💰🚨
Thief Trading Strategy | Swing/Day Trade | High-Risk, High-Reward Loot!
🤑 DEAR MARKET PIRATES & MONEY SNATCHERS!
Based on our 🔥Thief Trading Masterplan🔥, we’re targeting the GBP/USD ("The Cable") for a bullish heist! Police barricades (resistance) are risky, but overbought markets = consolidation = TREND REVERSAL TRAP! Bears are strong here, but smart robbers take profits early!
🎯 Mission: LONG ENTRY + ESCAPE BEFORE THE POLICE (SELLERS) ARRIVE!
🔓 ENTRY: "VAULT IS OPEN!"
📍 Bullish Loot Zone: Swipe longs at any price—but smart thieves use Buy Limits near 15M/30M swing lows for pullback entries!
📍 Pro Thief Move: DCA/Layering strategy (multiple limit orders for max loot).
🛑 STOP LOSS: "DON’T GET CAUGHT!"
📍 SL @ Recent Swing Low (4H): 1.33700 (Adjust based on your risk, lot size, & entry layers!).
📍 Day/Swing Trade? Tighten SL if scalping!
🎯 TARGETS: "LOOT & BOUNCE!"
✅ 1.37700 (Main Heist Target)
✅ Scalpers: Trail SL & escape early!
✅ Swing Bandits: Hold for bigger payout!
📢 THIEF’S FUNDAMENTAL INTEL
Why GBP/USD? Bullish momentum from:
Macro Trends (COT Report, Sentiment, Liquidity Zones)
Intermarket Signals (Stocks, Bonds, Commodities)
News Trap Alerts (Avoid high-impact news chaos!)
🚨 THIEF’S GOLDEN RULES
✔ AVOID NEWS VOLATILITY! (No new trades during releases)
✔ TRAILING SL = SAFE ESCAPE ROUTE! (Lock profits like a pro)
✔ BOOST THIS IDEA! 💥 More boosts = stronger heist crew!
💎 FINAL WARNING
This is a HIGH-RISK heist! Only risk what you can lose.
Market conditions change FAST! Adapt or get caught.
Not advice—just a pirate’s plan! Do your own analysis.
🚀 NEXT HEIST COMING SOON… STAY TUNED, ROBBERS! 🏴☠️💸

GBPUSD LONGTERM BUYWe have H4 BUY range
Followed by SELL range (retracement)
SELL range turn to BUY range.
I expect to buy around 1.3410 (After confirmation = PRICE REJECTION)
TP: 1.3787 (Between there I will have small BUY AND CLOSE trade)

GBPUSD Will Go Lower! Short!
Take a look at our analysis for GBPUSD.
Time Frame: 2h
Current Trend: Bearish
Sentiment: Overbought (based on 7-period RSI)
Forecast: Bearish
The price is testing a key resistance 1.358.
Taking into consideration the current market trend & overbought RSI, chances will be high to see a bearish movement to the downside at least to 1.353 level.
P.S
The term oversold refers to a condition where an asset has traded lower in price and has the potential for a price bounce.
Overbought refers to market scenarios where the instrument is traded considerably higher than its fair value. Overvaluation is caused by market sentiments when there is positive news.
Disclosure: I am part of Trade Nation's Influencer program and receive a monthly fee for using their TradingView charts in my analysis.
Like and subscribe and comment my ideas if you enjoy them!

Fundamental Market Analysis for July 28, 2025 GBPUSDThe pound is sliding to 1.34250, reacting to a fresh slowdown in UK inflation and reduced expectations of further tightening from the Bank of England. The annual CPI for June fell to 2.2%, the lowest since March 2022, allowing the regulator to keep rates unchanged at the August meeting.
Meanwhile, rising Treasury yields intensify capital inflows into dollar assets after a strong US Q2 GDP report (+2.4% q/q). The British economy remains close to stagnation: the services PMI fell to 49.8, indicating shrinking orders and wage pressure.
Political risks also weigh on the pound: the ruling party's parliamentary majority shrank after unscheduled by-elections, complicating the government's implementation of fiscal stimulus. Collectively, this increases the attractiveness of selling the pair ahead of the Fed meeting, where markets price in a possible rate hike by year-end.
Trade recommendation: SELL 1.34250, SL 1.34450, TP 1.33250

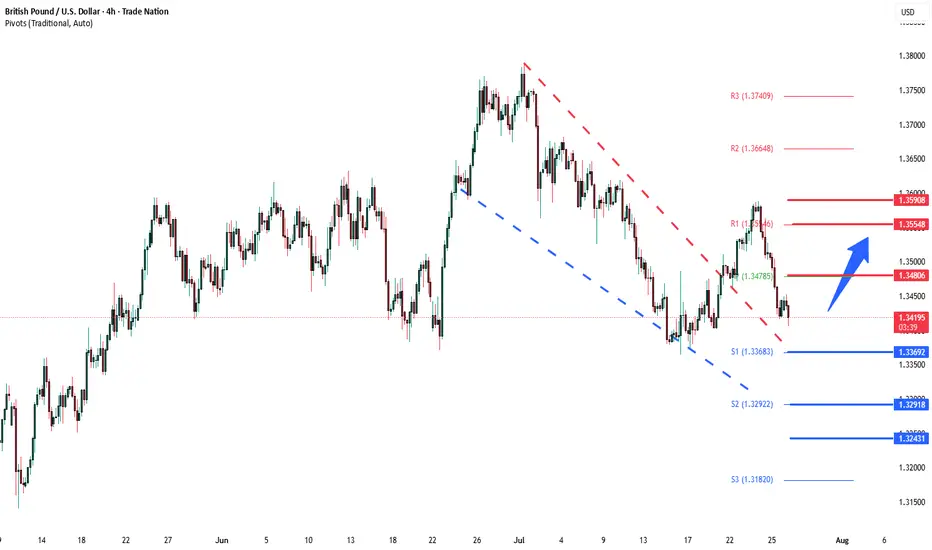
GBPUSD corrective pullback support at 1.3370The GBPUSD remains in a bullish trend, with recent price action showing signs of a corrective pullback within the broader uptrend.
Support Zone: 1.3370 – a key level from previous consolidation. Price is currently testing or approaching this level.
A bullish rebound from 1.3370 would confirm ongoing upside momentum, with potential targets at:
1.3480 – initial resistance
1.3555 – psychological and structural level
1.3590 – extended resistance on the longer-term chart
Bearish Scenario:
A confirmed break and daily close below 1.3370 would weaken the bullish outlook and suggest deeper downside risk toward:
1.3290 – minor support
1.3240 – stronger support and potential demand zone
Outlook:
Bullish bias remains intact while the GBPUSD holds above 1.3370. A sustained break below this level could shift momentum to the downside in the short term.
This communication is for informational purposes only and should not be viewed as any form of recommendation as to a particular course of action or as investment advice. It is not intended as an offer or solicitation for the purchase or sale of any financial instrument or as an official confirmation of any transaction. Opinions, estimates and assumptions expressed herein are made as of the date of this communication and are subject to change without notice. This communication has been prepared based upon information, including market prices, data and other information, believed to be reliable; however, Trade Nation does not warrant its completeness or accuracy. All market prices and market data contained in or attached to this communication are indicative and subject to change without notice.
GBPUSD – DAILY FORECAST Q3 | W31 | D28 | Y25📊 GBPUSD – DAILY FORECAST
Q3 | W31 | D28 | Y25
Daily Forecast 🔍📅
Here’s a short diagnosis of the current chart setup 🧠📈
Higher time frame order blocks have been identified — these are our patient points of interest 🎯🧭.
It’s crucial to wait for a confirmed break of structure 🧱✅ before forming a directional bias.
This keeps us disciplined and aligned with what price action is truly telling us.
📈 Risk Management Protocols
🔑 Core principles:
Max 1% risk per trade
Only execute at pre-identified levels
Use alerts, not emotion
Stick to your RR plan — minimum 1:2
🧠 You’re not paid for how many trades you take, you’re paid for how well you manage risk.
🧠 Weekly FRGNT Insight
"Trade what the market gives, not what your ego wants."
Stay mechanical. Stay focused. Let the probabilities work.
FX:GBPUSD
