DON'T MISS OUT ON GBPUSD SHORTS IN W21 OF Q2 Y25GBPUSD SHORT FORECAST Q2 W21 Y25
DON'T MISS OUT ON GBPUSD SHORTS IN W21 OF Q2 Y25
Professional Risk Managers👋
Welcome back to another FRGNT chart update📈
Diving into some Forex setups using predominantly higher time frame order blocks alongside confirmation breaks of structure.
Let’s see what price action is telling us today!
💡Here are some trade confluences📝
✅Weekly order block rejection
✅Daily order block rejection
✅Intraday 15' order blocks
✅Tokyo ranges to be filled
🔑 Remember, to participate in trading comes always with a degree of risk, therefore as professional risk managers it remains vital that we stick to our risk management plan as well as our trading strategies.
📈The rest, we leave to the balance of probabilities.
💡Fail to plan. Plan to fail.
🏆It has always been that simple.
❤️Good luck with your trading journey, I shall see you at the very top.
🎯Trade consistent, FRGNT X
GBPUSD

GBPUSD Week 21 Swing Zone/LevelsNot Always.
Not always will price conform to hypothesis, but in following good RRR success is assured.
We setup week 21 levels and zone as shown with the predicted pathways.
Trade Parameters: Entry on 5 mins chart
Sl 10-15pips
TP usually dynamic but typically 5x
Follow on for trade updates.
As Always PRICE determines trades

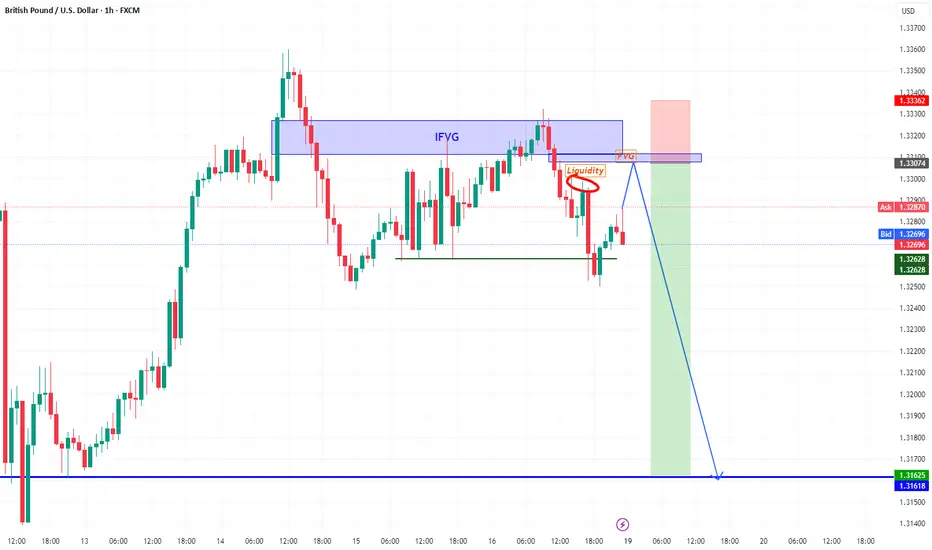
GBPUSD Bearish The main trend is down. The price rebounded from IFVG. We are waiting for a liquidity sweep and rebound from FVG.
Target 1.3162
EurAud..Daily Volume Imbalance fillGood day traders, I’m back with another great idea on EurAud and what I like about this setup, is that we can also learn from it.
On our daily TF we have a clear volume imbalance since price opened on Monday with a gap and it failed to fill the gap last week meaning it might happen this week where price can fill the gap. On the chart I’m showing you the high/low of the volume imbalance but you can add the midpoint of that gap too if you wish to do so. Price tried filling that gap but we can see it failed to do so because price did not even get to the midpoint of the VI, after it touched the lower quarter of the VI, it pushed lower showing weakness in price.
Jumping to the present TF 4H here we can see that we have a bullish flow in price but out structure remain bearish. Going into the new week we wanna see price continue in its original structure to Atleast our first presented FVg that has been noted on the chart. Currently price is inside an inverted FVG which again supports our narrative. We can expect price to fill the 1st.PFVG on Tuesday the latest before it can move higher and for the week we want to see price close above the volume imbalance.

Caught her playin’ both sides but trust me, she’s loyal in sellPrice be flirtin’ with that support — but yo, don’t get cozy, it’s fakin’ love before the real drop hits!”
Breakdown:
Bearish wedge structure
Liquidity grab incoming
Two clean selling zones
Targeting that juicy demand block below
Smart money’s movin’ silent. You ready or you sleepin’ on it?

GBP/USD potential shorts back downMy analysis revolves around a possible bearish reaction from the 2‑hour supply zones. If price does respect these zones, I’ll look for a sell setup to drive price lower—though I’ll approach with caution because there’s liquidity resting just above those points of interest.
Should price push downward, my next target is the 10‑hour demand zone that triggered the recent change of character. This discounted area could spark a bullish response.
Confluences for GU sells are as follows:
- An unmitigated 4‑hour supply zone overhead.
- A “sell‑to‑buy” scenario fits: price sits closer to supply and still needs a retracement.
- Imbalance and untapped liquidity lie below, inviting a move south.
- Liquidity has just been swept above, leaving a clean supply zone behind.
P.S. If price punches through these supply zones and breaks structure to the upside, I’ll watch for the new zone that forms—there could be a nearer‑term long opportunity from there.

BTCUSD…relative equal lowsGood day traders, I’m back with another setup and this time we looking at the cryptocurrency (BTCUSD). This setup up is a short term trade, looking at the 1H TF we can clearly see the equal lows lows and one of lows that make up those relative lows is also our minutes TF’s low.
For the day our narrative is that internal liquidity and we also can expect price to push past that external liquidity. The 2 ray lines make up the volume imbalance that’s once price rebalances we can expect lower price for the rest of the day or maybe even rest of the week.

GBPUSD Technical Analysis! SELL!
My dear followers,
This is my opinion on the GBPUSD next move:
The asset is approaching an important pivot point 1.3290
Bias - Bearish
Technical Indicators: Supper Trend generates a clear short signal while Pivot Point HL is currently determining the overall Bearish trend of the market.
Goal - 1.3252
About Used Indicators:
For more efficient signals, super-trend is used in combination with other indicators like Pivot Points.
Disclosure: I am part of Trade Nation's Influencer program and receive a monthly fee for using their TradingView charts in my analysis.
———————————
WISH YOU ALL LUCK

GBPUSD Holds Rebound Above 1.32On the back of softer U.S. inflation data and stronger-than-expected UK figures (with GDP at 0.2% vs. 0% expected and claimant count change at 5.2k vs. 22.3k), GBPUSD held above 1.32.
Bullish scenario: A clean hold above 1.3350 could push the pair toward 1.3450, with potential for new 2025 highs at 1.3750 and 1.4210, aligning with the highs of 2021.
Bearish scenario: A break below 1.32 may bring support levels at 1.3150, 1.3070, and 1.2980 into view. In extreme cases, 1.27 could be tested, aligning with overbought RSI levels last seen in July 2023 and September 2024, and the long-term trendline from 2014–2021.
Written by Razan Hilal, CMT

GBPUSD(20250516)Today's AnalysisMarket news:
Fed Chairman Powell: The Fed is adjusting its overall policy-making framework. Zero interest rate is no longer a basic situation. The wording of underemployment and average inflation rate needs to be reconsidered. PCE is expected to drop to 2.2% in April.
Technical analysis:
Today's buying and selling boundaries:
1.3291
Support and resistance levels:
1.3356
1.3332
1.3316
1.3267
1.3251
1.3227
Trading strategy:
If the price breaks through 1.3316, consider buying, the first target price is 1.3332
If the price breaks through 1.3291, consider selling, the first target price is 1.3267

GBP/USD 4H Analysis – Bearish Bias in PlayThe market never lies, it simply reflects behaviour. And right now, the behaviour around GBP/USD suggests one thing: bearish momentum.
As seen in this clean 4H chart, price failed to hold above the key horizontal resistance zone and now showing signs of weakness after a retest. I’ve marked a potential bearish projection (red arrow) based on:
Key Technical Factors:
Rejection from a prior structure zone
Clean lower highs forming
Breakdown and retest of minor support
Room below toward - near 1.30300 (next yellow line)
This setup aligns with a potential swing move down toward the next area. If price follows through, we could see a solid continuation to the downside in the coming sessions.
Patience and discipline over prediction. Let price confirm the story it’s telling.

Pound Gains on Strong UK GDPThe British pound climbed to $1.3320 on Friday after strong UK GDP data showed the economy grew 0.7% in Q1 and 1.3% year-over-year, easing pressure on the Bank of England to cut rates aggressively. While a cut is still likely, the solid growth figures suggest urgency has diminished. At the same time, a softer U.S. dollar, driven by speculation that the U.S. may be allowing depreciation to support exports, has supported sterling. However, the UK’s broader outlook remains mixed, with rising unemployment and slowing wage growth signaling uneven momentum.
GBP/USD faces resistance at 1.3350, with additional levels at 1.3450 and 1.3550. Support levels are at 1.3160, 1.3000, and 1.2960.

GU-Fri-16/05/25 TDA-Daily closure above DR for continuation!Analysis done directly on the chart
Follow for more, possible live trade updates!
No structure, harder to get good trades. Sometimes
all you need to do is wait for more clarity, more
structure and let the price and candles indicate
the move.
Not financial advice, DYOR.
Market Flow Strategy
Mister Y

Fundamental Market Analysis for May 16, 2025 GBPUSDU.S. producer prices unexpectedly fell in April as the cost of services fell the most since 2009. The Bureau of Labour Statistics on Thursday released data that the
US Producer Price Index (PPI) rose 2.4 per cent in April, down from 2.7 per cent previously. This figure was weaker than market expectations of 2.5%. In addition, initial jobless claims in the US for the week ending 10 May were 229 thousand, compared to the previous week's 229 thousand (revised from 228 thousand). This value was in line with initial estimates.
Swap markets priced in the first Fed rate cut of 25 basis points (bps) at the September meeting and expect two more rate cuts before the end of the year. Some analysts believe policymakers may wait until December.
Favourable UK Gross Domestic Product (GDP) data suggests the UK's economic health is robust, dampening hopes of aggressive monetary policy easing by the Bank of England (BoE). This, in turn, provides some support for the British pound against the US dollar.
Trading recommendation: BUY 1.3350, SL 1.3250, TP 1.3550

GBPUSD SHORT FORECAST Q2 W20 D16 Y25GBPUSD SHORT FORECAST Q2 W20 D16 Y25
Professional Risk Managers👋
Welcome back to another FRGNT chart update📈
Diving into some Forex setups using predominantly higher time frame order blocks alongside confirmation breaks of structure.
Let’s see what price action is telling us today!
💡Here are some trade confluences📝
✅Weekly order block rejection
✅Daily order block rejection
✅Intraday 15' order blocks
✅Tokyo ranges to be filled
🔑 Remember, to participate in trading comes always with a degree of risk, therefore as professional risk managers it remains vital that we stick to our risk management plan as well as our trading strategies.
📈The rest, we leave to the balance of probabilities.
💡Fail to plan. Plan to fail.
🏆It has always been that simple.
❤️Good luck with your trading journey, I shall see you at the very top.
🎯Trade consistent, FRGNT X

GBPUSD SWING: +1000 Pips Later, GU Is Still Climbing in Stealth 🧠 Last Idea Recap from Early Feb 2025:
- We previously caught a multi-leg upside off the bottom channel (~1.2550) with over 350 pips in structured recovery.
- Price is now grinding within upper consolidation, testing the 1.3315–1.3350 supply shelf.
Note: Check out the previous Idea from related publications to verify.
Update: GBPUSD has now delivered over 1000+ pips in swing structure from the bottom breakout (1.2550s), with even more gains harvested through intra-day and scalp setups inside this multi-week ascending channel.
Recent UK macro strength (GDP beat across MoM, QoQ, YoY) injected new life into price action, adding fundamental confluence to the clean bullish technicals already building. Price continues to respect the rising structure with higher lows and controlled consolidation near a breakout shelf at 1.3350–1.3375.
🔍 Current Structure :
- Bullish flag forming near key supply zone
- No sign of distribution or exhaustion
- Channel still intact, buyers defending every dip
Next Leg:
- Break and hold above 1.3375 could fuel another 100–150 pip run toward 1.3470 and eventually 1.3550+
- Short-term traders: watch for a stop-hunt sweep before the real move
Entry Notes:
- Use lower timeframes (4H/1H) for confirmation wicks, volume spikes, or engulfing candles
- Avoid getting trapped on the first breakout candle—look for retest/reclaim plays
Whether you’re swinging or scalping, this pair has remained one of the cleanest GBP structures in months, and this ride might not be over yet.

GBPUSD: Bullish Order FlowFollowing a decisive move away from the 1.32500 level, GBP/USD has gained bullish traction. This price action has left an unmitigated order block in its wake, which may act as a key area of interest for buyers and could support the continuation of the current upward trend.

GBPUSD: Bearish OverflowWe got this potential Deep Crab Pattern that aligns with FVG on the Daily timeframe. It's possible we'll continue to break structure to the low if the Dollar continues to rises.

Bearish drop?GBP/USD has reacted off the resistance level which is a pullback resistance that aligns with the 61.8% Fibonacci retracement and could drop from this level to our take profit.
Entry: 1.3317
Why we like it:
There is a pullback resistance level that lines up with the 61.8% Fibonacci retracement.
Stop loss: 1.3368
Why we like it:
There is a pullback resistance level.
Take profit: 1.3200
Why we like it:
There is a pullback support level that lines up with the 71% Fibonacci retracement.
Enjoying your TradingView experience? Review us!
Please be advised that the information presented on TradingView is provided to Vantage (‘Vantage Global Limited’, ‘we’) by a third-party provider (‘Everest Fortune Group’). Please be reminded that you are solely responsible for the trading decisions on your account. There is a very high degree of risk involved in trading. Any information and/or content is intended entirely for research, educational and informational purposes only and does not constitute investment or consultation advice or investment strategy. The information is not tailored to the investment needs of any specific person and therefore does not involve a consideration of any of the investment objectives, financial situation or needs of any viewer that may receive it. Kindly also note that past performance is not a reliable indicator of future results. Actual results may differ materially from those anticipated in forward-looking or past performance statements. We assume no liability as to the accuracy or completeness of any of the information and/or content provided herein and the Company cannot be held responsible for any omission, mistake nor for any loss or damage including without limitation to any loss of profit which may arise from reliance on any information supplied by Everest Fortune Group.

USD/JPY : More Bullish Move Ahead ? (READ THE CAPTION)By analyzing the USD/JPY chart on the daily timeframe, we can see that the price moved exactly as expected — first correcting down to the 142.5 area, and then rallying strongly to hit the 146.2 target. Currently, this pair is trading around 145.2, and if the price can hold above 145, we can still expect further upside movement on USDJPY. The next potential targets are 148.7 and 150 respectively. This analysis will be updated. The total return of this analysis so far has been over 720 pips!
Please support me with your likes and comments to motivate me to share more analysis with you and share your opinion about the possible trend of this chart with me !
Best Regards , Arman Shaban

GBPUSD: Bearish Move Confirmed?! 🇬🇧🇺🇸
GBPUSD looks bearish after a release of UK GDP this morning.
I see a strong bearish imbalance after a test of a key horizontal resistance
and a confirmed Change of Character CHoCH as a confirmation.
I expect a bearish continuation at least to 1.3224
❤️Please, support my work with like, thank you!❤️
I am part of Trade Nation's Influencer program and receive a monthly fee for using their TradingView charts in my analysis.

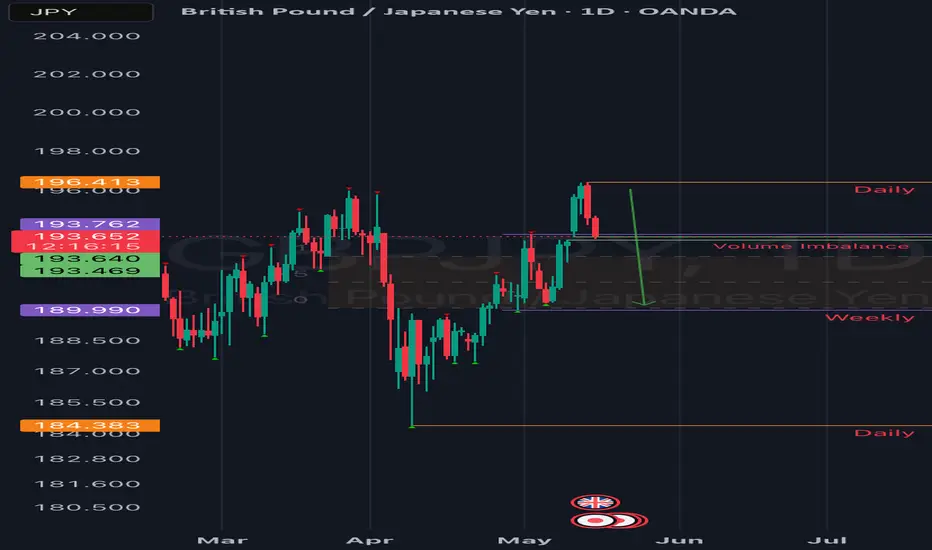
GBPJPY( British pound my banker!)Good day traders, I’m back with another idea on GbPJPY but this one is based on the strength and weakness of the pound itself. Before you ask what I mean…on this respective TF we had a break of structure higher(strength) but we saw price immediately move lower showing some weakness in price.
For the rest of the London session we can expect price to move higher on that volume imbalance to start the New York session. The rectangle is a balanced price range.
GBPUSD INTRADAY sideways consolidation support at 1.3200The GBP/USD pair continues to exhibit a bullish longer-term trend, underpinned by a series of higher highs and higher lows. However, recent price action shows consolidation within a sideways trading range, suggesting a pause or potential accumulation before the next directional move.
The key technical level to monitor is 1.3200, which aligns with a prior consolidation zone and serves as a critical support area. A corrective pullback towards this level could present a buying opportunity, particularly if price action forms a bullish reversal pattern around this zone. A successful rebound from 1.3200 would likely target resistance levels at 1.3400, followed by 1.3445 and 1.3500 on a longer-term basis.
Conversely, a daily close below 1.3200 would invalidate the current bullish bias and suggest a shift in sentiment. This scenario opens the door for further downside towards the next support at 1.3160, with extended losses potentially reaching 1.3116.
Conclusion:
While the broader trend remains bullish, GBP/USD is currently range-bound. Traders should watch for a reaction around the 1.3200 level. A bounce would reinforce bullish momentum towards 1.3400 and beyond, whereas a confirmed break below this level would signal further weakness and a possible trend shift in the near term.
This communication is for informational purposes only and should not be viewed as any form of recommendation as to a particular course of action or as investment advice. It is not intended as an offer or solicitation for the purchase or sale of any financial instrument or as an official confirmation of any transaction. Opinions, estimates and assumptions expressed herein are made as of the date of this communication and are subject to change without notice. This communication has been prepared based upon information, including market prices, data and other information, believed to be reliable; however, Trade Nation does not warrant its completeness or accuracy. All market prices and market data contained in or attached to this communication are indicative and subject to change without notice.
