Will GBP/USD head lower from THIS major resistance zone?Sterling finds itself walking a financial tightrope this week. The GBP/USD is delicately poised between transatlantic central bank decisions and murky trade headlines. As the Federal Reserve holds court across the pond and the Bank of England gets ready to show its hand, traders are bracing for a possible divergence in tone—and in policy. The dollar has taken a softer step into the week, retreating after two weeks of modest gains. But don't be fooled: that weakness could easily reverse if the Trump administration’s trade negotiations result in new agreements. Officials suggest deals with partners beyond China might be inked by week's end. Until then, the markets remain unimpressed. Friday’s US nonfarm payrolls came and went with little fanfare, and Monday’s ISM services PMI barely registered. So far, the macroeconomic data has taken a backseat to geopolitical posturing.
Trade Truce Could Revive the Dollar’s Fortunes
The dollar index has wobbled a little after a brief two-week recovery, helped by an unwind of previous “Sell America” trade. But the big question remains: will Washington and Beijing finally bury the hatchet? Equity markets are behaving as if they expect some form of resolution—however vague—but the greenback hasn't followed suit. Fed independence is also under the microscope, with President Trump’s persistent rate-cut rhetoric raising eyebrows. The political fog isn't helping matters. Yet, a trade breakthrough—particularly with China—could lend support to the dollar, shifting sentiment swiftly.
Sterling's Fate Hinges on Central Bank Theatre
Two heavyweight monetary policy announcements are set to dominate fate for the GBP/USD currency pair over the next 24 hours or so.
• FOMC Rate Decision – Wednesday, 7 May, 19:00 BST
No surprises expected here. The Fed is widely tipped to hold rates steady at 4.25–4.50%. The real drama lies in the messaging. With political noise in the background, Powell may aim to exude calm and control. Markets will scour the statement for hints of June’s outlook.
• Bank of England Rate Decision – Thursday, 8 May, 12:00 BST
Here’s where the action really lies for sterling. A 25bp cut is largely priced in, and a dovish 9-0 vote wouldn’t shock anyone. But traders will pay close attention to the inflation outlook—especially with energy prices softening. A slightly more optimistic growth revision could temper the dovishness. Any hint of hawkish resistance may offer the pound a temporary reprieve, perhaps even lifting GBP/USD to flirt with 1.3500.
Technical Outlook: Cable Bumps Up Against Familiar Ceiling
Technically speaking, GBP/USD is looking a bit overextended, though bears haven’t been vindicated just yet. Last week’s weekly chart printed an inverted hammer—a warning shot, perhaps, but without any firm follow-through so far.
The pair recently tested September’s high at 1.3434 before retreating. But more formidable resistance lurks between 1.35 and 1.40—a zone that’s proved impenetrable since the Brexit saga began. So, the path upward may be limited from here on.
On the downside, keep an eye on 1.3250 for initial support, followed by the psychological barrier at 1.3000.
Final Word
It’s shaping up to be a pivotal week for cable. Trade chatter has failed to energise the dollar, while sterling stands on the edge, waiting for the Bank of England’s cue. With Powell and Bailey both stepping into the spotlight, and global trade deals waiting in the wings, this week could deliver the jolt that the GBP/USD has been waiting for. For now, a cautious stance on sterling feels justified—but everything’s in play, and sentiment may turn quickly.
By Fawad Razaqzada, market analyst with FOREX.com
GBPUSD

Morning Star To Wake GU TradersFX:GBPUSD has fallen into a Wedge Pattern after breaking Mondays Highs!
Price this morning has seemingly found Support at the 50% Retracement level signaling the potential ending of the Consolidation phase of the Wedge!
This Retracement comes in the form of a Morning Star, a strong Triple Candle Reversal Pattern!
If Price is supported in this area, we could see a Bullish Break to this Pattern delivering a Long Opportunities as a Break and Retest Set-up!

GBPUSD INTRADAY consolidation range supported at 1.3210GBP/USD maintains a bullish bias, with the broader trend and structure supporting upside continuation. The recent intraday move appears to be an overbought corrective pullback toward a key prior consolidation area.
Key Support: 1.3210 – aligns with the previous consolidation zone and potential bullish inflection point.
Upside Targets:
1.3435 – initial resistance level
1.3500 and 1.3580 – medium to long-term bullish targets
If price finds support at 1.3210 and forms a bullish reversal, it would confirm the continuation of the uptrend toward the mentioned resistance levels.
However, a break and daily close below 1.3210 would invalidate the bullish scenario, suggesting deeper retracement toward 1.3120, with further support at 1.3015 and 1.2980.
Conclusion
GBP/USD remains bullish above 1.3210. Look for a bounce from this level to confirm upside continuation. A daily close below 1.3210 would turn the outlook bearish, exposing lower support levels.
This communication is for informational purposes only and should not be viewed as any form of recommendation as to a particular course of action or as investment advice. It is not intended as an offer or solicitation for the purchase or sale of any financial instrument or as an official confirmation of any transaction. Opinions, estimates and assumptions expressed herein are made as of the date of this communication and are subject to change without notice. This communication has been prepared based upon information, including market prices, data and other information, believed to be reliable; however, Trade Nation does not warrant its completeness or accuracy. All market prices and market data contained in or attached to this communication are indicative and subject to change without notice.

Cable H1 | Falling toward an overlap supportCable (GBP/USD) is falling towards an overlap support and could potentially bounce off this level to climb higher.
Buy entry is at 1.3338 which is an overlap support that aligns close to the 50.0% Fibonacci retracement.
Stop loss is at 1.3300 which is a level that lies underneath a swing-low support and the 61.8% Fibonacci retracement.
Take profit is at 1.3378 which is a swing-high resistance.
High Risk Investment Warning
Trading Forex/CFDs on margin carries a high level of risk and may not be suitable for all investors. Leverage can work against you.
Stratos Markets Limited (tradu.com):
CFDs are complex instruments and come with a high risk of losing money rapidly due to leverage. 63% of retail investor accounts lose money when trading CFDs with this provider. You should consider whether you understand how CFDs work and whether you can afford to take the high risk of losing your money.
Stratos Europe Ltd (tradu.com):
CFDs are complex instruments and come with a high risk of losing money rapidly due to leverage. 63% of retail investor accounts lose money when trading CFDs with this provider. You should consider whether you understand how CFDs work and whether you can afford to take the high risk of losing your money.
Stratos Global LLC (tradu.com):
Losses can exceed deposits.
Please be advised that the information presented on TradingView is provided to Tradu (‘Company’, ‘we’) by a third-party provider (‘TFA Global Pte Ltd’). Please be reminded that you are solely responsible for the trading decisions on your account. There is a very high degree of risk involved in trading. Any information and/or content is intended entirely for research, educational and informational purposes only and does not constitute investment or consultation advice or investment strategy. The information is not tailored to the investment needs of any specific person and therefore does not involve a consideration of any of the investment objectives, financial situation or needs of any viewer that may receive it. Kindly also note that past performance is not a reliable indicator of future results. Actual results may differ materially from those anticipated in forward-looking or past performance statements. We assume no liability as to the accuracy or completeness of any of the information and/or content provided herein and the Company cannot be held responsible for any omission, mistake nor for any loss or damage including without limitation to any loss of profit which may arise from reliance on any information supplied by TFA Global Pte Ltd.
The speaker(s) is neither an employee, agent nor representative of Tradu and is therefore acting independently. The opinions given are their own, constitute general market commentary, and do not constitute the opinion or advice of Tradu or any form of personal or investment advice. Tradu neither endorses nor guarantees offerings of third-party speakers, nor is Tradu responsible for the content, veracity or opinions of third-party speakers, presenters or participants.

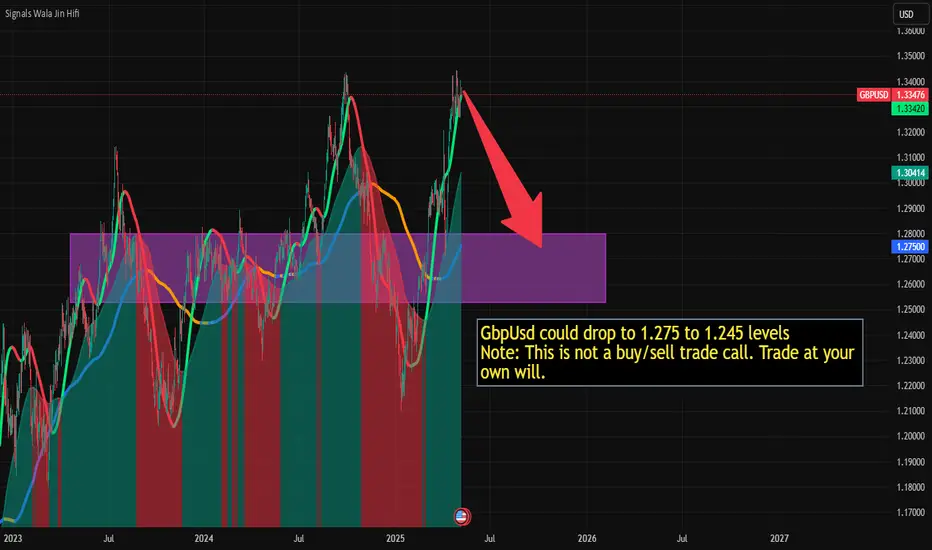
GbpUsd could drop to 1.275 to 1.245 levelsGbpUsd could drop to 1.275 to 1.245 levels
Note: This is not a buy/sell trade call. Trade at your own will.
gbpusd 2025-5-7today we have little level to trade in the gbpusd .
on top we have pdh and on bottom we have pdl.
buy in case we have 50% of previous leg , on top of this level we can find sell view and bottom of this level buy view . remeber if you entry in 1 min find position in 3min

GU-Wed-7/05/25 TDA-CME group probability 95.6% unchanged rate!Analysis done directly on the chart
Here's the link for CME group FedWatch probability:
www.cmegroup.com
Not financial advice, DYOR.
Market Flow Strategy
Mister Y

GBP/USD: Is the Bullish Impulse Over?The daily chart shows a significant bullish impulse that encountered strong resistance in the 1.3350 - 1.3400 area, where multiple supply levels and an important institutional selling zone are located. The bearish structure remains intact below this level, suggesting a potential decline towards the key support at 1.3100 - 1.3150. The short bias strengthens with the confirmation of resistance and the formation of a potential reversal.
COT Report (USD Index and GBP/USD)
USD Index: Non-commercial traders are slightly increasing long positions (+397) while reducing short positions (-128). This suggests a potential recovery of dollar strength, supporting a bearish move on GBP/USD.
GBP/USD: Non-commercials have significantly increased short positions (+6,426) and reduced long positions (-2,957), indicating a bearish sentiment. Commercials also show a slight increase in short positions (+5,070), confirming potential weakness in the pound.
Retail Sentiment
57% of retail traders are short on GBP/USD, with an average price of 1.2916, while 43% are long at 1.3343. This imbalance could indicate a market attempt to capture stops above recent highs before a reversal.
Seasonality
Historically, the month of May shows a negative performance for GBP/USD. The 5, 10, and 15-year seasonal data indicate a consistent decline during this period, supporting the hypothesis of bearish pressure.

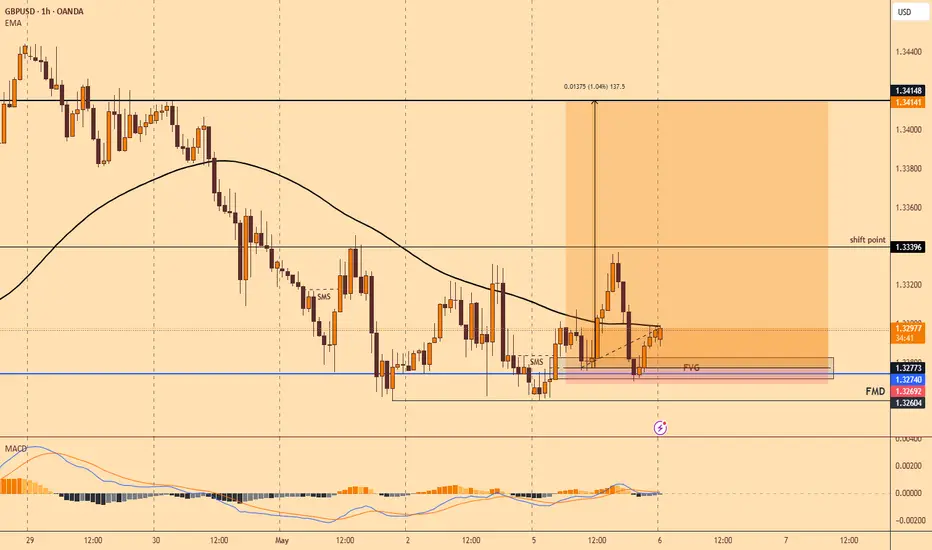
GbpAud now the “buyers” are within!Good day traders, we back with GBPAUD but before I go into it. Last week I took loss because I was buying GBPAUD but I lately found out I was way too early and my narrative has not changed at all.
1D- Daily TF we have a bearish structure and we know that once price shifts structure we want price to retest Atleast till the 0.705 of the OTE fib level to later continue to the Sellside liquidity.
4H- On this respective TF we are also in a bearish structure but I believe not for long because on the lower TF the shift higher has materialised, giving confirmation that we can start positioning ourselves for the up movement.
1H- ICT has a entry model(F.PFVG), on the hourly we saw prices giving back all of yesterday’s gains till it reach that level of first presented FVG and that’s what we gonna use as the level of interest.

XAU/USD: Gold Eyes $3400+ After Explosive Surge! (READ CAPTION)By analyzing the gold chart on the 1-hour timeframe, we can see that price once again hit our targets! As expected, gold had a strong bullish rally yesterday and today, reaching both $3328 and $3345, and even extending to $3387.
This surge was fueled by escalating tensions in the Middle East, particularly between Israel and Yemen. Since the conflict shows no signs of easing and further threats remain on the table, I believe gold is not done yet — we may soon see it push above $3400.
These are sensitive days, so please be extra cautious with your trades. Don’t let fear or greed take over — consistency and emotional stability are key to long-term success in this market.
I’ll continue posting more frequent updates to help you stay informed — but that depends on your strong support! Let’s keep growing together!
Please support me with your likes and comments to motivate me to share more analysis with you and share your opinion about the possible trend of this chart with me !
Best Regards , Arman Shaban

Bullish bounce off 50% Fibonacci support?GBP/USD is falling towards the support level which is a pullback support that aligns with the 50% Fibonacci retracement and could bounce from this level to our take profit.
Entry: 1.3336
Why we like it:
There is a pullback support that line sup with the 50% Fibonacci retracement.
Stop loss: 1.3296
Why we like it:
There is an overlap support level that lines up with the 78.6% Fibonacci retracement.
Take profit: 1.3419
Why we like it:
There is a pullback resistance.
Enjoying your TradingView experience? Review us!
Please be advised that the information presented on TradingView is provided to Vantage (‘Vantage Global Limited’, ‘we’) by a third-party provider (‘Everest Fortune Group’). Please be reminded that you are solely responsible for the trading decisions on your account. There is a very high degree of risk involved in trading. Any information and/or content is intended entirely for research, educational and informational purposes only and does not constitute investment or consultation advice or investment strategy. The information is not tailored to the investment needs of any specific person and therefore does not involve a consideration of any of the investment objectives, financial situation or needs of any viewer that may receive it. Kindly also note that past performance is not a reliable indicator of future results. Actual results may differ materially from those anticipated in forward-looking or past performance statements. We assume no liability as to the accuracy or completeness of any of the information and/or content provided herein and the Company cannot be held responsible for any omission, mistake nor for any loss or damage including without limitation to any loss of profit which may arise from reliance on any information supplied by Everest Fortune Group.

GBPUSD BIG MOVE COMING?Structure Overview:
The market has been ranging within a clear horizontal consolidation zone, with two key zones:
Support Zone: 1.32600 - 1.33000 (gray box at the bottom)
Resistance Zone : 1.33500 - 1.33800 (gray box at the top)
Price recently broke above the upper consolidation range, suggesting bullish momentum.
🔍 Analysis:
The pair has broken out of the consolidation range after multiple rejections from the support zone.
We now look for a potential retest of the previous resistance (1.33500 area) as new support.
Two potential bullish continuation scenarios are highlighted:
📌 Trade Plan:
Scenario 1 – Immediate Continuation:
If price holds above 1.33500, look for bullish continuation toward:
TP1: 1.34026
TP2: 1.34208
Scenario 2 – Retest Setup:
Wait for a pullback to the 1.33000–1.33500 zone.
Confirmation of bullish rejection (e.g., bullish engulfing or pin bar) could provide a high-probability long setup.
Entry: After bullish confirmation in retest zone
SL: Below 1.33000 (invalidates breakout)
TP: 1.34026 / 1.34208
📉 Invalidations:
A clean break and close below 1.33000 may suggest a failed breakout, putting 1.32600 back into play.
🧠 Bias: Bullish (as long as 1.33000 holds)
🕒 Timeframe: 4H

2 out of 2? gBPcAd..iT’s tIMe yET?1D- Daily timeframe we saw price break structure lower but after the break price did not move lower in fact we saw it retracing.
4H- Here price agreed with the daily by breaking structure higher to go take the liquidity(Internal) resting higher, if we take a closer look at the leg that broke structure higher we can than identify imbalances in price and as ICT mentions price looks for two things 1. liquidity and 2. Imbalances. Right now our focus is price balancing before going for the buyside.

GBPUSD Sell Insight Last week cleared the previous week's high 1.34232 and closed below it.
This signifies more push to the downside from the weekly perspectives
I'm anticipating the previous weekly low to be the first draw on Liquidity 🧲
On the daily timeframe we have a break of structure from 1.33044 to the downside and the QML level 1.33784 whic6also aligns within an imbalance on the H4 would be used for sell continuation after the short reversal that happens.
Look for entry on the H4 and sell to the draw on Liquidity zone
Kindly share if you find this insightful.
It's been a while here. I'm more active on X (Twitter) now

GBPUSD BULLISH OR BEARISH DETAILED ANALYSISGBPUSD is currently trading around 1.33400 and is displaying a promising bullish setup. The price action is coiling within a symmetrical triangle, which typically signals a potential breakout. A clear bullish structure has already formed following the recent impulse wave, and with the consolidation tightening, we are now closely watching for a breakout to the upside. The expected bullish breakout aligns with the projected target of 1.36000, offering a strong risk-reward opportunity for trend-following traders.
From a fundamental standpoint, the British pound is showing resilience despite broader dollar strength. Recent comments from the Bank of England have maintained a cautious yet firm tone regarding inflation control, hinting at the potential for rates to stay elevated longer than markets previously priced in. Meanwhile, the U.S. dollar index has seen some pressure amid mixed economic data and increasing speculation that the Federal Reserve may hold rates steady in the upcoming sessions.
Technically, GBPUSD remains well-supported above the 1.32500 level, with buyers defending key horizontal and trendline support areas. The recent compression in price suggests that volatility is about to expand, typically favoring the direction of the initial trend, which in this case remains bullish. Momentum indicators are beginning to curl higher, further supporting a breakout scenario.
In summary, GBPUSD is setting up for a high-probability bullish continuation. A confirmed breakout from the triangle could ignite a fresh rally toward 1.36000, especially if supported by dovish Fed rhetoric and firm UK economic sentiment. This setup is one to watch closely as it aligns both technically and fundamentally, positioning it as a favorable opportunity for medium-term swing trades.

Usdcad PWL?!Good day traders, we back with USDCAD on the 4h TF. Well for this setup I am looking for price to take out out previous week low, previous week we had a candle stick pattern recognition after we saw price move lower but failing to close lower told a different story that price is not yet ready to start moving higher which honestly speaking was my bias last week. For the rest of the day I believe we can expect lower prices to close the day.

XAUUSD Bullish or bearish Detailed AnalysisXAUUSD is currently trading around 3380, continuing its bullish momentum as previously anticipated. The price action has followed the projected path, delivering substantial profits for those positioned early. The next key resistance level is at 3450, aligning with the upper boundary of the ascending channel.
Fundamentally, gold's rally is supported by heightened safe-haven demand amid ongoing geopolitical tensions and a weakening U.S. dollar. Investors are closely watching the upcoming Federal Reserve meeting, with expectations leaning toward a dovish stance, which could further bolster gold prices .
Technical indicators suggest that the bullish trend remains intact, with the price maintaining its position above key moving averages. However, traders should be cautious of potential pullbacks as the market approaches overbought conditions.
In summary, XAUUSD is on track toward the 3450 target, supported by both technical and fundamental factors. Traders should monitor key resistance levels and macroeconomic developments to manage their positions effectively.

GBP Falls Ahead of Fed and BOE MeetingsSterling fell 0.24% to $1.3265 on Tuesday as the U.S. dollar firmed ahead of the Federal Reserve’s policy decision, with rates expected to remain unchanged. While the dollar recovered slightly, doubts over its safe-haven appeal and Trump’s tariff stance persist. Markets also await the Bank of England’s meeting, where a 25 bps rate cut is expected. Dovish signals or dollar softness may support GBP/USD.
If GBP/USD breaks above 1.3430, the next resistance levels are 1.3500 and 1.3550. Support levels are at 1.3200, followed by 1.3050 and 1.2960.

Bearish Shark Pattern with a Massive Profit FactorThis is how trading should be done . I've just spotted a Bearish Shark Pattern on the Weekly Chart and while it's not perfect, it's still a great trade worth keeping on the radar. The market has been hovering around the entry price for weeks, which tells me something is brewing.
The Smart Approach:
Now, I’m not entering based on the Weekly Chart alone , that would require a stop-loss that’s way too wide. Instead, I look for an execution timeframe within three levels down. That means the lowest timeframe I’d engage from this setup is the 4-hourly chart .
But here’s the twist...
The Trade Setup:
I spotted another Bearish Shark Pattern on the 15-minute chart.
What did I do?
> I traded what I saw. Simple as that.
It’s not always about having the "perfect" timeframe. It’s about:
Seeing a valid setup
Knowing your structure
And having a clear trade management plan.
Key Rule:
Once the market reaches a certain level, I’ll shift my stop to entry, securing a risk-free trade. That’s always the goal.
Golden Rule in Trading: “Don’t lose your capital.”
The Reward:
If this trade hits my final target, I’ll walk away with a Profit Factor of 27.45 .
That means for every dollar I risk, the projected return is $27.45. Let that sink in.
So now the question is - how much of your equity would you be risking on a trade like this? Would you go big, or stick to your usual risk percentage?
Let me know in the comments, how would you manage this kind of high-reward setup?
Stay sharp and happy trading, everyone! 🚀

GU-Tue-6/05/25 TDA-Tomorrow's Fed rate decision!Analysis done directly on the chart
Patience is key. Even when you're not
in a trade, have you ever asked why
price moved this way rather than other
ways at this specific time and period?
Knowing when not to trade or lower your
risks is as important as when you're placing
a trade simply because it can save you from
bad losses, mistakes.
Not financial advice, DYOR.
Market Flow Strategy
Mister Y

gbpusd 2025-5-6some level in the chart shows we can trade on this day .
on top fvg 1h , pdh . when price go up and reach to this level we wait to see sell setup then trade .
on bottom fvg 1h , pdl . when price go down and reach to this level we wait to see buy setup then trade .

Bullish ScenarioH4 is bullish and on the m15 TF it made a shift is structure then a pullback to a FVG now we are expecting a rise in price up.
GBPUSD: Bearish Continuation is Highly Probable! Here is Why:
The analysis of the GBPUSD chart clearly shows us that the pair is finally about to tank due to the rising pressure from the sellers.
Disclosure: I am part of Trade Nation's Influencer program and receive a monthly fee for using their TradingView charts in my analysis.
❤️ Please, support our work with like & comment! ❤️
