GBPUSD short to Asia's lowGBPUSD is showing bearish sentiment. We are in a downtrend for a few days now. It may reverse today with the news but until then my bias is bearish. I am taking a short to Asian session's low. Let's see if it play's out.
I normally don't like to go against the higher timeframe trend, especially in a possible reversal zone. So if you take the same trade, use less risk.
Once the market shows signs of reversal, we can ride it back up.
GBPUSD

GBPUSD long to last day's highGBPUSD is showing signs of reversal. The bias for me for today is bullish. It experienced a retracement to the current level and is now showing bullish candles and rejections from the liquidity area. I am targeting yesterday's highs but it could go way higher than that with NFP.
Leave your thoughts in the comments.

GBP Gains as Tariff Risk Stays LowThe British pound rose to $1.332, near its highest level since February 2022, supported by a weaker U.S. dollar. Sterling gained 3.2% in April, its best month since November 2023. The UK is seen as less exposed to U.S. tariffs, which President Trump has delayed until July. In 2024, the U.S. ran a $12 billion goods surplus with the UK, unlike its deficits with China and the EU, reducing trade risk. The pound also benefits from expectations that the Bank of England will be more cautious than others in cutting rates. Markets expect about 85 basis points of easing this year, which is in line with the Fed. Investors now await key U.S. jobs and inflation data for dollar direction.
If GBP/USD breaks above 1.3430, the next resistance levels are 1.3500 and 1.3550. Support levels are at 1.3200, followed by 1.3050 and 1.2960.

GU-Fri-2/05/25 TDA-NFP day, mini downtrendAnalysis done directly on the chart
We are creating new lower structure towards
daily support. What's your view on the market?
Comment down below!
Not financial advice, DYOR.
Market Flow Strategy
Mister Y

GBPUSD H4 I Reversal Off 61.8% FiboBased on the H4 chart analysis, we can see that the price is rising toward our sell entry at 1.3361, which is a pullback resistance aligning with the 61.8% Fibo retracement.
Our take profit will be at 1.3207, a pullback support level.
The stop loss will be placed at 1.3443, a swing-high resistance level.
High Risk Investment Warning
Trading Forex/CFDs on margin carries a high level of risk and may not be suitable for all investors. Leverage can work against you.
Stratos Markets Limited (tradu.com/uk):
CFDs are complex instruments and come with a high risk of losing money rapidly due to leverage. 63% of retail investor accounts lose money when trading CFDs with this provider. You should consider whether you understand how CFDs work and whether you can afford to take the high risk of losing your money.
Stratos Europe Ltd (tradu.com/eu):
CFDs are complex instruments and come with a high risk of losing money rapidly due to leverage. 63% of retail investor accounts lose money when trading CFDs with this provider. You should consider whether you understand how CFDs work and whether you can afford to take the high risk of losing your money.
Stratos Global LLC (tradu.com/en):
Losses can exceed deposits.
Please be advised that the information presented on TradingView is provided to Tradu (‘Company’, ‘we’) by a third-party provider (‘TFA Global Pte Ltd’). Please be reminded that you are solely responsible for the trading decisions on your account. There is a very high degree of risk involved in trading. Any information and/or content is intended entirely for research, educational and informational purposes only and does not constitute investment or consultation advice or investment strategy. The information is not tailored to the investment needs of any specific person and therefore does not involve a consideration of any of the investment objectives, financial situation or needs of any viewer that may receive it. Kindly also note that past performance is not a reliable indicator of future results. Actual results may differ materially from those anticipated in forward-looking or past performance statements. We assume no liability as to the accuracy or completeness of any of the information and/or content provided herein and the Company cannot be held responsible for any omission, mistake nor for any loss or damage including without limitation to any loss of profit which may arise from reliance on any information supplied by TFA Global Pte Ltd.
The speaker(s) is neither an employee, agent nor representative of Tradu and is therefore acting independently. The opinions given are their own, constitute general market commentary, and do not constitute the opinion or advice of Tradu or any form of personal or investment advice. Tradu neither endorses nor guarantees offerings of third-party speakers, nor is Tradu responsible for the content, veracity or opinions of third-party speakers, presenters or participants.

USD/JPY : Get Ready for another Rally! (READ THE CAPTION)By analyzing the USD/JPY chart on the daily timeframe, we can see that, as expected, the price has finally started to rise. So far, it has successfully reached the 143.5 and 144 targets, and extended up to 145.76, delivering a solid 350-pip move.
The main analysis remains valid, and I expect the price to hit the next target at 146.2 soon.
The total gain from this setup has now exceeded 570 pips, and the key upcoming supply zones are at 146.2, 148.7, and 150.
This analysis will be updated accordingly!
THE MAIN ANALYSIS :
Please support me with your likes and comments to motivate me to share more analysis with you and share your opinion about the possible trend of this chart with me !
Best Regards , Arman Shaban

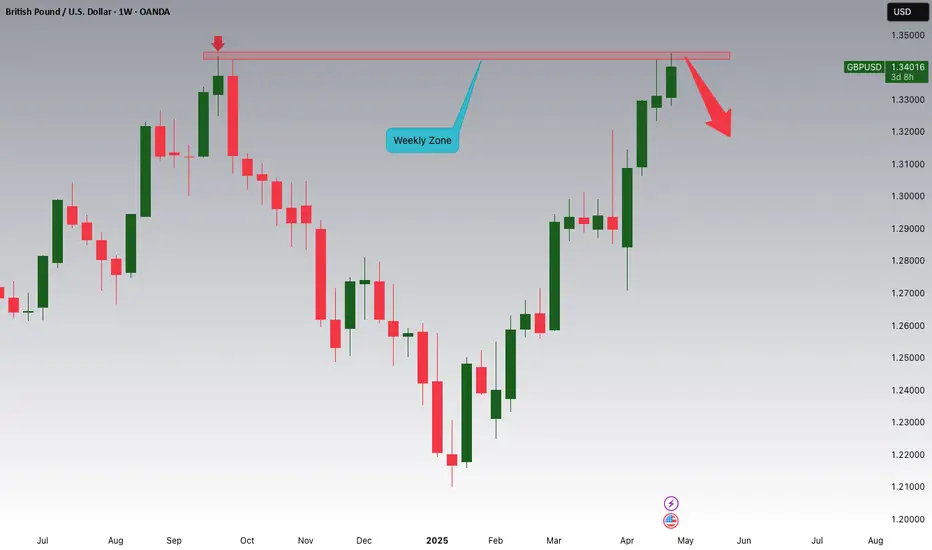
GBPUSD is Forming a Weekly Double Top!!!Hey Traders!
In today's session, we're closely watching GBPUSD for a potential short setup around the 1.34200 level.
The pair is currently forming a double top pattern on the weekly timeframe, a classic reversal signal. Price action is showing signs of rejection at the neckline, suggesting possible downside momentum from this key resistance zone.
Trade safe, Joe.
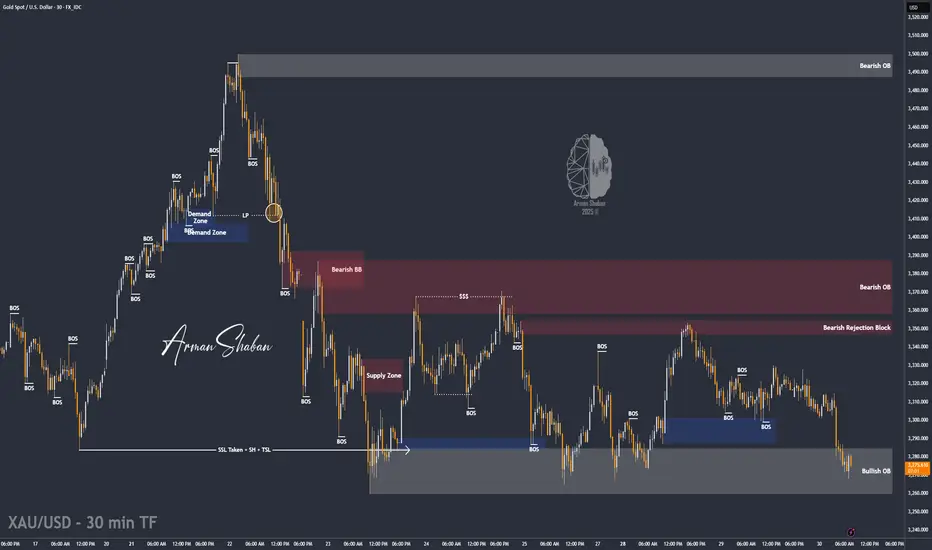
XAU/USD: High Volatility is Expected! (READ THE CAPTION)By analyzing the gold chart on the 30-minute timeframe, we can see that, as expected, the price began rising from the $3310 zone yesterday and reached $3330, delivering a 200-pip gain.
After that, selling pressure took over, and gold is now trading around $3277. Given the current market structure and today's important news events, I expect high volatility in both bullish and bearish directions.
One of the key liquidity pools likely to be targeted today lies below $3259, and before any potential drop, we may see the liquidity gap between $3288 and $3303 being filled.
Please support me with your likes and comments to motivate me to share more analysis with you and share your opinion about the possible trend of this chart with me !
Best Regards , Arman Shaban

Short-Term Outlook for GBPUSD Turns BearishGBPUSD formed and then broke an ascending wedge formation. The dollar appears to be gaining modest ground against key currencies globally.
Hessent noted that tariff-related news is expected by the end of today. If the incoming update involves a trade deal with a major partner like Japan, it could further support the bearish technical outlook.
If the retest of the 200-hour SMA and the broken wedge’s lower boundary fails, GBPUSD may extend its losses toward the 1.3230 level later this week.

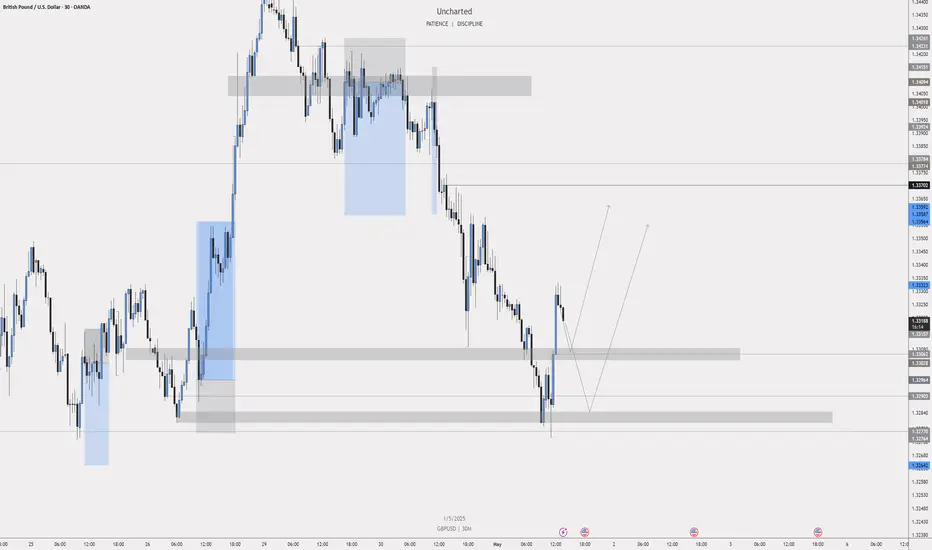
GBPUSD INTRADAY sideways consolidaionGBP/USD maintains a bullish bias, with the broader trend and structure supporting upside continuation. The recent intraday move appears to be an overbought corrective pullback toward a key prior consolidation area.
Key Support: 1.3210 – aligns with the previous consolidation zone and potential bullish inflection point.
Upside Targets:
1.3435 – initial resistance level
1.3500 and 1.3580 – medium to long-term bullish targets
If price finds support at 1.3210 and forms a bullish reversal, it would confirm the continuation of the uptrend toward the mentioned resistance levels.
However, a break and daily close below 1.3210 would invalidate the bullish scenario, suggesting deeper retracement toward 1.3120, with further support at 1.3015 and 1.2980.
Conclusion
GBP/USD remains bullish above 1.3210. Look for a bounce from this level to confirm upside continuation. A daily close below 1.3210 would turn the outlook bearish, exposing lower support levels.
This communication is for informational purposes only and should not be viewed as any form of recommendation as to a particular course of action or as investment advice. It is not intended as an offer or solicitation for the purchase or sale of any financial instrument or as an official confirmation of any transaction. Opinions, estimates and assumptions expressed herein are made as of the date of this communication and are subject to change without notice. This communication has been prepared based upon information, including market prices, data and other information, believed to be reliable; however, Trade Nation does not warrant its completeness or accuracy. All market prices and market data contained in or attached to this communication are indicative and subject to change without notice.

GOLD market update: range locked / breakout pending🏆 Gold Market Mid-Term Update
📊 Technical Outlook Update
🏆 Market Overview
▪️broke above 3 000 USD
▪️3250 USD S/R cleared as well
▪️Tested 3500 USD key S/R
▪️Rejection at 3500 USD key S/R
▪️pullback in progress currently
▪️locked inside range trading
▪️3275/3365 usd active range
▪️break below 3245 - BEARS take over
▪️break above 3385 - BULLS take over
▪️Bulls targets - 3450/3550 USD
▪️Bears targets - 3050/3150 USD
⭐️Recommended strategy
▪️Wait for a breakout
▪️LONG/SHORT after breakout
🔥 Key Drivers to Watch
🌍 Geopolitics & Trade
🇺🇸🇨🇳 U.S.–China Tariffs: Escalation continues pushing inflation fears & gold demand
🇪🇺 EU–U.S. tariffs (25%) are further straining global trade
💵 Weaker USD = stronger gold sentiment
🕊 Russia–Ukraine Ceasefire Talks
🗓 May 9 (Victory Day): Symbolic date eyed for a possible ceasefire announcement
🇷🇺 Parade vs 🇺🇦 EU leaders visiting Kyiv — all eyes on peace prospects
☢️ U.S.–Iran Nuclear Deal
🗓 April 28: Talks in Rome
🇮🇷 Iran shows readiness — possible easing of Middle East tensions

Market Analysis: GBP/USD Corrects GainsMarket Analysis: GBP/USD Corrects Gains
GBP/USD started a downside correction from the 1.3450 zone.
Important Takeaways for GBP/USD Analysis Today
- The British Pound rallied above 1.3200 and 1.3320 before the bears appeared.
- There is a key bearish trend line forming with resistance at 1.3375 on the hourly chart of GBP/USD at FXOpen.
GBP/USD Technical Analysis
On the hourly chart of GBP/USD at FXOpen, the pair formed a base above the 1.3200 level. The British Pound started a steady increase above the 1.3320 resistance zone against the US Dollar, as discussed in the previous analysis.
The pair even cleared 1.3400 before the bears appeared. A high was formed at 1.3443 before there was a downside correction. There was a move below the 1.3400 and 1.3350 levels.
A low was formed at 1.3301 and the pair is now consolidating losses. On the upside, the pair is facing resistance near the 1.3335 level and the 23.6% Fib retracement level of the downward move from the 1.3443 swing high to the 1.3301 low.
The next key resistance near the 1.3375 level. There is also a key bearish trend line forming with resistance at 1.3375. The trend line is near the 50% Fib retracement level of the downward move from the 1.3443 swing high to the 1.3301 low.
An upside break above the 1.3375 zone could send the pair toward 1.3410. Any more gains might open the doors for a test of 1.3445.
If there is another decline, the pair could find support near the 1.3300 level. The first major support sits near the 1.3245 zone. The next major support is 1.3200. If there is a break below 1.3200, the pair could extend the decline. The next key support is near the 1.3150 level. Any more losses might call for a test of the 1.3080 support.
This article represents the opinion of the Companies operating under the FXOpen brand only. It is not to be construed as an offer, solicitation, or recommendation with respect to products and services provided by the Companies operating under the FXOpen brand, nor is it to be considered financial advice.

GBPUSD SHORT FORECAST Q2 W18 D1 Y25GBPUSD SHORT FORECAST Q2 W18 D1 Y25
Professional Risk Managers👋
Welcome back to another FRGNT chart update📈
Diving into some Forex setups using predominantly higher time frame order blocks alongside confirmation breaks of structure.
Let’s see what price action is telling us today!
💡Here are some trade confluences📝
✅Weekly order block rejection
✅Daily order block rejection
✅Daily high rejection
✅Daily imbalance fill targets
🔑 Remember, to participate in trading comes always with a degree of risk, therefore as professional risk managers it remains vital that we stick to our risk management plan as well as our trading strategies.
📈The rest, we leave to the balance of probabilities.
💡Fail to plan. Plan to fail.
🏆It has always been that simple.
❤️Good luck with your trading journey, I shall see you at the very top.
🎯Trade consistent, FRGNT X

Bullish Rebound in Action: GBP/USD Bounces Off Key Demand Zone!Timeframe: 1-Hour (H1)
Ideal for short to medium-term intraday trades.
Support Zone (Entry):
Price bounced from a strong demand zone around 1.32800, suggesting a potential long entry.
Stop Loss:
Just below the green zone at approx. 1.32700
Target:
Resistance zone marked around 1.34500, offering high upside potential.
Bullish Price Action:
Strong bounce candle at support — indicating demand pressure and a possible reversal.
Favorable Risk-to-Reward:
Wide profit zone relative to stop loss, high RRR setup.
