Bearish GBPUSD?? maybe??I have some questions here and no clear answers yet. For the moment, there is no trading idea here.
1) Is the USD going to be strong this week? - after scanning other USD pairs, the best I can say is "maybe".
2) Looking at GBPUSD, can we say it is bearish. - The uptrend does seem to be exhausting, but until this support is convincingly broken, it is still a "maybe".
It follows that there is no trade here, just a possibility. I don't want to fall in the trap of anticipating what will happen next. That is not a trader's job. Patience is one of the core skills in trading, that we have to acquire and master. Waiting for the market to show us its hand is always advisable.
This is not a trade recommendation; it’s merely my own analysis. Trading carries a high level of risk so carefully managing your capital and risk is important. If you like my idea, please give a “boost” and follow me to get even more.
GBPUSD

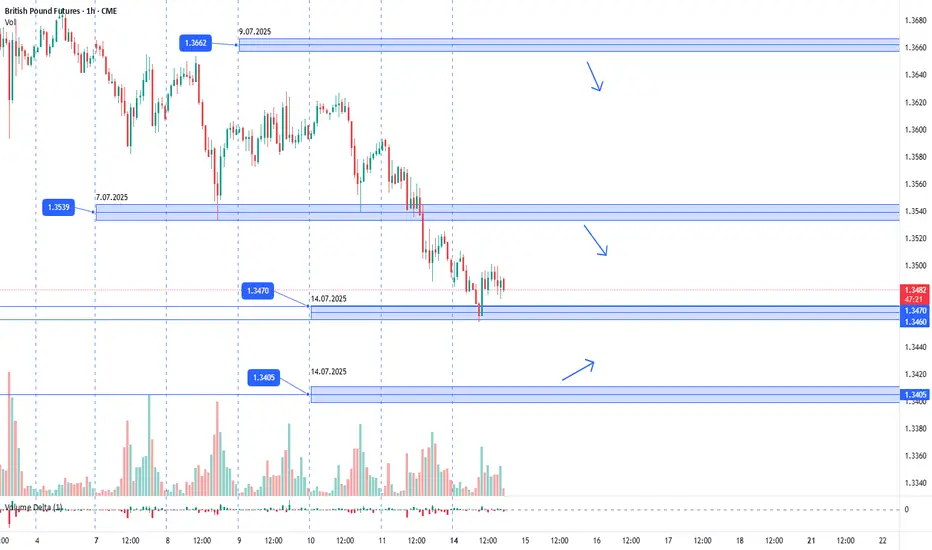
GBPUSD. 14.07.2025. The plan for the next few days.The nearest interesting resistance zone was already worked out in the morning and gave a good reaction. Let's mark the others where we can expect a reaction. It's not certain that there will be a major reversal, but I think we'll see a correction that can be monetized. We're waiting for a reaction and looking for an entry point.
The post will be adjusted based on any changes.
Don't forget to click on the Rocket! =)
GBPUSD Potential UpsidesHey Traders, in today's trading session we are monitoring GBPUSD for a buying opportunity around 1.33900 zone, GBPUSD is trading in an uptrend and currently is in a correction phase in which it is approaching the trend at 1.33900 support and resistance area.
Trade safe, Joe.

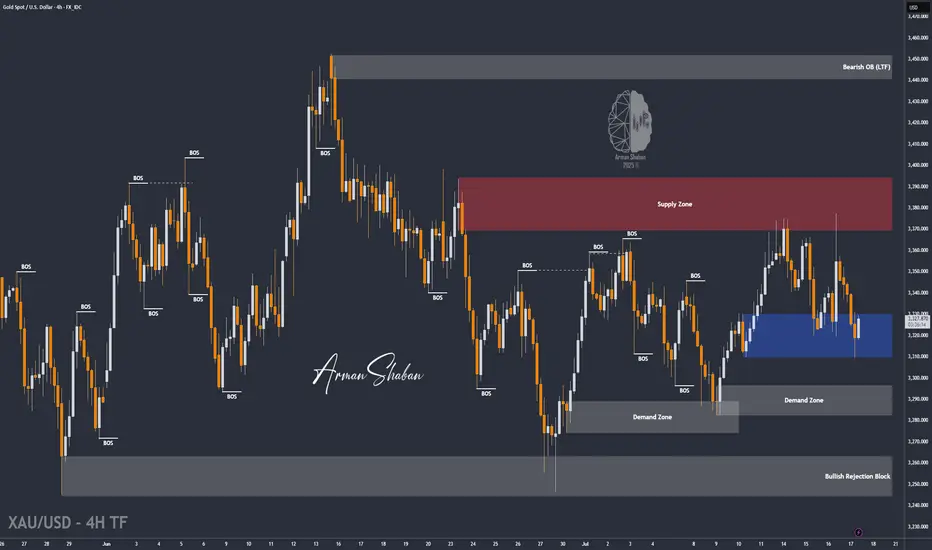
XAU/USD | First LONG to $3345, Then a Potential DROP Below $3300By analyzing the gold chart on the 4-hour timeframe, we can see that last night the price first tapped into the $3340 level, showing an initial push up to $3352. However, the drop intensified soon after, breaking the $3340 resistance and, according to the second scenario, falling to $3310. Upon reaching this key demand level, buying pressure kicked in, pushing the price back up to $3325. Now, the key question is whether gold can hold the $3310 support. If this level holds, we can expect a rise toward $3331 as the first target and $3345 as the second. After this move, a rejection from the $3345 area could trigger another drop, possibly pushing gold below $3300. So, first LONG, then SHORT!
THE LATEST VIDEO ANALYSIS :
Please support me with your likes and comments to motivate me to share more analysis with you and share your opinion about the possible trend of this chart with me !
Best Regards , Arman Shaban
GBPUSD buy playing outAs projected Post CPI
The pound is responding against the greenback and we can see price pushing upward.

GBPUSD long from last day's lowGBPUSD reached lower than expected. My bias for today is still bullish. I am placing my SL at last day's low. You could target last day's high but I am aiming for a 3R.

GBPUSD BUYGBP/USD rises to near 1.3450 due to improved market sentiment, UoM Consumer Sentiment eyed
GBP/USD gains ground after registering small losses in the previous session, trading around 1.3440 during the Asian hours on Friday. The pair appreciates as the US Dollar edges lower due to dovish remarks from the Federal Reserve officials.
The Relative Strength Index (RSI) indicator on the 4-hour chart stays below 40, reflecting bearish conditions for GBP/USD. The Fibonacci 61.8% retracement level of the latest uptrend seems to have formed a pivot level at 1.3400.
In case GBP/USD fails to stabilize above 1.3400, technical sellers could remain interested. In this scenario, 1.3300 (Fibonacci 78.6% retracement) and 1.3275 (100-day Simple Moving Average) could be seen as next support levels. On the upside, resistance levels could be spotted at 1.3470 (Fibonacci 50% retracement), 1.3500 (static level, round level) and 1.3540 (Fibonacci 38.2% retracement).
TP 1 1.34403
TP 2 1.34859
TP 3 1.35407
RESISTANCE 1.33627

Pound Pressured by Firm Dollar and UK Data ReviewThe British pound held near $1.339 on Friday, its lowest level in eight weeks, as the U.S. dollar strengthened. The dollar reached a three-week high after President Trump confirmed he would not remove Fed Chair Jerome Powell, despite continued criticism of the Fed’s careful stance on rate cuts. In the UK, markets are closely reviewing recent employment and inflation data. While the labor market shows signs of weakness, updated tax records suggest the slowdown may not be as severe as previously thought.
Resistance is at 1.3535, while support holds at 1.3380.

Fundamental Market Analysis for July 18, 2025 GBPUSDSterling is stabilising near 1.34400 after an extended sell‑off, aided by robust labour‑market data: average weekly earnings including bonuses grew 6.1 % y/y and unemployment held at 4 %. The Bank of England signalled that policy easing will be discussed only if employment cools markedly, effectively shutting the door on immediate rate cuts and supporting the pound.
Exclusive for our readers – a 202% bonus on deposits of $202 or more! Give the promo code BTC202 to customer support and start trading with TRIPLED capital.
The external backdrop also favours further gains. Uncertainty over US tariff plans could weaken near‑term dollar demand if Washington misses its 1 August deadline for bilateral agreements. Meanwhile, London is promoting a tech‑and‑defence partnership with the US, reducing pressure on UK exporters and attracting inflows into GBP‑denominated assets.
The 10‑year Gilt‑UST yield gap has narrowed to –75 bp, well above the January trough (‑95 bp), improving the relative appeal of UK bonds. A close above 1.35000 would trigger hedge‑fund demand, and lingering dollar softness, hinted at in the latest FOMC minutes, leaves scope for a run towards 1.35750. A protective stop is placed at 1.33800, just below last week’s intraday pivot.
Trade idea: BUY 1.34400, SL 1.33800, TP 1.35750

GBPUSD SELLBy utilizing levels, historical patterns, , we can formulate a hypothesis that the market might follow a similar trajectory if bearish sentiment prevails.
GBPUSD Is Bearish! Short!
Take a look at our analysis for GBPUSD.
Time Frame: 1h
Current Trend: Bearish
Sentiment: Overbought (based on 7-period RSI)
Forecast: Bearish
The market is testing a major horizontal structure 1.341.
Taking into consideration the structure & trend analysis, I believe that the market will reach 1.338 level soon.
P.S
We determine oversold/overbought condition with RSI indicator.
When it drops below 30 - the market is considered to be oversold.
When it bounces above 70 - the market is considered to be overbought.
Disclosure: I am part of Trade Nation's Influencer program and receive a monthly fee for using their TradingView charts in my analysis.
Like and subscribe and comment my ideas if you enjoy them!

GBPUSD ANALYSIS From the previous trading day we can see that the pair has been making random up and down movements without a clear direction and even though we rejected a key support area the higher timeframes like daily and weekly still show bearish sentiment right now the best move is to wait

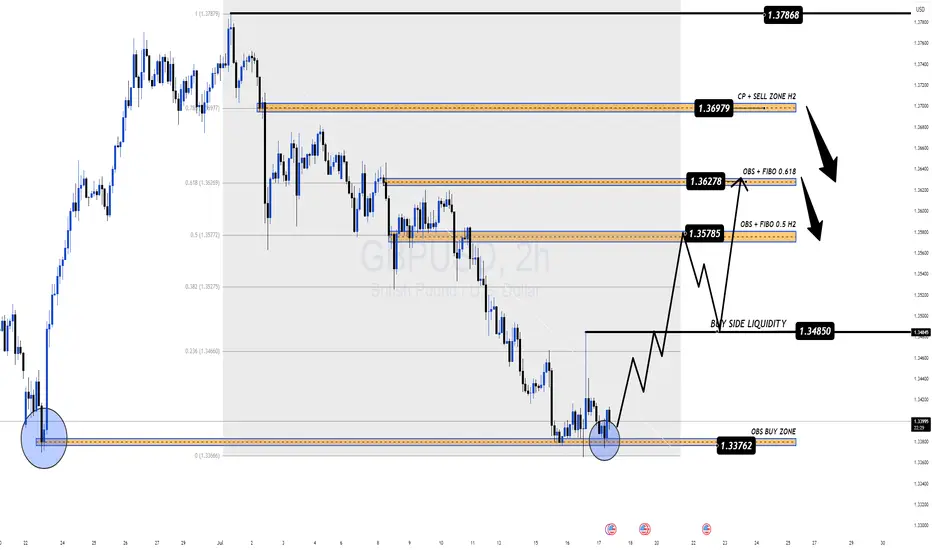
Sterling Rebounds But Faces Heavy Resistance Ahead GBP/USD Outlook – Sterling Rebounds But Faces Heavy Resistance Ahead
🌐 Macro Insight – UK Labour Data Mixed, Trump Headlines Stir Market
The British Pound (GBP) regained some lost ground against the U.S. Dollar after the UK labour market data revealed mixed signals:
Wage growth cooled as expected, suggesting a potential easing in inflationary pressures.
UK ILO Unemployment ticked up to 4.7%, raising concerns about labour market fragility.
Meanwhile, in the U.S., President Trump denied reports about firing Fed Chair Powell, briefly easing tensions and stabilizing USD demand.
With both currencies facing mixed narratives, GBP/USD is set for a pivotal move, and traders should stay alert to key liquidity zones and order blocks.
🔍 Technical Setup – MMF + Smart Money Framework
On the H2 chart, GBP/USD has reacted from the OBS BUY ZONE at 1.3376, bouncing with a bullish structure and forming a potential continuation pattern. Price is now expected to target key zones above, where significant order blocks and Fibonacci confluence reside.
⚙️ Key Resistance Zones:
1.3578 – 0.5 Fibonacci Retracement + OBS
1.3627 – 0.618 Fibonacci + Supply Zone
1.3697 – CP Continuation Pattern + H2 Order Block
These areas represent institutional interest for potential sell setups.
✅ Trade Plan for GBP/USD
🟢 BUY ZONE: 1.3376 – 1.3398
SL: 1.3360
TP: 1.3450 → 1.3485 → 1.3530 → 1.3578 → 1.3627
Look for bullish structure confirmation before entering. Target the next liquidity highs and imbalance zones.
🔴 SELL ZONE: 1.3627 – 1.3697
SL: 1.3735
TP: 1.3580 → 1.3530 → 1.3480
Watch for rejection and bearish divergence at supply areas to time potential swing shorts.
🧠 Strategy Notes
This setup combines MMF zones with institutional volume and price action concepts. The pair is currently reacting to a deep discount zone and may climb toward premium levels where selling pressure awaits. Be cautious during New York session volatility, especially with potential U.S. policy headlines and upcoming global inflation data.
🗨 What’s Next?
Are bulls ready to reclaim control or will resistance zones cap this recovery? Drop your ideas below and don’t forget to follow for more institutional-grade insights powered by MMF methodology.
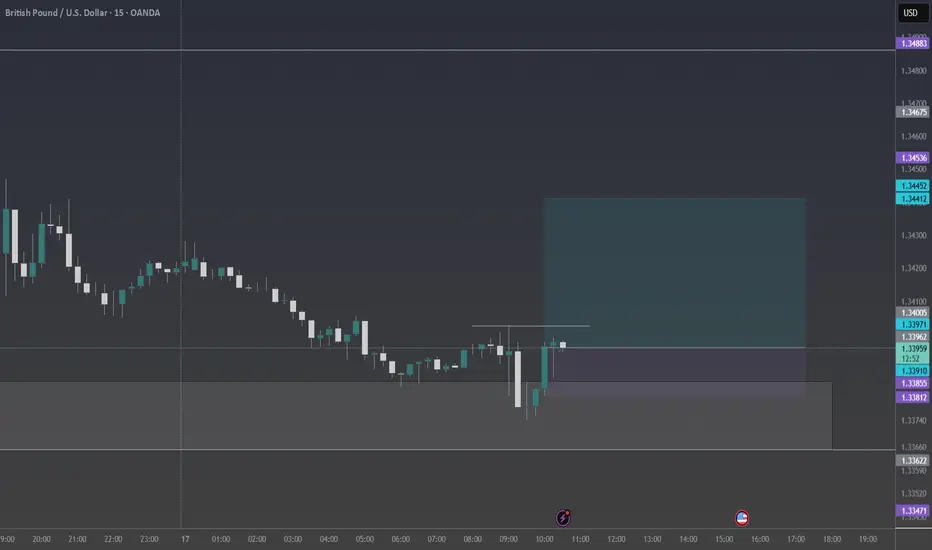
GBPUSD H1 I Bullish Bounce Off Based on the H1 chart analysis, the price is approaching our buy entry level at 1.3418, a pullback support.
Our take profit is set at 1.3456, an overlap resistance.
The stop loss is placed at 1.3377,a multi swing low support.
High Risk Investment Warning
Trading Forex/CFDs on margin carries a high level of risk and may not be suitable for all investors. Leverage can work against you.
Stratos Markets Limited (tradu.com ):
CFDs are complex instruments and come with a high risk of losing money rapidly due to leverage. 66% of retail investor accounts lose money when trading CFDs with this provider. You should consider whether you understand how CFDs work and whether you can afford to take the high risk of losing your money.
Stratos Europe Ltd (tradu.com ):
CFDs are complex instruments and come with a high risk of losing money rapidly due to leverage. 66% of retail investor accounts lose money when trading CFDs with this provider. You should consider whether you understand how CFDs work and whether you can afford to take the high risk of losing your money.
Stratos Global LLC (tradu.com ):
Losses can exceed deposits.
Please be advised that the information presented on TradingView is provided to Tradu (‘Company’, ‘we’) by a third-party provider (‘TFA Global Pte Ltd’). Please be reminded that you are solely responsible for the trading decisions on your account. There is a very high degree of risk involved in trading. Any information and/or content is intended entirely for research, educational and informational purposes only and does not constitute investment or consultation advice or investment strategy. The information is not tailored to the investment needs of any specific person and therefore does not involve a consideration of any of the investment objectives, financial situation or needs of any viewer that may receive it. Kindly also note that past performance is not a reliable indicator of future results. Actual results may differ materially from those anticipated in forward-looking or past performance statements. We assume no liability as to the accuracy or completeness of any of the information and/or content provided herein and the Company cannot be held responsible for any omission, mistake nor for any loss or damage including without limitation to any loss of profit which may arise from reliance on any information supplied by TFA Global Pte Ltd.
The speaker(s) is neither an employee, agent nor representative of Tradu and is therefore acting independently. The opinions given are their own, constitute general market commentary, and do not constitute the opinion or advice of Tradu or any form of personal or investment advice. Tradu neither endorses nor guarantees offerings of third-party speakers, nor is Tradu responsible for the content, veracity or opinions of third-party speakers, presenters or participants.

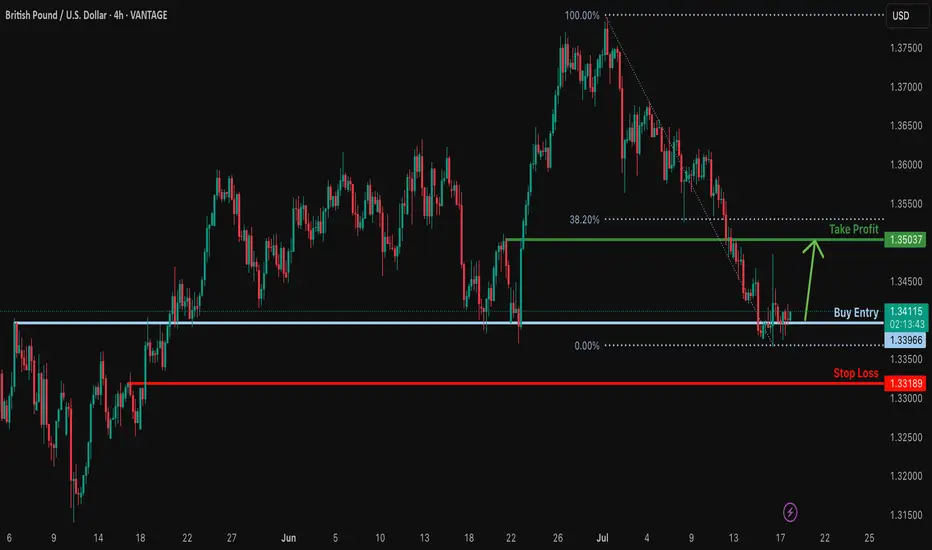
Bullish reversal?GBP/USD is reacting off the support level which is an overlap support and could bounce from this level to our take profit.
Entry: 1.3396
Why we like it:
There is an overlap support.
Stop loss: 1.3318
Why we like it:
There is a pullback support.
Take profit: 1.3503
Why we like it:
There is a pullback resistance that is slightly below the 38.2% Fibonacci retracement.
Enjoying your TradingView experience? Review us!
Please be advised that the information presented on TradingView is provided to Vantage (‘Vantage Global Limited’, ‘we’) by a third-party provider (‘Everest Fortune Group’). Please be reminded that you are solely responsible for the trading decisions on your account. There is a very high degree of risk involved in trading. Any information and/or content is intended entirely for research, educational and informational purposes only and does not constitute investment or consultation advice or investment strategy. The information is not tailored to the investment needs of any specific person and therefore does not involve a consideration of any of the investment objectives, financial situation or needs of any viewer that may receive it. Kindly also note that past performance is not a reliable indicator of future results. Actual results may differ materially from those anticipated in forward-looking or past performance statements. We assume no liability as to the accuracy or completeness of any of the information and/or content provided herein and the Company cannot be held responsible for any omission, mistake nor for any loss or damage including without limitation to any loss of profit which may arise from reliance on any information supplied by Everest Fortune Group.
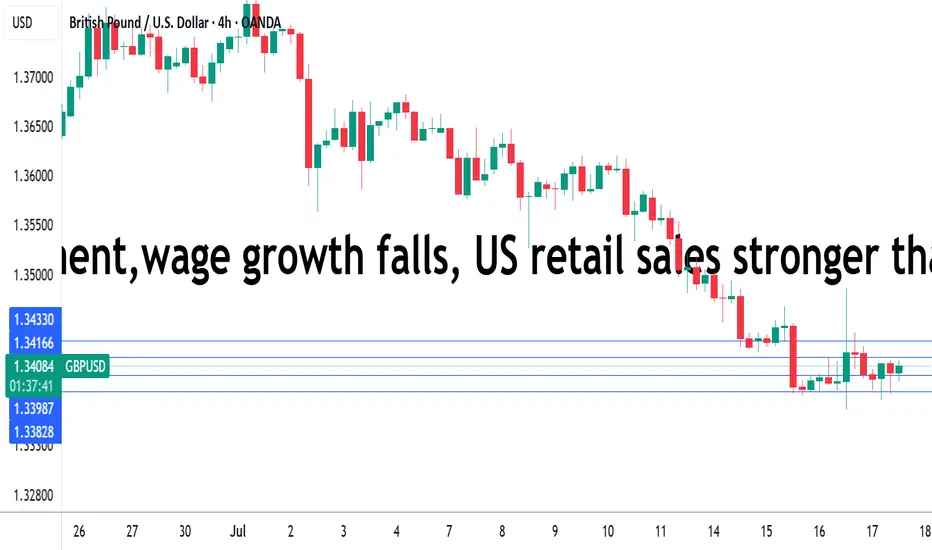
UK employment,wage growth falls, US retail sales shineThe British pound showing limited movement on Thursday. In the North American session, GBP/USD is trading at 1.3406, down 0.09% on the day.
Today's UK employment report pointed to a cooling in the UK labor market. The number of employees on company payrolls dropped by 41 thousand in June after a decline of 25 thousand in May. Still, the May decline was downwardly revised from 109 thousand, easing concerns of a significant deterioration in the labor market.
Wage growth (excluding bonuses) dropped to 5.0% from a revised 5.3%, above the market estimate of 4.9%. The unemployment rate ticked up to 4.7%, up from 4.6% and above the market estimate of 4.6%. This is the highest jobless level since the three months to July 2021.
The latest job data will ease the pressure on the Bank of England to lower rates, as the sharp revision to the May payroll employees means the labor market has not deteriorated as much as had been feared. Still, the employment picture remains weak and the markets are expecting an August rate cut, even though UK inflation was hotter than expected in June.
US retail sales bounced back in June after back-to-back declines. Consumers reacted with a thumbs-down to President Trump's tariffs, which took effect in April and made imported goods more expensive.
The markets had anticipated a marginal gain of just 0.1% m/m in June but retail sales came in at an impressive 0.6%, with most sub-categories recording stronger activity in June. This follows a sharp 0.9% decline in May.
The US tariffs seem to have had a significant impact on retail sales, as consumers continue to time their purchases to minimize the effect of tariffs.
Consumers increased spending before the tariffs took effect and cut back once the tariffs were in place. With a truce in place between the US and China which has slashed tariff rates, consumers have opened their wallets and are spending more on big-ticket items such as motor vehicles, which jumped 1.2% in June.

GBP GBPUSD Supply-Demand Long SignalHigher Timeframe Analysis:
- Price inside daily/Weekly level of demand + pivot
- Long term trend = uptrend
- Fundamentals Bullish
- COT Mixed
- Technicals Bullish
Lowertimeframe:
- Price broke downard ML
- Price removed the opposing pivotal level of demand
- DBR Demand created from CPI event
- Split risk on GC + GBP
This is a mix of using Sentiment, technical analysis, and fundamental analysis with supply-demand.

GBP/CAD Clarity in Motion! Levels Are Locked In Hey everyone 👋
📌 BUY LIMIT ORDER / GBP/CAD Key Levels
🟢 Entry: 1,83873
🎯 Target 1: 1,84104
🎯 Target 2: 1,84372
🎯 Target 3: 1,85040
🔴 Stop: 1,83316
📈 Risk/Reward Ratio: 2.18
I double-checked the levels and put together a clean, focused analysis just for you. Every single like seriously boosts my motivation to keep sharing 📈 Your support means the world to me!
Huge thanks to everyone who likes and backs this work 💙 Our goals are crystal clear, our strategy is solid. Let’s keep moving forward with confidence and smart execution!

GBPUSD reversal to the upsideGBPUSD has been in a downtrend for about a week. Yesterday showed bullish momentum but the price was pushed back to near yesterday's low. Price couldn't break it. We could see a strong reversal in the coming days/start of next week. I think today's daily candle will be bullish with a long wick to the downside showing bullish momentum. I will take a 3:1 trade following that analysis.
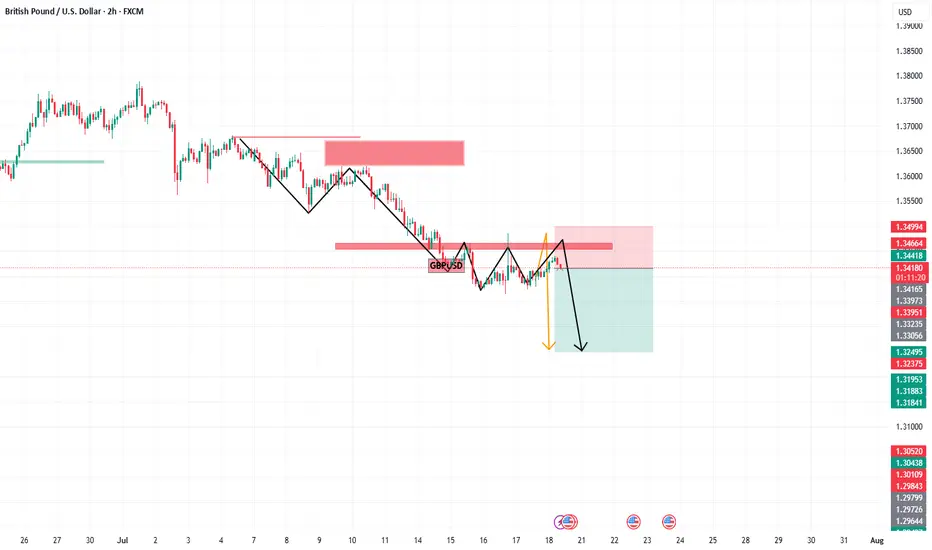
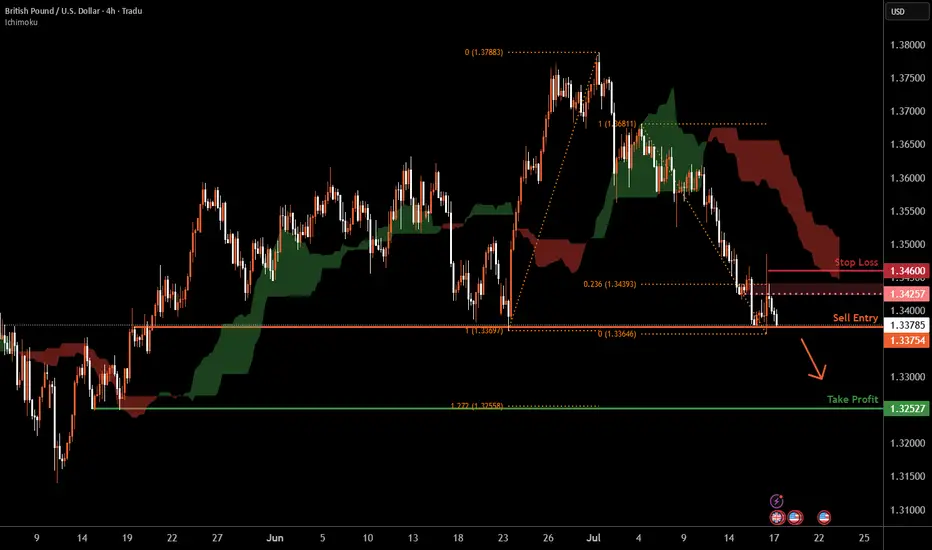
Cable H4 | Potential bearish breakout?Cable (GBP/USD) is falling toward a potential breakout level, where the bearish momentum could cause the price to drop lower from this level.
Sell entry is at 1.3375 which is a potential breakout level.
Stop loss is at 1.3460 which is a level that sits above the 23.6% Fibonacci retracement and an overlap resistance.
Take profit is at 1.3252 which is a multi-swing-low support that aligns with the 127.2% Fibonacci extension.
High Risk Investment Warning
Trading Forex/CFDs on margin carries a high level of risk and may not be suitable for all investors. Leverage can work against you.
Stratos Markets Limited (tradu.com ):
CFDs are complex instruments and come with a high risk of losing money rapidly due to leverage. 66% of retail investor accounts lose money when trading CFDs with this provider. You should consider whether you understand how CFDs work and whether you can afford to take the high risk of losing your money.
Stratos Europe Ltd (tradu.com ):
CFDs are complex instruments and come with a high risk of losing money rapidly due to leverage. 66% of retail investor accounts lose money when trading CFDs with this provider. You should consider whether you understand how CFDs work and whether you can afford to take the high risk of losing your money.
Stratos Global LLC (tradu.com ):
Losses can exceed deposits.
Please be advised that the information presented on TradingView is provided to Tradu (‘Company’, ‘we’) by a third-party provider (‘TFA Global Pte Ltd’). Please be reminded that you are solely responsible for the trading decisions on your account. There is a very high degree of risk involved in trading. Any information and/or content is intended entirely for research, educational and informational purposes only and does not constitute investment or consultation advice or investment strategy. The information is not tailored to the investment needs of any specific person and therefore does not involve a consideration of any of the investment objectives, financial situation or needs of any viewer that may receive it. Kindly also note that past performance is not a reliable indicator of future results. Actual results may differ materially from those anticipated in forward-looking or past performance statements. We assume no liability as to the accuracy or completeness of any of the information and/or content provided herein and the Company cannot be held responsible for any omission, mistake nor for any loss or damage including without limitation to any loss of profit which may arise from reliance on any information supplied by TFA Global Pte Ltd.
The speaker(s) is neither an employee, agent nor representative of Tradu and is therefore acting independently. The opinions given are their own, constitute general market commentary, and do not constitute the opinion or advice of Tradu or any form of personal or investment advice. Tradu neither endorses nor guarantees offerings of third-party speakers, nor is Tradu responsible for the content, veracity or opinions of third-party speakers, presenters or participants.
GBPUSD(20250717)Today's AnalysisMarket news:
The annual rate of PPI in the United States in June was 2.3%, lower than the expected 2.5%, the lowest since September 2024, and the previous value was revised up from 2.6% to 2.7%. Federal Reserve Beige Book: The economic outlook is neutral to slightly pessimistic. Manufacturing activity declined slightly, and corporate recruitment remained cautious.
Technical analysis:
Today's buying and selling boundaries:
1.3423
Support and resistance levels:
1.3544
1.3499
1.3470
1.3377
1.3348
1.3303
Trading strategy:
If it breaks through 1.3423, consider buying, and the first target price is 1.3470
If it breaks through 1.3377, consider selling, and the first target price is 1.3348
