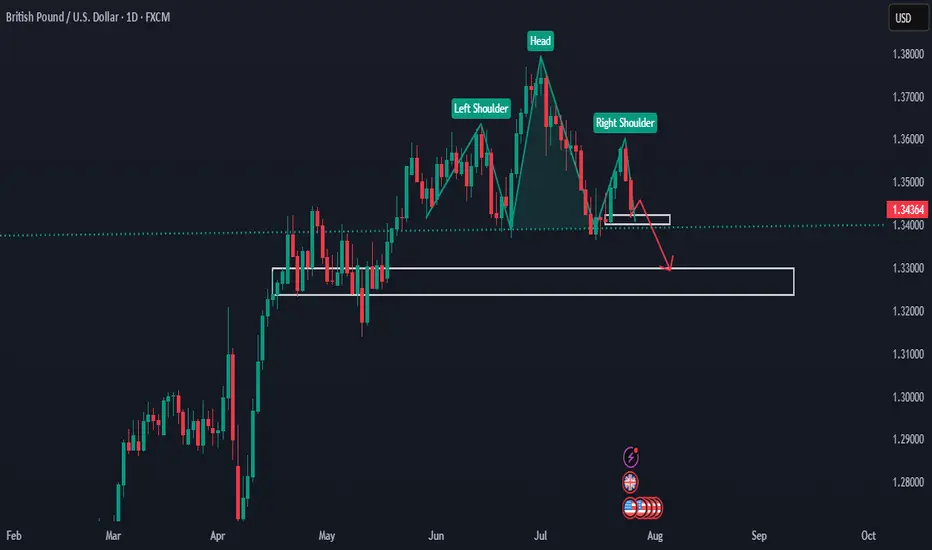
GBP Forming Head & Shoulders - Possible Bearish Scenario AheadHello traders!
As you can see, price has formed a Head and Shoulders pattern on the daily chart.
If it breaks below the current support/demand area, it could move lower toward the 1.32000 – 1.33000 zone.
We’ll be watching closely to see what it does in the coming weeks.
Gbpusd_forecast
Market Analysis: GBP/USD Dips FurtherMarket Analysis: GBP/USD Dips Further
GBP/USD started a downside correction from the 1.3620 zone.
Important Takeaways for GBP/USD Analysis Today
- The British Pound started a fresh decline and settled below the 1.3500 zone.
- There is a connecting bullish trend line forming with support at 1.3415 on the hourly chart of GBP/USD at FXOpen.
GBP/USD Technical Analysis
On the hourly chart of GBP/USD at FXOpen, the pair struggled above the 1.3600 zone. The British Pound started a fresh decline below the 1.3550 pivot level against the US Dollar, as discussed in the previous analysis.
The pair dipped below the 1.3500 and 1.3450 levels. A low was formed at 1.3364 and the pair is now consolidating losses. On the upside, it is facing resistance near the 1.3475 level. The next key resistance is near 1.3490 and the 50% Fib retracement level of the downward move from the 1.3619 swing high to the 1.3364 low.
An upside break above the 1.3490 zone could send the pair toward 1.3520 and the 61.8% Fib retracement level.
More gains might open the doors for a test of 1.3620. If there is another decline, the pair could find support near the 1.3415 level and a connecting bullish trend line. The first major support sits near the 1.3365 zone.
The next major support is 1.3350. If there is a break below 1.3350, the pair could extend the decline. The next key support is near the 1.3320 level. Any more losses might call for a test of 1.3250.
This article represents the opinion of the Companies operating under the FXOpen brand only. It is not to be construed as an offer, solicitation, or recommendation with respect to products and services provided by the Companies operating under the FXOpen brand, nor is it to be considered financial advice.

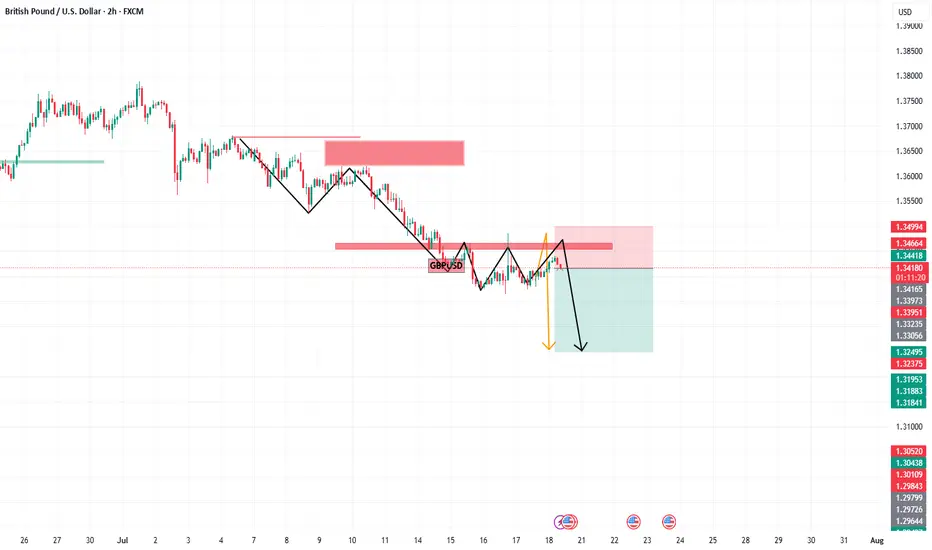
GBPUSD: Bearish > Bullish Order FlowAlright, we are approaching some Higher Timeframe Points of Interests. We got a Potential Bullish Bat Pattern Pattern this align with this Bullish H4 Order Block, that's right in the middle of an whole number 1.34. We could expect some spikes around the area, some complex pullbacks, but we must remain steady.

GBPUSD SELLBy utilizing levels, historical patterns, , we can formulate a hypothesis that the market might follow a similar trajectory if bearish sentiment prevails.
Sterling Rebounds But Faces Heavy Resistance Ahead GBP/USD Outlook – Sterling Rebounds But Faces Heavy Resistance Ahead
🌐 Macro Insight – UK Labour Data Mixed, Trump Headlines Stir Market
The British Pound (GBP) regained some lost ground against the U.S. Dollar after the UK labour market data revealed mixed signals:
Wage growth cooled as expected, suggesting a potential easing in inflationary pressures.
UK ILO Unemployment ticked up to 4.7%, raising concerns about labour market fragility.
Meanwhile, in the U.S., President Trump denied reports about firing Fed Chair Powell, briefly easing tensions and stabilizing USD demand.
With both currencies facing mixed narratives, GBP/USD is set for a pivotal move, and traders should stay alert to key liquidity zones and order blocks.
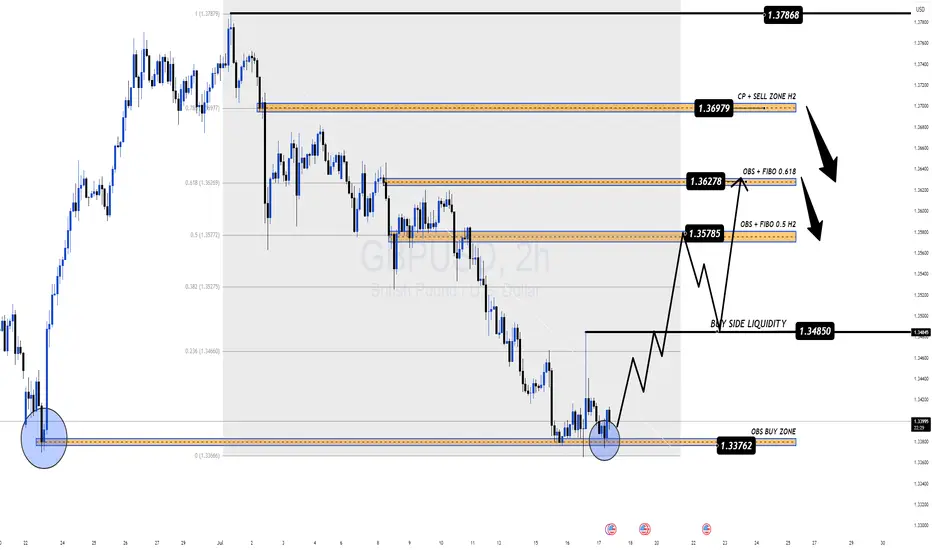
🔍 Technical Setup – MMF + Smart Money Framework
On the H2 chart, GBP/USD has reacted from the OBS BUY ZONE at 1.3376, bouncing with a bullish structure and forming a potential continuation pattern. Price is now expected to target key zones above, where significant order blocks and Fibonacci confluence reside.
⚙️ Key Resistance Zones:
1.3578 – 0.5 Fibonacci Retracement + OBS
1.3627 – 0.618 Fibonacci + Supply Zone
1.3697 – CP Continuation Pattern + H2 Order Block
These areas represent institutional interest for potential sell setups.
✅ Trade Plan for GBP/USD
🟢 BUY ZONE: 1.3376 – 1.3398
SL: 1.3360
TP: 1.3450 → 1.3485 → 1.3530 → 1.3578 → 1.3627
Look for bullish structure confirmation before entering. Target the next liquidity highs and imbalance zones.
🔴 SELL ZONE: 1.3627 – 1.3697
SL: 1.3735
TP: 1.3580 → 1.3530 → 1.3480
Watch for rejection and bearish divergence at supply areas to time potential swing shorts.
🧠 Strategy Notes
This setup combines MMF zones with institutional volume and price action concepts. The pair is currently reacting to a deep discount zone and may climb toward premium levels where selling pressure awaits. Be cautious during New York session volatility, especially with potential U.S. policy headlines and upcoming global inflation data.
🗨 What’s Next?
Are bulls ready to reclaim control or will resistance zones cap this recovery? Drop your ideas below and don’t forget to follow for more institutional-grade insights powered by MMF methodology.
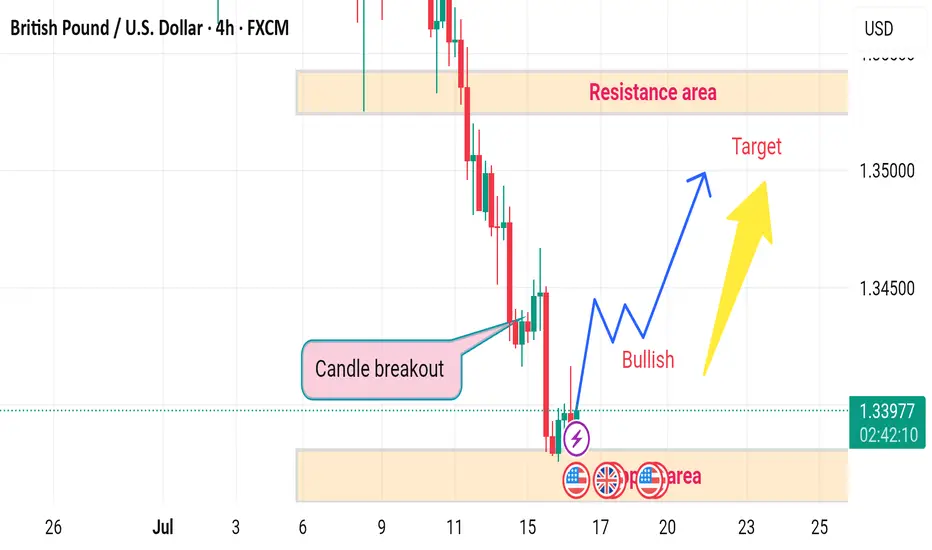
GBPUSD H4 RISESDisruption Analysis – GBP/USD (4H)
🕯️ Candle Breakout Misleading
The marked “Candle Breakout” area is followed by weak bullish momentum, but lacks strong volume confirmation or higher timeframe reversal structure.
The quick rejection after the breakout may indicate a false breakout, not a sustainable trend reversal.
⚠️ Demand Zone Weakness
The “Support Area” (demand zone) has already been tested multiple times.
Multiple touches weaken the demand zone—buyers may be exhausted, increasing the chances of a breakdown instead of a bounce.
📉 Macro Trend Still Bearish
The recent sharp downtrend shows a strong bearish structure (lower highs, lower lows).
A few bullish candles are not enough to confirm a reversal—this could just be a retracement.
💣 Upcoming Fundamental Risks
The presence of multiple economic event icons (UK & US flags) indicates high-impact news—could result in unexpected volatility or trend reversals.
Fundamental factors may disrupt the projected bullish move entirely.
🎯 Bullish Target Overoptimistic
Target near 1.35000 lies within the Resistance Area, which has previously caused sharp rejections.
Without a strong breakout above 1.3400, this target is unrealistic in current market conditions.
GU Bearish Correction, Bullish TrendLower lows set up suitable r:r for a 400pip bearish move.
Higher highs setup timing needed to confirm rejoining the bigger bullish trend.

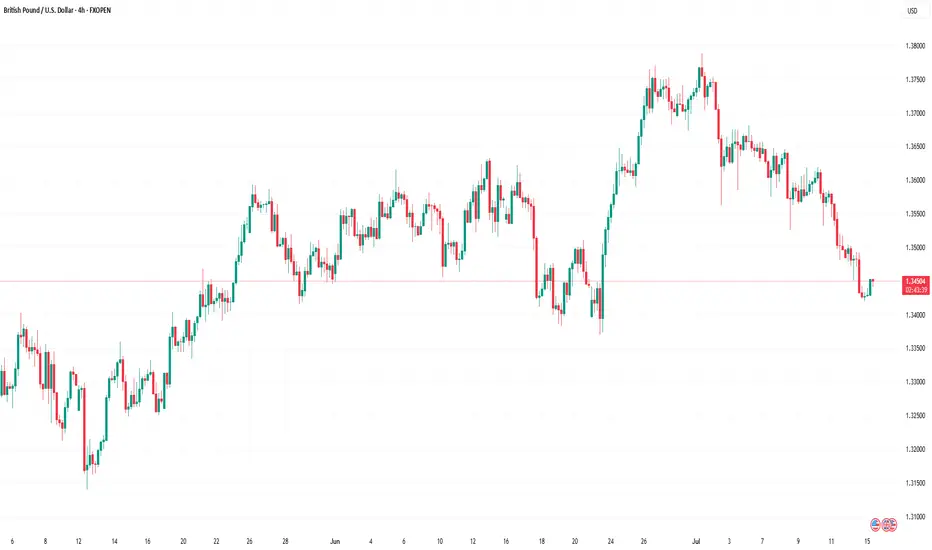
GBP/USD Rate Falls to Key Support LevelGBP/USD Rate Falls to Key Support Level
As of today, the GBP/USD chart indicates that the British pound has declined by more than 2% against the US dollar since the beginning of July. Notably, the pace of the decline accelerated on Friday and continued into Monday.
According to Reuters, the pound is under pressure due to market concerns over a potential economic slowdown amid an escalating trade war. Last week’s data confirmed a contraction in UK GDP, which could have far-reaching implications. In this context, criticism of the UK government’s failure to reduce public spending is becoming more pronounced.
What’s next for GBP/USD?
Technical Analysis of the GBP/USD Chart
From a bullish perspective, it is worth noting that the pair has fallen to a significant support level around 1.3425. This level previously acted as resistance in the spring, but after a breakout, it has now turned into support (as indicated by arrows on the chart). Additionally, the RSI indicator shows strong oversold conditions, which suggests a potential short-term rebound.
From a bearish standpoint, it is concerning that the sharp rally from point A to point B has been entirely erased by the July decline. This indicates that despite significant gains by the bulls, they failed to hold them—casting doubt on GBP/USD's ability to sustain growth in the medium term.
Ongoing pressure may lead to an attempt by bears to push GBP/USD below the June low at point A. However, it is also possible that bearish momentum will weaken thereafter, potentially leading to a recovery within the developing downward channel (marked in red).
This article represents the opinion of the Companies operating under the FXOpen brand only. It is not to be construed as an offer, solicitation, or recommendation with respect to products and services provided by the Companies operating under the FXOpen brand, nor is it to be considered financial advice.
GBPUSD: Two Strong Bullish Area To Buy From ?GU is currently in a bullish trend when examined on a daily time frame. There are two potential areas for purchase. The first area is currently active, as we anticipate a price reversal from this point. There is a significant possibility that price could decline to the second area and subsequently reverse from there directly. The sole reason we believe price could drop to the second area is if the US Dollar experiences corrections, which could cause GU to drop to our second area and subsequently rebound.
If you appreciate our analysis, we kindly request that you consider the following actions:
-Liking the Ideas
-Commenting on the Ideas
-Sharing the Ideas
We extend our sincere gratitude for your continuous support. We trust that our insights have provided even a modicum of assistance.
Team Setupsfx_
❤️🚀

GBPUSD BUY TRADEOpportunity to Buy GBPUSD Now
Entry: 1.34700
Stoplos: 1.34400
TakeProfit: 1.35800
Comment your opinion
For Account management contact me on X @shajudeakinoba1

GBP/USD Shorts from 3hr/5hr supply zoneMy analysis this week centers around the continuation of the bearish trend we've been observing. Recently, there was a break of structure, and a new supply zone has formed—indicating a potential continuation of the downtrend.
I’ll be waiting for price to retrace back into these Points of Interest (POIs), where I’ll look for lower time frame confirmations to catch potential sell entries and ride the move down.
I believe there’s still some bearish pressure left, and I expect price to continue falling until it reaches the 6-hour demand zone. Once we approach that area, I’ll begin looking for Wyckoff accumulation patterns as a signal for a potential reversal or rally to the upside.
Confluences for GBP/USD Sells:
✅ GBP/USD has been bearish over the past few weeks, and this trend may continue.
✅ Breaks of structure have occurred, forming fresh supply zones ideal for entries.
✅ Liquidity exists below current price, which may get swept before a reversal.
✅ The lower demand zone still needs to be mitigated, suggesting more downside movement first.
📌 If price fails to react properly at the 3-hour supply, I’ll be watching for a move into the 5-hour supply zone, which sits in a more premium area and may offer a cleaner reaction.
Let’s stay patient and focused — wishing everyone a profitable trading week ahead! 📉💼

USD Strengthens Against GBP With New Tariff AnnouncementsThis is the Weekly FOREX Forecast for the week of July 14 - 18th.
In this video, we will analyze the following FX market: GBPUSD
The latest headlines tell the story. The tariffs are triggering a slow run to the USD safe haven. The previous week showed the USD Index closed pretty strong, while GBPUSD weakened.
There's a good chance we'll see more of the same this coming week.
Look for the strength in USD to continue to be supported by fundamental news, and outperform the other major currencies, including the GBP.
Buy USD/xxx
Sell xxx/USD
Enjoy!
May profits be upon you.
Leave any questions or comments in the comment section.
I appreciate any feedback from my viewers!
Like and/or subscribe if you want more accurate analysis.
Thank you so much!
Disclaimer:
I do not provide personal investment advice and I am not a qualified licensed investment advisor.
All information found here, including any ideas, opinions, views, predictions, forecasts, commentaries, suggestions, expressed or implied herein, are for informational, entertainment or educational purposes only and should not be construed as personal investment advice. While the information provided is believed to be accurate, it may include errors or inaccuracies.
I will not and cannot be held liable for any actions you take as a result of anything you read here.
Conduct your own due diligence, or consult a licensed financial advisor or broker before making any and all investment decisions. Any investments, trades, speculations, or decisions made on the basis of any information found on this channel, expressed or implied herein, are committed at your own risk, financial or otherwise.

GBPUSD LONG TERM GBPUSD Live Trading Session/ GBPUSD analysis #forex #forextraining #forexHello Traders
In This Video GBPUSD HOURLY Forecast By World of Forex
today GBPUSD Analysis
This Video includes_ (GBPUSD market update)
GBPUSD Analysis today | Technical and Order Flow
#usdjpy #usdchftechnicalanalysis #usdjpytoday #gold
What is The Next Opportunity on GBPUSD Market
how to Enter to the Valid Entry With Assurance Profit?
This Video is For Trader's that Want to Improve Their Technical Analysis Skills and Their Trading By Understanding How To Analyze The Market Using Multiple Timeframes and Understanding The Bigger Picture on the Charts.
Disclaimer: Financial Trading Has Large Potential Rewards, But Also Large Potential Risk. You must be aware of the Risk and Be Welling to Accept Them in order to Trade the Financial Market . Please be Carefully With Your Money.
We are talking about future market, anything can Happen,Markets are Always like that.dnt Risky more Than 2% of your account
Now you can join with our "vip premium" service
Join us and let's make trading together

GBPUSD Long From Rising Support !
HI,Traders !
#GBPUSD is trading along
The rising support line
And the pair will soon hit
A trend-line from where we
Will be expecting a local
Bullish rebound and a
Further bullish move up !
Comment and subscribe to help us grow !

GBPUSD Resistance Ahead!
HI,Traders !
#GBPUSD made a rebound
From the support and went
Up but will now retest a
Local horizontal level
Of 1.36793 from where
We will be expecting
A local bearish reaction !
Comment and subscribe to help us grow !

Market Trap Alert! GBP/USD Bearish Robbery Plan🔥💸 "The Cable Heist" – GBP/USD Robbery Plan Using Thief Trading Style 💸🔥
— Unfiltered Forex Forecast with Risky Intentions —
🌍 Hey Money-Makers, Market Hustlers & Chart Bandits! 🤑✈️
Hola! Bonjour! Marhaba! Hallo! Ciao! Welcome to the Forex streets where the smart rob the charts, not banks.
Ready for the GBP/USD Heist? Let’s break it down with our infamous Thief Trading Style – raw, unapologetic, and built for profits.
💼 Operation Name: “The Cable Forex Bank Robbery”
🎯 Pair: GBP/USD – aka “The Cable”
⚔️ Style: Scalp / Day Trade / Swing Heist
📊 Bias: Short (Bearish Setup)
🛠 STRATEGY SETUP: "Follow the Shadows"
🔍 Analysis Basis:
Smart-Money Traps at Key Levels
Oversold ≠ Reversal (Read between the candles)
Liquidity Hunting Zones
Retail Stop Clusters Exposed
Thief-style DCA Entries (Staggered Entry Levels)
Multi-timeframe Confirmation
COT, Sentiment & News-Driven Volatility
🎯 ENTRY ZONE:
Enter short (sell) using 15M or 30M chart.
Sell Limits near recent highs (pullback zone).
DCA (Layered Entry) recommended – Thief loves catching price slipping.
Let the liquidity work for us.
🛑 STOP LOSS (SL):
Base SL around 1.36200 on 2H Chart – above swing high.
Adjust SL per position size and total entries.
Manage risk, but remember: thieves don’t panic, they plan!
🎯 TARGET ZONE:
TP near 1.33800 or adjust using price action.
Escape before target if market mood flips – no need to be greedy.
Trail SLs if market momentum dies down.
👀 Scalpers' Special Note:
Only SHORT — don’t mess with long side unless you’re a liquidity donor.
Quick ins & outs. If you're loaded with capital, jump in big – else follow the swing team.
Use trailing SLs for safety — protect the loot.
📢 FUNDAMENTALS TO WATCH:
News Impacting GBP/USD
COT Reports
Sentiment Indicators
Macro Trends / Yield Spreads
US Dollar Strength Index (DXY)
UK Economic Reports (CPI, GDP, Rate Decisions)
⚠️ RISK MANAGEMENT TIPS:
🚨 Avoid new entries during news releases
🚨 Use trailing stops during volatility spikes
🚨 Secure running trades before major announcements
🚀 Boost the Robbery – Support the Strategy
💖 Smash that BOOST BUTTON if you're vibing with this setup. Help the Thief crew grow stronger!
Let’s keep milking the market 💸 – one “heist” at a time. Stay dangerous, stay smart.
🔓 NOTE: This isn't investment advice. Just a wild trading idea from a chart outlaw.
Always DYOR – Do Your Own Robbery (Research).
Market conditions shift fast. Stay alert, adapt, and respect your capital.
#ForexThiefStyle #CableHeist #GBPUSDShort #SmartMoneyMoves #LiquidityHunters #ChartOutlaws #TradingRebels #DayTradeLife #ScalpersParadise #ForexGang #FXHeistPlans

U.K. GDP Report: What It Means for GBPUSD CMCMARKETS:GBPUSD
Today, the U.K. Office for National Statistics (ONS) 📊 will release its monthly Gross Domestic Product (GDP) report 🗓️ at 6:00 a.m. UTC ⏰, likely impacting the British Pound (GBP) and GBP pairs globally 🌍.
🧐 What is GDP, and why does it matter?
GDP (Gross Domestic Product) 💡 measures the total value of all goods and services produced within a country’s economy over a specific period. It is a key indicator of economic health 🏥, influencing central bank decisions, investor sentiment, and currency valuations.
A higher-than-expected GDP 🆙 suggests a strong economy, which can support the currency 💪, while a lower-than-expected GDP 🆘 indicates weakness, often pressuring the currency lower 🔻.
📈 Market Expectations:
The market forecasts UK GDP growth to rise by 0.1% for May 🗓️, but we anticipate the increase may be smaller than expected 📉, implying a potential bearish surprise for GBPUSD.
⚡️ Trade Setup:
🔻 SELL Stop: 1.35330
❌ Stop Loss: 1.35714
✅ Take Profit: 1.34946
Risk-reward ratio: 1:1 ⚖️
🚨 Why Sell Here?
🔸 A weaker-than-expected GDP could lead to a pullback in GBPUSD below 1.3500 🚦.
🔸 Technical levels align with potential downside opportunities.
🔸 Volatility expected during and after the data release — manage risk carefully! ⚠️
📌 Stay tuned for live updates and analysis following the data release!
💬 Support this post if it helps your trading decisions! 🔔

GBP/USD Outlook: Can Buyers Step Back In?Hi everyone,
GBP/USD continues to consolidate below the 1.36200 level, with multiple failed attempts to break higher confirming this area as firm resistance for now. Following the rejection, price moved lower into the 1.35300–1.34600 demand zone, where we’re watching closely for signs of renewed buying interest.
This area has previously acted as a support base, and a reaction here could set the stage for another push higher. However, if buyers fail to step in, there is scope for a deeper retracement before the next attempt to reclaim resistance. We’ll be monitoring the price action closely to see which scenario plays out.
A drop into this area was highlighted as the more probable short‑term path, and we’re now looking for GBP/USD to find support in this region; and more importantly, to hold above the 1.33800 level to form the base for another push higher.
As previously noted, a decisive break above 1.37500 would renew our expectation for further upside, with the next key target around 1.38400. We'll be monitoring price action closely to see how it unfolds.
We’ll continue to provide updates on the projected path for GBP/USD as price approaches this target.
The longer-term outlook remains bullish, and we expect the rally to continue extending further from the 1.20991 January low towards 1.40000 and 1.417000.
We’ll be keeping you updated throughout the week with how we’re managing our active ideas. Thanks again for all the likes/boosts, comments and follows — we appreciate the support!
All the best for the week ahead. Trade safe.
BluetonaFX

GBPUSD BUY TRADEBuy Opportunity on GBPUSD
ENTRY: 1.35900
STOPLOSS: 1.35600
TAKEPROFIT: 1.37000
OUR FUND MANAGEMENT SYSTEM
We only manage (trade) clients fund. It's the responsibility of clients to deposit into their trading account with their preferred broker.
Your Minimum capital must be $100
COMMENT YOUR OPINION
Contact me on X @shajudeakinoba1

Intraday Drop into Support Zone — Can GBP/USD Bounce?Hi everyone,
GBP/USD continues to consolidate below the 1.36850 level. Price failed to break above and moved lower into the 1.35300–1.34600 zone, providing us with a clean intraday trade setup.
A drop into this area was highlighted as the more probable short‑term path, and we’re now looking for GBP/USD to find support in this region; and more importantly, to hold above the 1.33800 level to form the base for another push higher.
As previously noted, a decisive break above 1.37500 would renew our expectation for further upside, with the next key target around 1.38400. We'll be monitoring price action closely to see how it unfolds.
We’ll continue to provide updates on the projected path for GBP/USD as price approaches this target.
The longer-term outlook remains bullish, and we expect the rally to continue extending further from the 1.20991 January low towards 1.40000 and 1.417000.
We’ll be keeping you updated throughout the week with how we’re managing our active ideas. Thanks again for all the likes/boosts, comments and follows — we appreciate the support!
All the best for the week ahead. Trade safe.
BluetonaFX

#GBPUSD: A strong bullish move incoming, comment your views The price has shown a possible price divergence, which could lead to a long-term move to 1.37. We expect the US dollar to weaken, which will likely push the price of GBPUSD to our target. Key economic data will be released later today and tomorrow, which could shape the price pattern.
Good luck and trade safely!
Team Setupsfx_

GBPUSD BUY OPPORTUNITY Buy GBPUSD Now. It on key level
Entry: 1.35800
Stoploss: 1.35600
Take profit: 1.3700
Comment your opinion now.
For Fund Management Contact me on X @shajudeakinoba1

Market Analysis: GBP/USD DipsMarket Analysis: GBP/USD Dips
GBP/USD failed to climb above 1.3800 and corrected some gains.
Important Takeaways for GBP/USD Analysis Today
- The British Pound is showing bearish signs below the 1.3700 support against the US dollar.
- There is a key bearish trend line forming with resistance near 1.3650 on the hourly chart of GBP/USD at FXOpen.
GBP/USD Technical Analysis
On the hourly chart of GBP/USD at FXOpen, the pair failed to stay above the 1.3750 pivot level. As a result, the British Pound started a fresh decline below 1.3720 against the US Dollar.
There was a clear move below 1.3700 and the 50-hour simple moving average. The bears pushed the pair below 1.3650. Finally, there was a spike below the 1.3600 support zone. A low was formed near 1.3562 and the pair is now consolidating losses.
There was a minor move above the 1.3615 level. On the upside, the GBP/USD chart indicates that the pair is facing resistance near the 1.3650 level. There is also a key bearish trend line forming with resistance near 1.3650.
The next major resistance is near the 50% Fib retracement level of the downward move from the 1.3788 swing high to the 1.3562 low at 1.3675. A close above the 1.3670 resistance zone could open the doors for a move toward the 1.3700 zone. The 61.8% Fib retracement level is at 1.3700. Any more gains might send GBP/USD toward 1.3790.
On the downside, there is a key support forming near 1.3615. If there is a downside break below the 1.3615 support, the pair could accelerate lower. The next major support is near the 1.3560 zone, below which the pair could test 1.3500. Any more losses could lead the pair toward the 1.3440 support.
This article represents the opinion of the Companies operating under the FXOpen brand only. It is not to be construed as an offer, solicitation, or recommendation with respect to products and services provided by the Companies operating under the FXOpen brand, nor is it to be considered financial advice.
