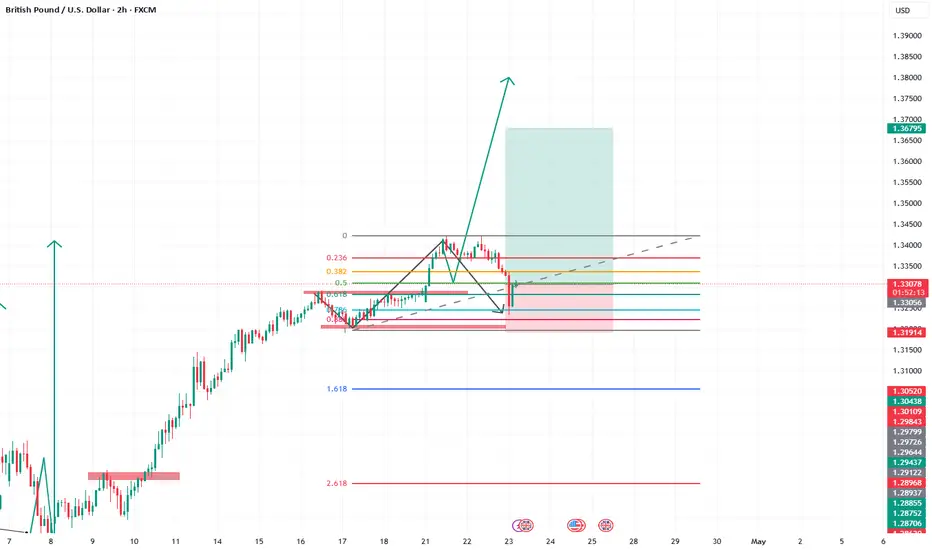
GBPUSD SHORT FORECAST Q2 W17 D23 Y25 1' ENTRY MODEL EDUCATIONGBPUSD SHORT FORECAST Q2 W17 D23 Y25 1' ENTRY MODEL EDUCATION
Professional Risk Managers👋
Welcome back to another FRGNT chart update📈
Diving into some Forex setups using predominantly higher time frame order blocks alongside confirmation breaks of structure.
Let’s see what price action is telling us today!
💡Trade confluences📝
✅Weekly Order block rejection
✅15’ order block created
✅15’ wick rejections via order block
✅Intraday bearish breaks of structure
✅Tokyo ranges to be filled
✅1’ break of structure
✅1’ bearish engulfing candle fill
✅Sell limit order on the 1’ candle fill
✅Sell limit order via 1' order block created upon 1' break of structure
🔑 Remember, to participate in trading comes always with a degree of risk, therefore as professional risk managers it remains vital that we stick to our risk management plan as well as our trading strategies.
📈The rest, we leave to the balance of probabilities.
💡Fail to plan. Plan to fail.
🏆It has always been that simple.
❤️Good luck with your trading journey, shall see you at the very top.
🎯Trade consistent, FRGNT X
Gbpusd_forecast

GBPUSD LONG/BUYBy utilizing Fibonacci retracement levels, historical patterns, , we can formulate a hypothesis that the market might follow a similar trajectory if bullish sentiment prevails.
Massive Rally, Massive Resistance – Time to Sell GBPUSD?The last two weeks felt like a rollercoaster for GBPUSD. It all started with a gap down on Monday, April 7, but that weakness didn’t last. The pair filled the gap and then rallied hard – over 700 pips!
🤔 Key Question – Is the move sustainable, or are we topping out?
Now the pair is approaching a massive resistance zone, one that dates back to 2019. While the bullish sentiment and USD weakness could push it toward 1.3500, this isn’t a breakout I’d blindly chase.
📉 Why I'm expecting a reversal:
Price is entering a long-term resistance area – a major barrier.
700 pips of upside happened fast – a pullback is likely.
USD weakness might fade, creating downward pressure.
1.3450–1.3500 is my key sell zone.
📊 My Trading Plan:
I’ll be watching for clear signs of weakness near 1.3450 – such as rejection candles or slowing momentum. If the market confirms, I’m looking for a 500 pip move down, with 1.3000 as the first major target.
Disclosure: I am part of Trade Nation's Influencer program and receive a monthly fee for using their TradingView charts in my analyses and educational articles.

#GBPUSD: Massive Swing Sell Is In Making 1200+ Pips Worth? **FX:GBPUSD Price Analysis**
GBPUSD price has recently experienced an overbought condition, primarily due to the significant decline of the DXY index. This decline can be attributed to the ongoing trade dispute between China and the United States, which has resulted in a drop in the DXY index to its lowest point in the past eighteen months.
Conversely, the GBP has gained strength due to positive economic indicators indicating robust growth in the United Kingdom. This has made the GBP more attractive to investors.
The FX:GBPUSD price is expected to continue its upward trend and potentially reach the 1.35 level. However, it is also possible for the price to reverse its direction from this point.
**Targets:**
If the trade is activated, three targets have been set for the FX:GBPUSD price. These targets can be adjusted based on your own analysis and trading strategy.
We extend our sincere gratitude for your unwavering support and well wishes.
Best regards,
Team Setupsfx_

#GBPUSD: Two Prominent Buying Points! Will Dxy Bounce Back? Due to strong economic data supporting GBP, its price has been bullish throughout the week, especially since DXY plunged. Given ongoing trade tensions, we may see another higher high. This is risky, so please analyse it yourself.
Like and comment to support us in bringing more analysis.
Have a great weekend! ❤️
Team Setupsfx_

GBPUSD SHORT FORECAST Q2 W16 D18 Y25GBPUSD SHORT FORECAST Q2 W16 D18 Y25
Fun Coupon Friday!
Summary
- Weekly order block short set up
- Awaiting clear shift in price action to downside
- C setup - Short from 5' order block with confluence of daily high wick fill prior turn over in price.
- B Setup - 15' break of structure anticipating 15' creation order block creation. Solid point of interest to short from
A Setup - Multiple 15' break of structure plus all of the above
FRGNT X

GBPUSD:SIGNALHello friends
Given the good growth we had, we can buy within the specified support ranges with capital and risk management because buyers reacted well after the price correction and this could be the beginning of a good growth.
*Trade safely with us*

GBPUSD SHORT FORECAST Q2W W16 D17 Y25GBPUSD SHORT FORECAST Q2W W16 D17 Y25
GM GM!
- Potential 15' OB Short
- Potential 5' OB Short, lower time frame Break of structure via level
- Potential
SUMMARY
- Weekly order block rejection is the setup
- Required 15' Breaks of structure
FRGNT X

Market Analysis: GBP/USD Rockets HigherMarket Analysis: GBP/USD Rockets Higher
GBP/USD is gaining pace above the 1.3220 resistance.
Important Takeaways for GBP/USD Analysis Today
- The British Pound is attempting a fresh increase above 1.3220.
- There is a key bullish trend line forming with support near 1.3245 on the hourly chart of GBP/USD at FXOpen.
GBP/USD Technical Analysis
On the hourly chart of GBP/USD at FXOpen, the pair remained well-bid above the 1.2850 level. The British Pound started a decent increase above the 1.3000 zone against the US Dollar.
The bulls were able to push the pair above the 50-hour simple moving average and 1.3150. The pair even climbed above 1.3200 and traded as high as 1.3263. It is now consolidating gains and trading well above the 23.6% Fib retracement level of the upward move from the 1.3030 swing low to the 1.3263 high.
On the upside, the GBP/USD chart indicates that the pair is facing resistance near 1.3260. The next major resistance is near 1.3320. A close above the 1.3320 resistance zone could open the doors for a move toward 1.3450.
Any more gains might send GBP/USD toward 1.3500. On the downside, there is a key support forming near a bullish trend line at 1.3245.
If there is a downside break below 1.3245, the pair could accelerate lower. The next major support is at 1.3145. It is close to the 50% Fib retracement level of the upward move from the 1.3030 swing low to the 1.3263 high.
The next key support is seen near 1.3030, below which the pair could test 1.2860. Any more losses could lead the pair toward the 1.2745 support.
This article represents the opinion of the Companies operating under the FXOpen brand only. It is not to be construed as an offer, solicitation, or recommendation with respect to products and services provided by the Companies operating under the FXOpen brand, nor is it to be considered financial advice.

Inflation in the UK Has FallenInflation in the UK Has Fallen
According to Forex Factory, the Consumer Price Index (CPI) reading came in below expectations: while analysts had forecast a decline to 2.7% year-on-year from the previous 2.8%, the actual CPI figure was 2.6%.
Following the release of this news, the GBP/USD exchange rate rose to 1.3280 – the highest level in seven months.
On the one hand, falling inflation is a sign of a healthy economy and a relief for the Bank of England, especially considering that CPI stood in double digits just two years ago. As a result, analysts may now predict that interest rates could be cut at the meeting scheduled for 8 May.
On the other hand, demand for the dollar remains volatile due to Trump’s tariff policies, fears of a US recession, and a wave of bond sell-offs.
Technical Analysis of the GBP/USD Chart
In just one week, the pound-to-dollar rate has risen by approximately 4.2%, with the RSI indicator now hovering near extreme overbought levels. Furthermore, the price is approaching the upper boundary of the ascending channel, which has been in play since the beginning of 2025.
In such conditions, a correction (with a bearish breakout of the ascending trendline, shown in blue) appears a logical development. However, a key factor in sustaining the current trend of dollar weakness could be the speech by Federal Reserve Chair Jerome Powell, scheduled for today at 20:30 GMT+3.
This article represents the opinion of the Companies operating under the FXOpen brand only. It is not to be construed as an offer, solicitation, or recommendation with respect to products and services provided by the Companies operating under the FXOpen brand, nor is it to be considered financial advice.

GBPUSD SHORT FORECAST Q2 W16 D16 Y25GBPUSD SHORT FORECAST Q2 W16 D16 Y25
Thoughts- It's not if, it's WHEN !
All longs are null until the weekly order block has been breached or price drops considerably. In the here and now the short seems to be closing in.
It is as always important to stack confluences in favour of the short prior risking capital.
15' break of structure is an absolute requirement as this point of price action.
Within the higher time frame order block- looking for a lower time frame order block is not enough to short from therefore scrolling back months to find is pointless in our opinion.
We will let price show us, we will reaction with price.
What are your thoughts...
Are we dropping today?
FRGNT X

CAD JPY Entry Setup 1 hour timeframe On the 1 hour timeframe CAD JPY has formed a demand level around price 102.000.
Now we wait for price to drop into the demand level before looking for buying opportunities
Entry will be base on candlestick confirmation.

GBP/USD Ready to Fly! 📢 GBP/USD Ready to Fly! 🚀
📈 Looking bullish from Weekly Bullish FVG 50% Level 🎯
✅ Waiting for confirmation before entry!
🎯 Target: Bearish Extreme Order Block
🔥 Don't miss the move! Stay updated – Follow our TradingView page! 📊

GBP/USD "The Cable" Forex Bank Heist Plan (Swing / Day Trade)🌟Hi! Hola! Ola! Bonjour! Hallo! Marhaba!🌟
Dear Money Makers & Robbers, 🤑 💰💸✈️
Based on 🔥Thief Trading style technical and fundamental analysis🔥, here is our master plan to heist the GBP/USD "The Cable" Forex Market. Please adhere to the strategy I've outlined in the chart, which emphasizes long entry. Our aim is the high-risk Red Zone. Risky level, overbought market, consolidation, trend reversal, trap at the level where traders and bearish robbers are stronger. 🏆💸"Take profit and treat yourself, traders. You deserve it!💪🏆🎉
Entry 📈 : "The heist is on! Wait for the MA breakout (1.30500) then make your move - Bullish profits await!"
however I advise to Place Buy stop orders above the Moving average (or) Place buy limit orders within a 15 or 30 minute timeframe most recent or swing, low or high level.
📌I strongly advise you to set an "alert (Alarm)" on your chart so you can see when the breakout entry occurs.
Stop Loss 🛑: "🔊 Yo, listen up! 🗣️ If you're lookin' to get in on a buy stop order, don't even think about settin' that stop loss till after the breakout 🚀. You feel me? Now, if you're smart, you'll place that stop loss where I told you to 📍, but if you're a rebel, you can put it wherever you like 🤪 - just don't say I didn't warn you ⚠️. You're playin' with fire 🔥, and it's your risk, not mine 👊."
📍 Thief SL placed at the recent/swing low level Using the 4H timeframe (1.27000) Swing/Day trade basis.
📍 SL is based on your risk of the trade, lot size and how many multiple orders you have to take.
🏴☠️Target 🎯: 1.35000 (or) Escape Before the Target
🧲Scalpers, take note 👀 : only scalp on the Long side. If you have a lot of money, you can go straight away; if not, you can join swing traders and carry out the robbery plan. Use trailing SL to safeguard your money 💰.
💰💵💸GBP/USD "The Cable" Forex Market Heist Plan (Swing/Day) is currently experiencing a bullishness,., driven by several key factors. 👇👇👇
📰🗞️Get & Read the Fundamental, Macro, COT Report, Quantitative Analysis, Sentimental Outlook, Intermarket Analysis, Future trend targets... go ahead to check 👉👉👉🔗🔗
⚠️Trading Alert : News Releases and Position Management 📰 🗞️ 🚫🚏
As a reminder, news releases can have a significant impact on market prices and volatility. To minimize potential losses and protect your running positions,
we recommend the following:
Avoid taking new trades during news releases
Use trailing stop-loss orders to protect your running positions and lock in profits
💖Supporting our robbery plan 💥Hit the Boost Button💥 will enable us to effortlessly make and steal money 💰💵. Boost the strength of our robbery team. Every day in this market make money with ease by using the Thief Trading Style.🏆💪🤝❤️🎉🚀
I'll see you soon with another heist plan, so stay tuned 🤑🐱👤🤗🤩

My take on GBPUSD as of 11:23am 4/9/2025Market Insights from Indicators
Trend and Movement
Directional Indicators:
PLUS_DI (25.39) significantly outweighs MINUS_DI (5.54), indicating strong bullish momentum.
Directional Movement Index (DX: 64.15) confirms significant trend strength.
Aroon Oscillator (71.43) shows a healthy trend with potential upward movement.
Moving Averages:
EMA (1.3126), KAMA (1.31498), and TEMA (1.31703) remain above the current price, reinforcing a longer-term bearish bias.
However, shorter-term indicators like PLUS_DI and ROC suggest consolidation or temporary bullish moves.
Momentum and Oscillators:
RSI (68.12) reflects a mildly overbought condition, signaling possible resistance to bullish moves.
MACD (0.0052) and CMO (36.24) support short-term bullish momentum.
Williams %R (-29.19) and CCI (87.28) indicate price nearing resistance levels.
Volatility and Price Action
ATR (0.00356) suggests low volatility, allowing tighter stop-loss and target levels.
Price action is currently testing the support zone at 1.2780–1.2790 and resistance near 1.2830–1.2850.
Trend Analysis
Short-term momentum shows rising highs and closes, with support from bullish indicators like DX (~64).
Long-term bearish bias persists due to EMA, DEMA, and TEMA above the current price.
Key Levels:
Support: 1.2780–1.2790 (previous hourly lows).
Resistance: 1.2830–1.2850 (aligned with recent highs and trend indicators).
Directional Indicators and Oscillators:
Bullish dominance with PLUS_DI (29.18) outweighing MINUS_DI (12.42).
Momentum (MOM ~0.00877) supports short-term bullish opportunities.
Stochastic (45.48) and Stochastic RSI (26.07) indicate moderate upward momentum, but not extreme levels yet.
Volatility and Risk Indicators
True Range (TRANGE ~0.00354) indicates limited hourly price variability.
Moving averages like TEMA (1.31703), T3 (1.31303), and WMA (1.31403) reinforce long-term bearish resistance above 1.3140.
TSF (1.31757) points to strong resistance near 1.3170.
Key Events to Watch
April 9, 2025 (Today):
USD FOMC Minutes (High Impact): A hawkish tone could strengthen the USD, pushing GBP/USD lower, while a dovish approach may support GBP/USD gains.
April 10, 2025 (Tomorrow):
USD Inflation Data: Lower CPI or core inflation figures may weaken the USD and favor GBP/USD bullish moves.
Jobless Claims: Rising claims could signal labor market weakness, further pressuring the USD.
April 11, 2025 (Friday):
GBP GDP & Trade Balance: Positive data could strengthen the GBP, aligning with bullish chart patterns.
USD PPI & Consumer Sentiment: Higher producer prices or sentiment could support USD recovery.
Trading Considerations
FOMC Impact: Hawkish minutes may trigger bearish GBP/USD moves, while a dovish tone supports a bullish outlook.
Key Levels: Watch 1.2780–1.2790 (support) and 1.2830–1.2850 (resistance) for trading decisions.
Volatility Management: ATR (~0.00356) suggests tight stop-losses during high-impact news.
My Take
Given the bullish technical setup but acknowledging the risk from upcoming high-impact news, I lean toward caution. At this point of my trading career i'm not comfortable with aggressive trading. A well-defined long trade near 1.279–1.280 could be rewarding—but i'm prepared for rapid moves on news releases.
Aggressive Option: Enter long around support now with tight stops and target 1.283–1.285, but be very nimble in managing your position amid the news.
Conservative Option: Wait for the market to digest the FOMC minutes and inflation data, then look for a confirmed breakout or reversal that aligns with the bullish technical signals.
I think ill wait for the news... it's in about 2 hours. see ya then!

GBP/USD Is About to Explode – Here’s Why This Level Matters🚨 GBP/USD at a Critical Zone – Breakout or Reversal?
Let’s break down the price action from a technical perspective 👇
📊 Daily Technical Analysis – GBP/USD (April 2025)
The GBP/USD pair is trading near a key inflection point, with price action hinting at a potential breakout — or a deeper correction.
📈 Trend Overview:
The broader trend remains bullish, following a steady rally from the 1.2300 area back in February. The pair has been forming higher highs and higher lows, indicating strong underlying demand.
However, we’re now seeing signs of bullish exhaustion as the price struggles near the 1.2850 – 1.2900 resistance zone — an area that previously acted as a strong supply level.
🧱 Key Resistance Levels:
1.2850 – 1.2900: Major resistance zone; a daily close above this level would likely accelerate bullish momentum.
1.3000: Psychological round number and the next natural target.
1.3140: Historical swing high from mid-2023, could serve as the next upside objective.
🛡️ Key Support Levels:
1.2680: Previous higher low and potential first line of defense.
1.2520: Strong structural support — a break below this zone may shift the medium-term outlook to neutral or even bearish.
1.2300: February’s key low and the base of the current trend.
📐 Technical Structures:
Price appears to be forming an ascending triangle — a classic bullish continuation pattern — with flat resistance at 1.2850 and rising higher lows from below. This supports the idea of an impending breakout if bulls regain control.
Additionally, the pair is moving within a rising price channel, offering clean structure for both trend-following and breakout traders.
🧭 Potential Scenarios:
✅ Bullish Breakout:
A confirmed close above 1.2900 would likely open the door toward 1.3000, followed by 1.3140. This scenario aligns with the current market structure, assuming continued weakness in the USD or sustained risk appetite.
❌ Bearish Rejection:
Failure to break the resistance zone, especially with bearish reversal candles, could trigger a drop toward 1.2680, and possibly 1.2520. A daily close below 1.2520 would be a strong technical warning for bulls.
📌 Conclusion:
GBP/USD is sitting at a technically significant level. The prevailing trend favors the bulls, but the outcome at 1.2850–1.2900 will be decisive. Watch price action closely for confirmation — breakout or rejection, the next move could be sharp.
💬 What’s your take on this setup? Do you see a breakout or a reversal ahead? Drop your thoughts in the comments 👇

GBPUSD Watch – Bearish Momentum Building Below Supply ZoneGBPUSD pair has broken sharply below the long-standing accumulation range between 1.2857 – 1.3012, signaling a shift in market sentiment. The recent bearish engulfing structure has pushed price into a corrective pullback phase, with sellers likely to re-enter on rallies.
Key Technical Levels:
Current Price: 1.2795
Resistance (Supply Zone): 1.2857 – 1.2863
First Support Target: 1.2688 – 1.2690
Mid-Level Target: 1.2568 – 1.2570
Final Bearish Target: 1.2383 – 1.2390 (demand zone & key support)
Trade Scenario:
📉 Bearish Bias:
Price is expected to retrace into the supply zone (1.2857–1.2863) and then reject.
If resistance holds and structure remains intact, expect continuation toward:
TP1: 1.2689
TP2: 1.2568
TP3: 1.2385
🔁 Invalidation Zone:
A sustained break and close above 1.2863 would invalidate the bearish setup and could trigger a move toward 1.3012.
Technical Confluence:
✅ Previous consolidation turned into a strong resistance zone
✅ Bearish breakout from range
✅ Clean lower highs and lower lows structure
✅ Volume drop on the pullback (likely a corrective move)

GBPUSD Bearish Breakout !
HI,Traders !
GBPUSD broke the rising
Support line and the breakout
Is confirmed so we are
Bearish biased and we
Will be expecting a
Further move down !
Comment and subscribe to help us grow !

GBPUSD: A 1300+| Pips Swing Move One Not To Miss! USD has dominated the market which ultimately taking price of some of the pair to record low and at discounted zone. Although, we should wait for price to breakthrough the inducement line and then enter with accurate risk management.
Team Setupsfx_

Will GBPUSD reverse in 2025?Dear Traders,
Hope you are enjoying the holidays, we are getting ready for the new year and in meantime we have identified a key level emerging on GU that will possible shape the price next couple of months. Looking at the detailed of how price behaved in these last two months. We can expect USD exhaustion. Good luck.

GBPUSD: 700+ Pips Swing Buy! Get ready for big moveDear Traders,
GBPUSD our first few ideas are up and running in profit of 700+ pips, we are expecting bullish move to continue dominating the market. Now we think price is likely to remain bullish for next few weeks, while wee may also notice some correction in the market.
Want to support us?
-Please like and comment our ideas which will encourage us to post more educative posts like this. ;)
Thank you

GBPUSD: 2000+ Pips Buying Opportunity! Dear Traders,
Hope you are doing great, we have an excellent buying opportunity on GU which worth up to 2000 pips. Please wait for price to make correction and enter accordingly. Use accurate risk management.

GBP/USD Technical & Fundamental AnalysisThis chart presents a long (buy) trade setup on GBP/USD (British Pound to US Dollar) 30-minute timeframe.
Technical Analysis
1. Entry & Stop Loss (SL) 🛑
Entry Zone: 1.29050 - 1.29100 (Purple Support Area)
Stop Loss: Below 1.28850 (Red Box)
2. Target Zones 🎯
Target 1: 1.29300 – Minor resistance, suitable for first take-profit (TP1).
Target 2: 1.29500 – Stronger resistance level.
Target 3: 1.29700 – Major resistance area, final take-profit (TP3).
3. Market Structure & Price Action 📈
The price reacted to the entry zone, a support level.
A retest of previous demand zones before potential bullish continuation.
Risk-to-Reward Ratio (RRR): Favorable, as upside potential is greater than downside risk.
Bullish Confirmation: If price holds above the 1.29050 zone, an upward move is likely.
Recent Fundamental Factors Affecting GBP/USD
1. UK Economic Data 🇬🇧
UK GDP Growth: Slower growth than expected, but still in positive territory.
Bank of England (BoE) Policy: No immediate rate cuts, keeping GBP stable.
UK Inflation: Still above target, supporting a stronger GBP.
2. US Economic Data 🇺🇸
Federal Reserve (Fed) Policy:
Mixed signals from the Fed—some officials hint at rate cuts later this year.
If the Fed pauses or cuts rates, GBP/USD could rise.
US Non-Farm Payrolls (NFP) Data:
Expected to show job market resilience. A strong NFP could push USD higher, pressuring GBP/USD.
US GDP Data:
Slower-than-expected growth could weaken USD, helping GBP.
3. Market Sentiment 🌍
Risk-On vs. Risk-Off:
If investors shift to risk-on sentiment (buying stocks, GBP), GBP/USD could move higher.
If risk-off sentiment dominates (buying USD as a safe haven), GBP/USD may struggle.
Conclusion & Trading Plan
✅ Buy near 1.29050 - 1.29100 with SL below 1.28850.
✅ Take Profits: TP1 (1.29300), TP2 (1.29500), TP3 (1.29700).
✅ Monitor: US economic data, Fed rate expectations, and risk sentiment.
