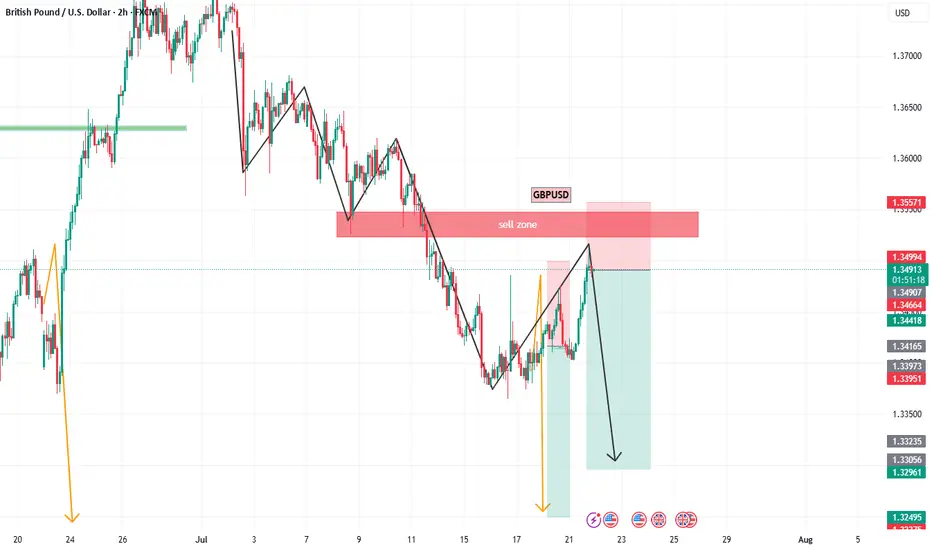
GBP/USD 4H Bearish Reversal Setup. GBP/USD 4H Chart Analysis (July 24, 2025):
Price is rejecting resistance near 1.35709, forming a bearish setup. A short position is highlighted with entry around 1.35067, stop loss above resistance, and target near the 1.33786 support zone. Bears aim for continuation toward 1.33745.
Gbpusdanalysis

GBPUSD BUY IDEAWe will be looking into taking the buys as per the chart. I hope this is an idea that resonates with you. Happy trading days
GBPUSD BUYGBP/USD drops to 1.3450 area after weak UK Retail Sales data
GBP/USD continues to push lower after closing in negative territory on Thursday and trades near 1.3450 on Friday. Weaker-than-expected Retail Sales data from the UK and the broad-based US Dollar strength forces the pair to stay on the back foot heading into the weekend
GBP/USD came under bearish pressure on Thursday and lost more than 0.5%, snapping a three-day winning streak in the process. The pair extends its slide on Friday and trades below 1.3500.
The renewed US Dollar (USD) strength weighed on GBP/USD on Thursday. The US Department of Labor reported that the number of first-time applications for unemployment benefits declined to 217,000 in the week ending July 19 from 221,000 in the previous week. This reading came in better than the market expectation of 227,000. Additionally, the S&P Global Composite Purchasing Managers Index (PMI) improved to 54.6 (preliminary) in July from 52.9 in June, reflecting an ongoing expansion in the private sector's business activity, at an accelerating pace.
Meanwhile, the EUR/GBP cross rose more than 0.3% on Thursday as the Euro benefited from the European Central Bank's (ECB) cautious tone on policy-easing. EUR/GBP preserves its bullish momentum and trades at its highest level since early April above 0.8700 on Friday, suggesting that the Euro continues to capture capital outflows out of Pound Sterling.
Early Friday, the UK's Office for National Statistics reported that Retail Sales rose by 0.9% on a monthly basis in June. This reading followed the 2.8% decrease recorded in May but came in worse than the market expectation for an increase of 1.2%, making it difficult for GBP/USD to stage a rebound.
In the second half of the day, Durable Goods Orders data for June will be the only data featured in the US economic calendar. Nevertheless, this data is unlikely to have a long-lasting impact on the USD's valuation.
SUPPORT 1.34550
SUPPORT 1.34982
SUPPORT 1.35421
RESISTANCE 1.33990
RESISTANCE 1.33698

GBPUSD(20250725)Today's AnalysisMarket news:
The European Central Bank announced that it would maintain the three key interest rates unchanged, reiterated data dependence, warned that the external environment is highly uncertain, and President Lagarde did not rule out the possibility of future rate hikes. Traders reduced their bets on ECB rate cuts.
Technical analysis:
Today's buying and selling boundaries:
1.3532
Support and resistance levels:
1.3618
1.3586
1.3565
1.3499
1.3479
1.3447
Trading strategy:
If the price breaks through 1.3532, consider buying, with the first target price at 1.3565
If the price breaks through 1.3499, consider selling, with the first target price at 1.3479

DeGRAM | GBPUSD reached the resistance level📊 Technical Analysis
● Price rejected the rising-channel base at 1.3434 (green arrows) and has broken the eight-day corrective down-trend, restoring the series of higher-lows.
● A new impulse is aiming at the mid-June swing/ channel crest 1.3592; a measured move from the breakout projects the upper rail near 1.3773. Pull-backs toward 1.3500-1.3520 should attract bids while the inner up-sloper holds.
💡 Fundamental Analysis
● Softer US PMI prices pulled 2-yr Treasury yields off highs, trimming USD support, while UK retail-sales surprise (+0.7 % m/m) tempered BoE-cut bets, underpinning sterling.
✨ Summary
Long 1.3500-1.3520; hold above 1.3592 targets 1.3770. Invalidate on a 4 h close below 1.3434.
-------------------
Share your opinion in the comments and support the idea with a like. Thanks for your support!

GU-Wed-23/07/25 TDA-Cluster of PMI news now, watch out!Analysis done directly on the chart!
Premise:
A simple idea plan (like Tradingview public posts) won't describe everything.
No one can predict how market will move, it's always good to react to how it moves.
It gives an idea of how price might move, but no one come from FUTURE.
So I always encourage people to openly and actively discuss in real time.
I don't give signals blindly, people should learn
and understand the skill.
Following blindly signals you won't know how to
manage the trade, where precisely put sl and tp,
lot size and replicate the move over time.
That's why you need active real time discussions.
Trading is not get rich quick scheme!
Active in London session!
Not financial advice, DYOR.
Market Flow Strategy
Mister Y

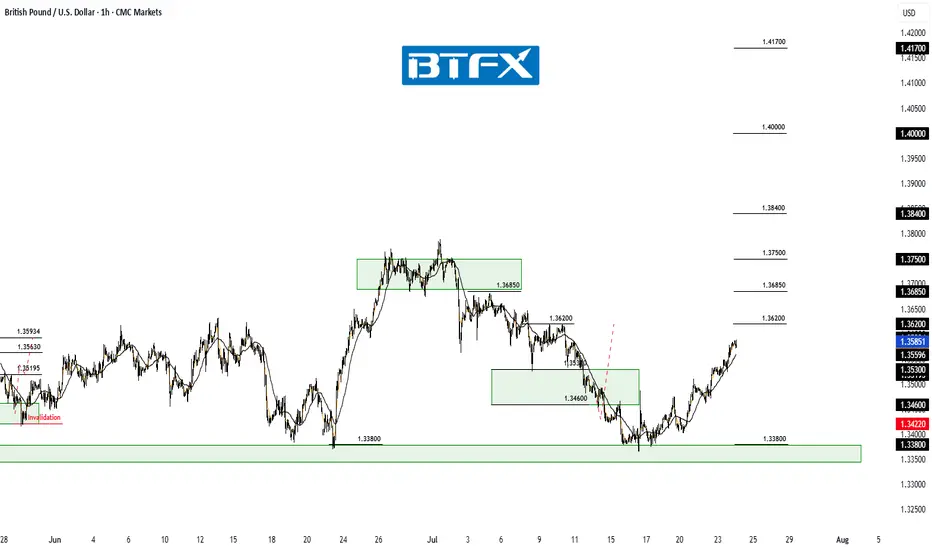
GBP/USD Rebounds from Support — Eyes on Resistance BreakHi everyone,
GBP/USD has bounced off structural support and continued to move higher, showing signs of renewed buying interest.
This zone has previously acted as a strong support base, and the current reaction suggests there may be scope for further upside toward the previous consolidation levels above.
A decisive break above 1.37500 would reinforce our bullish outlook, with the next key target around 1.38400. We’ll be monitoring price action closely to see how this develops in the sessions ahead.
The longer-term outlook remains bullish, and we expect the rally to continue extending further from the 1.20991 January low towards 1.40000 and 1.417000.
We’ll be keeping you updated throughout the week with how we’re managing our active ideas. Thanks again for all the likes/boosts, comments and follows — we appreciate the support!
All the best for the week ahead. Trade safe.
BluetonaFX
Short Opportunity on GBPUSD – Technical & Fundamentals AlignToday I want to look at the Short position opportunity in GBPUSD ( FX:GBPUSD ). So let's take a look at the GBPUSD pair from a fundamental and technical perspective.
Fundamental Analysis:
The British Pound remains under pressure due to growing expectations of a 25–50 bps rate cut by the Bank of England in early August. Markets are increasingly leaning toward easing as UK inflation hit 3.6% in June, the highest in over a year, while economic growth weakened and consumer confidence dropped to its lowest since early 2024
Ongoing fiscal concerns, including potential tax hikes and budget instability, continue to weigh on the pound. In contrast, the US Dollar( TVC:DXY ) remains relatively robust—supported by strong economic data and a safe-haven preference amid global uncertainty
Summary:
BoE easing becomes more likely due to weak UK data and inflation.
Fiscal risks and low consumer sentiment add downward pressure on GBP.
USD strength from solid data and safe-haven demand supports further GBPUSD downside.
-------------------------
In terms of technical analysis , in the 1-hour timeframe , GBPUSD is approaching the Resistance zone($1.356-$1.350) , the Potential Reversal Zone(PRZ) , and the 50_SMA(Daily) . Meanwhile, this return to Important Support lines could act as a pullback to these lines. Important support lines and 50_SMA(Daily) were broken last week.
In terms of Elliott Wave theory , GBPUSD appears to be completing a main wave 4 . Main wave 4 is likely to have a Zigzag Correction(ABC/5-3-5) .
I expect GBPUSD to start declining from the Potential Reversal Zone(PRZ) and reach the targets I have marked on the chart.
Note: Stop Loss(SL): 1.3575USD = Worst Stop Loss(SL)
Please respect each other's ideas and express them politely if you agree or disagree.
British Pound / U.S Dollar Analysis (GBPUSD), 1-hour time frame.
Be sure to follow the updated ideas.
Do not forget to put a Stop loss for your positions (For every position you want to open).
Please follow your strategy and updates; this is just my Idea, and I will gladly see your ideas in this post.
Please do not forget the ✅' like '✅ button 🙏😊 & Share it with your friends; thanks, and Trade safe.

GBPUSD(20250723)Today's AnalysisMarket news:
White House officials plan to visit the Federal Reserve headquarters on Thursday local time.
Technical analysis:
Today's buying and selling boundaries:
1.3507
Support and resistance levels:
1.3578
1.3552
1.3534
1.3480
1.3463
1.3436
Trading strategy:
If it breaks through 1.3534, consider buying, the first target price is 1.3552
If it breaks through 1.3507, consider selling, the first target price is 1.3480

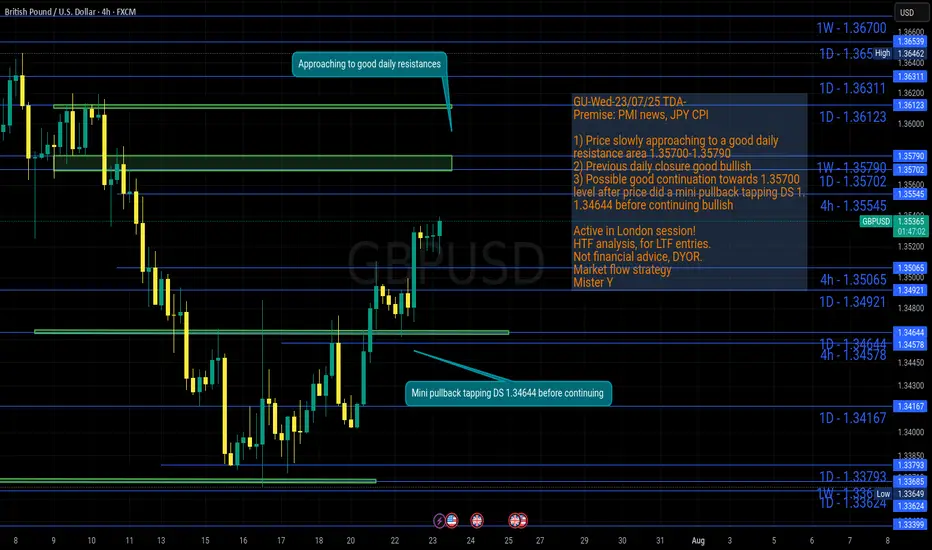
GU-Wed-23/07/25 TDA-GU approaching to a good resistance zoneAnalysis done directly on the chart!
Premise:
A simple idea plan (like Tradingview public posts) won't describe everything.
No one can predict how market will move, it's always good to react to how it moves.
It gives an idea of how price might move, but no one come from FUTURE.
So I always encourage people to openly and actively discuss in real time.
I don't give signals blindly, people should learn
and understand the skill.
Following blindly signals you won't know how to
manage the trade, where precisely put sl and tp,
lot size and replicate the move over time.
That's why you need active real time discussions.
Trading is not get rich quick scheme!
Active in London session!
Not financial advice, DYOR.
Market Flow Strategy
Mister Y
GBPUSD - Looking To Sell Pullbacks In The Short TermH4 - Strong bearish move.
No opposite signs.
Currently it looks like a pullback is happening.
Expecting bearish continuation until the two Fibonacci resistance zones hold.
If you enjoy this idea, don’t forget to LIKE 👍, FOLLOW ✅, SHARE 🙌, and COMMENT ✍! Drop your thoughts and charts below to keep the discussion going. Your support helps keep this content free and reach more people! 🚀
--------------------------------------------------------------------------------------------------------------------

GBP/USD Long Setup: Loot & Escape Before Bears Attack!🏴☠️ GBP/USD HEIST ALERT: "The Cable" Bank Robbery Plan! 💰🚨
Thief Trading Strategy | Swing/Day Trade | High-Risk, High-Reward Loot!
🤑 DEAR MARKET PIRATES & MONEY SNATCHERS!
Based on our 🔥Thief Trading Masterplan🔥, we’re targeting the GBP/USD ("The Cable") for a bullish heist! Police barricades (resistance) are risky, but overbought markets = consolidation = TREND REVERSAL TRAP! Bears are strong here, but smart robbers take profits early!
🎯 Mission: LONG ENTRY + ESCAPE BEFORE THE POLICE (SELLERS) ARRIVE!
🔓 ENTRY: "VAULT IS OPEN!"
📍 Bullish Loot Zone: Swipe longs at any price—but smart thieves use Buy Limits near 15M/30M swing lows for pullback entries!
📍 Pro Thief Move: DCA/Layering strategy (multiple limit orders for max loot).
🛑 STOP LOSS: "DON’T GET CAUGHT!"
📍 SL @ Recent Swing Low (4H): 1.33700 (Adjust based on your risk, lot size, & entry layers!).
📍 Day/Swing Trade? Tighten SL if scalping!
🎯 TARGETS: "LOOT & BOUNCE!"
✅ 1.37700 (Main Heist Target)
✅ Scalpers: Trail SL & escape early!
✅ Swing Bandits: Hold for bigger payout!
📢 THIEF’S FUNDAMENTAL INTEL
Why GBP/USD? Bullish momentum from:
Macro Trends (COT Report, Sentiment, Liquidity Zones)
Intermarket Signals (Stocks, Bonds, Commodities)
News Trap Alerts (Avoid high-impact news chaos!)
🚨 THIEF’S GOLDEN RULES
✔ AVOID NEWS VOLATILITY! (No new trades during releases)
✔ TRAILING SL = SAFE ESCAPE ROUTE! (Lock profits like a pro)
✔ BOOST THIS IDEA! 💥 More boosts = stronger heist crew!
💎 FINAL WARNING
This is a HIGH-RISK heist! Only risk what you can lose.
Market conditions change FAST! Adapt or get caught.
Not advice—just a pirate’s plan! Do your own analysis.
🚀 NEXT HEIST COMING SOON… STAY TUNED, ROBBERS! 🏴☠️💸

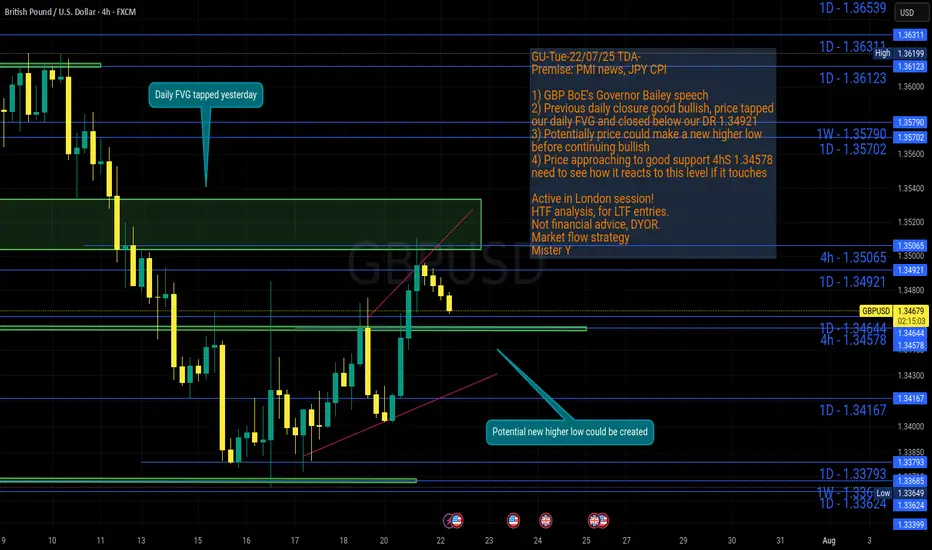
GU-Tue-22/07/25 TDA-Potential new higher low before continue?Analysis done directly on the chart!
Price gave a good bullish closure on daily candle yesterday,
if bullish trend continues, there's a good probability for price
to create a new higher low before continuing up.
Monitor and react to how price move from level to level.
Premise:
A simple idea plan (like Tradingview public posts) won't describe everything.
No one can predict how market will move, it's always good to react to how it moves.
It gives an idea of how price might move, but no one come from FUTURE.
So I always encourage people to openly and actively discuss in real time.
I don't give signals blindly, people should learn
and understand the skill.
Following blindly signals you won't know how to
manage the trade, where precisely put sl and tp,
lot size and replicate the move over time.
That's why you need active real time discussions.
Trading is not get rich quick scheme!
Active in London session!
Not financial advice, DYOR.
Market Flow Strategy
Mister Y
GBPUSD Short on PullbackGBPUSD has been trending down since the start of the July and we can look to get short on retests of the 1.3524-1.3539 area which has acted previously as support and hasn't been retested since we broke down
This area also ties in with the 38.2% retracement from the highs
Stops need to be above 1.3550
Targets can be initially to 1.3450-134.65 with potential to move back to 1.3368-1.3383 and maybe even lower
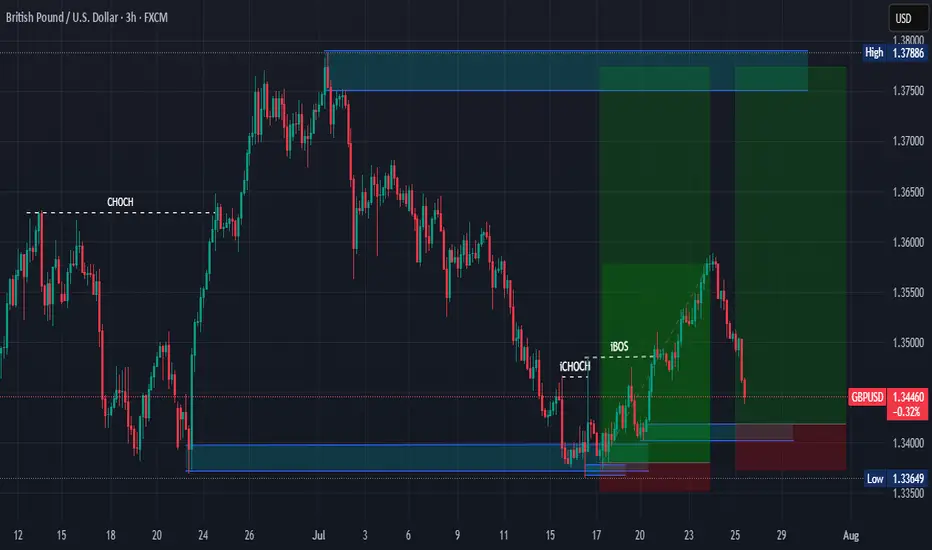
GBP/USD: Post-Impulse Sell Setup from Ending DiagonalThe chart depicts a completed 5-wave impulsive structure, culminating at the top of wave (5). The internal wave structure of the final fifth wave forms a classic ending diagonal pattern, typically signaling a trend reversal or deep correction.
After this extended fifth wave, the price has started rolling over, confirming the start of a corrective decline. The wave count now expects an ABC correction targeting the previous wave 4/2 demand zone, highlighted in red.
Target 1 (T1): 1.33608
Target 2 (T2): 1.32436
Stop Loss (SL): 1.35988
Ending diagonal at the top of wave (5) signals exhaustion of bullish momentum.
Clear bearish divergence (not shown here) is commonly seen with this pattern.
The price has broken the short-term structure and is now forming lower highs.
Target zone aligns with previous wave 2 consolidation – a typical retracement zone for post-impulse corrections.

GBPUSD BUYGBP/USD trims some gains, back to the sub-1.3500 area
On Monday, GBP/USD recovered some of its recent losses and rose to multi-day highs over the 1.3500 yardstick, just to deflate a tad afterwards. The improving market sentiment makes it harder for the Greenback to find demand at the start of the week, allowing Cable to regain some lost balance.
GBP/USD pulled away from the 20-period Simple Moving Average (SMA) on the 4-hour chart after fluctuating at around that level earlier in the day and the Relative Strength Index (RSI) indicator rose above 50, highlighting a loss of bearish momentum.
Looking north, the first resistance level could be spotted 1.3470 (Fibonacci 50% retracement, 50-period SMA) ahead of 1.3500 (static level, round level) and 1.3540 (Fibonacci 38.2% retracement). On the downside, support levels could be seen at 1.3400-1.3390 (round level, Fibonacci 61.8% retracement) and 1.3300 (Fibonacci 78.6% retracement).
SUPPORT 1.352
SUPPORT 1.355
SUPPORT 1.358
RESISTANCE 1.344
GBPUSD SELLBy utilizing levels, historical patterns, , we can formulate a hypothesis that the market might follow a similar trajectory if bearish sentiment prevails.
GBPUSD(20250721)Today's AnalysisMarket news:
Waller refused to comment on whether he would dissent at the July meeting, saying that the private sector was not performing as well as people thought, and said that if the president asked him to be the chairman of the Federal Reserve, he would agree.
Technical analysis:
Today's buying and selling boundaries:
1.3427
Support and resistance levels:
1.3502
1.3474
1.3456
1.3398
1.3380
1.3351
Trading strategy:
If the price breaks through 1.3427, consider buying in, with the first target price of 1.3456
If the price breaks through 1.3398, consider selling in, with the first target price of 1.3380

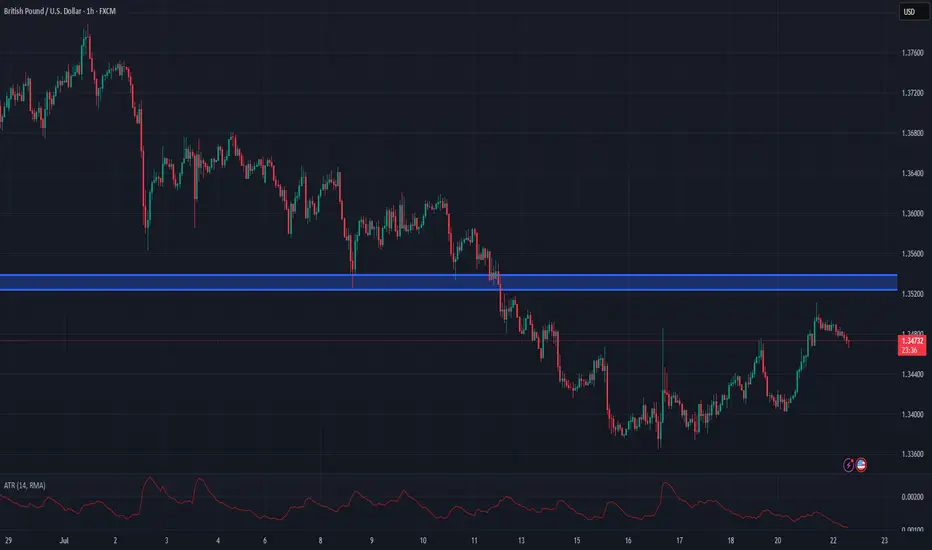
Bullish Momentum Builds Above $1.3475 for GBP/USDFenzoFx—GBP/USD is testing the descending trendline as resistance. The primary trend is bullish, and if bulls close and stabilize above $1.3475, the uptrend will likely resume.
If this scenario unfolds, the next bullish target could be the resistance at $1.3525. Please note that the bullish outlook should be invalidated if GBP/USD closes and stabilizes below $1.3369.

Market Analysis: GBP/USD Dips FurtherMarket Analysis: GBP/USD Dips Further
GBP/USD started a downside correction from the 1.3620 zone.
Important Takeaways for GBP/USD Analysis Today
- The British Pound started a fresh decline and settled below the 1.3500 zone.
- There is a connecting bullish trend line forming with support at 1.3415 on the hourly chart of GBP/USD at FXOpen.
GBP/USD Technical Analysis
On the hourly chart of GBP/USD at FXOpen, the pair struggled above the 1.3600 zone. The British Pound started a fresh decline below the 1.3550 pivot level against the US Dollar, as discussed in the previous analysis.
The pair dipped below the 1.3500 and 1.3450 levels. A low was formed at 1.3364 and the pair is now consolidating losses. On the upside, it is facing resistance near the 1.3475 level. The next key resistance is near 1.3490 and the 50% Fib retracement level of the downward move from the 1.3619 swing high to the 1.3364 low.
An upside break above the 1.3490 zone could send the pair toward 1.3520 and the 61.8% Fib retracement level.
More gains might open the doors for a test of 1.3620. If there is another decline, the pair could find support near the 1.3415 level and a connecting bullish trend line. The first major support sits near the 1.3365 zone.
The next major support is 1.3350. If there is a break below 1.3350, the pair could extend the decline. The next key support is near the 1.3320 level. Any more losses might call for a test of 1.3250.
This article represents the opinion of the Companies operating under the FXOpen brand only. It is not to be construed as an offer, solicitation, or recommendation with respect to products and services provided by the Companies operating under the FXOpen brand, nor is it to be considered financial advice.

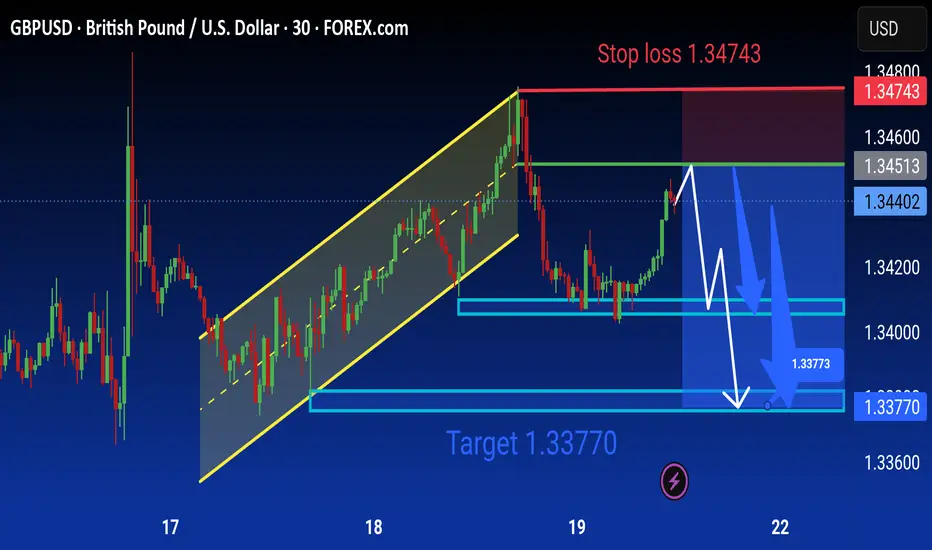
Gbpusd Analysis is Ready Move will be down technical analysis of the GBP/USD (British Pound/US Dollar) currency pair on the 30-minute timeframe using FOREX.com data. Here's a detailed breakdown of the analysis:
---
Chart Summary:
Current Price:
Sell: 1.34401
Buy: 1.34406
Timeframe: 30 minutes (M30)
Platform: TradingView with FOREX.com data
Technical Elements:
1. Ascending Channel (Yellow Parallel Lines):
Price was previously moving in an upward trend within this ascending channel.
The breakout to the downside indicates a potential trend reversal or correction.
2. Bearish Scenario (Blue Arrows):
The chart suggests a short (sell) setup.
Price is expected to face resistance around the 1.34513–1.34600 zone (marked by the green line).
A projected downward move is illustrated with blue arrows, targeting 1.33770.
3. Stop Loss:
Positioned at 1.34743 (highlighted in red), above the recent highs — managing risk for the sell position.
4. Support Zones (Blue Boxes):
First support area near 1.34000
Second, stronger support and main target at 1.33770
5. Target Label:
“Target 1.33770” is clearly marked in blue, showing the final expected move of the sell trade.
6. Forecast Path (White Lines):
Indicates potential short-term bullish pullback before continuing the bearish trend.
---
Trade Idea:
Sell GBP/USD near current resistance
Stop Loss: 1.34743
Take Profit (Target): 1.33770
Bias: Bearish short-term, following the channel breakout
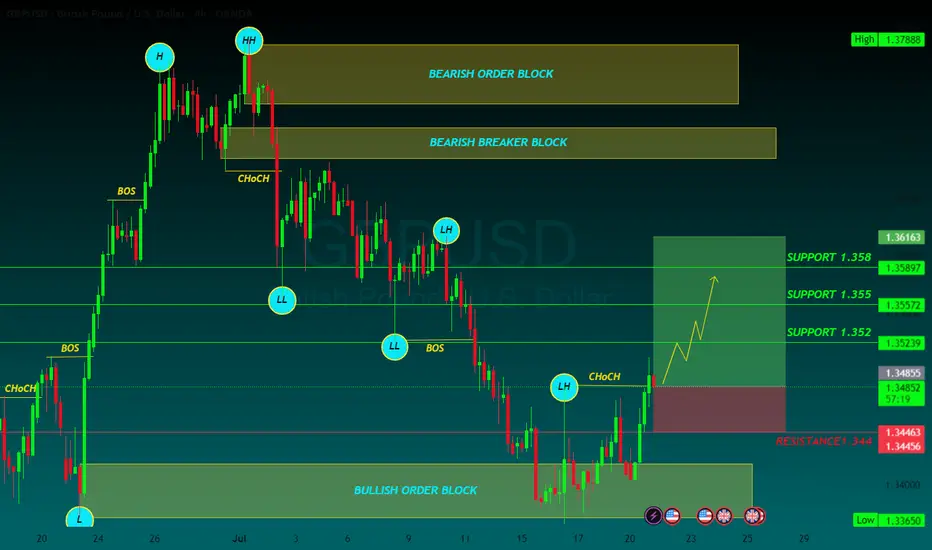
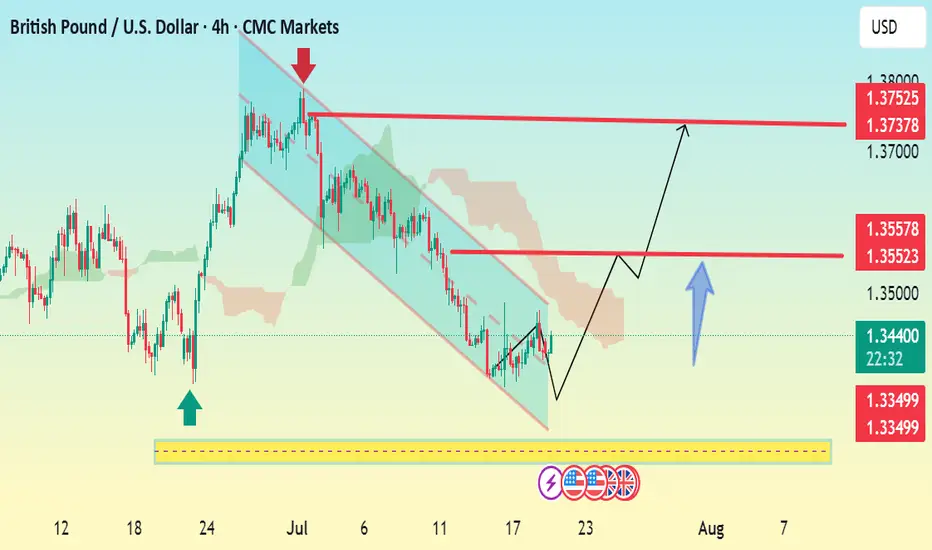
GBP/USD 4H Bullish Reversal Setup Analysis:The chart shows GBP/USD breaking out of a descending channel, signaling a potential bullish reversal.
Price has bounced from a strong support zone (highlighted in yellow), with bullish momentum building.
The breakout is backed by a higher low structure, which often precedes an uptrend continuation.
Key Levels:
Support: 1.3349
First Resistance / TP1: 1.3552–1.3557
Final Target / TP2: 1.3737–1.3752
Outlook:
If price holds above 1.3439 and breaks 1.3552 with volume, the next leg toward 1.3750 is likely.
Watch for retests of the breakout level for confirmation before entering long.
📈 Bias: Bullish above 1.3439
🕐 Timeframe: 4H chart
Let me know if you want SL (stop loss) and entry suggestions too.
GU-Mon-21/07/25 TDA-More consolidation,are we about to breakout?Analysis done directly on the chart!
Nothing lasts forever, the longer it consolidates
the easier the breakout will be.
Premise:
A simple idea plan (like Tradingview public posts) won't describe everything.
No one can predict how market will move, it's always good to react to how it moves.
It gives an idea of how price might move, but no one come from FUTURE.
So I always encourage people to openly and actively discuss in real time.
I don't give signals blindly, people should learn
and understand the skill.
Following blindly signals you won't know how to
manage the trade, where precisely put sl and tp,
lot size and replicate the move over time.
That's why you need active real time discussions.
Trading is not get rich quick scheme!
Active in London session!
Not financial advice, DYOR.
Market Flow Strategy
Mister Y
