GBPUSD(20250514)Today's AnalysisMarket news:
The U.S. unadjusted CPI annual rate unexpectedly dropped to 2.3% in April, the lowest since February 2021.
Technical analysis:
Today's buying and selling boundaries:
1.3262
Support and resistance levels:
1.3408
1.3353
1.3318
1.3205
1.3170
1.3115
Trading strategy:
If the price breaks through 1.3318, consider buying, the first target price is 1.3353
If the price breaks through 1.3262, consider selling, the first target price is 1.3205
Gbpusdanalysis

GBPUSD Brace for a Sharp Drop to 1.3000! Free signal!Hello everyone.
I want share my idea about GBPUSD.
The U.S.-China trade deal breakthrough has fueled USD strength, pressuring GBP/USD after a surge to 1.3330. BoE’s dovish stance, with a potential 25 bps rate cut priced in, contrasts with a hawkish Fed, favoring USD. Upcoming UK CPI and U.S. CPI data this week could drive volatility—soft UK inflation may weaken GBP, while high U.S. inflation could bolster USD further. UK wage growth (5.9%) offers GBP support, but weak PMI and employer sentiment cap gains. Watch U.S.-UK trade deal news for potential GBP upside.
With technical we can see last week we had some consolidation and this week started with high volatility and brake support. at the moment price testing resistance + 4h FVG.
Scenario 1 (Bearish – Primary View): Price rejects the 1.3200–1.3275 FVG/resistance zone and resumes its downtrend, targeting the next major support at 1.3000—a psychological and structural level. This aligns with USD strength from the trade deal and BoE’s dovish stance . Trade Setup: Short below 1.3200, target 1.3000, stop above 1.3300 (above FVG).
Scenario 2 (Bullish – Less Likely): Buyers break above the FVG (1.3275) and 1.3300, targeting 1.3350–1.3400. This would require a catalyst like soft U.S. CPI data weakening USD, but current fundamentals favor bears.
Trade Setup:
Entry below - 1.3190 (current price 1.32048) ensures confirmation of rejection.
Stop above - 1.3280 (above FVG) protects against a bullish breakout.
Target - I will follow trend with trail stop.
For collaboration text me private!
Always make your own research!!!

GBPUSD: Strong Sell Momentum Built Up! What is next?GBPUSD is building strong sell momentum, increasing sell volume. At the same time, DXY is in correction mode, so keep that in mind. If DXY plummets again, it may invalidate our first entry. However, there’s a second entry that could be a safer zone for those looking for a stable entry.
There are three take profit targets that can be set according to your trading plan. This analysis doesn’t guarantee that the price will move as described.
Good luck and trade safely!
Thank you for your unwavering support! 😊
If you’d like to contribute, here are a few ways you can help us:
- Like our ideas
- Comment on our ideas
- Share our ideas
Team Setupsfx_
❤️🚀

GU-Tue-13/05/25 TDA-Flash news, bearish continuation before CPI!Analysis done directly on the chart
Sharing live trade updates!
Flash news yesterday to cause the price to continue
the bearish momentum breaking through strong
supports.
SOURCE: Financial Juice
If you are a daytrader (even if aren't) you should be
aware of flash news that can happen at any time and
cause price to move suddenly.
Not financial advice, DYOR.
Market Flow Strategy
Mister Y

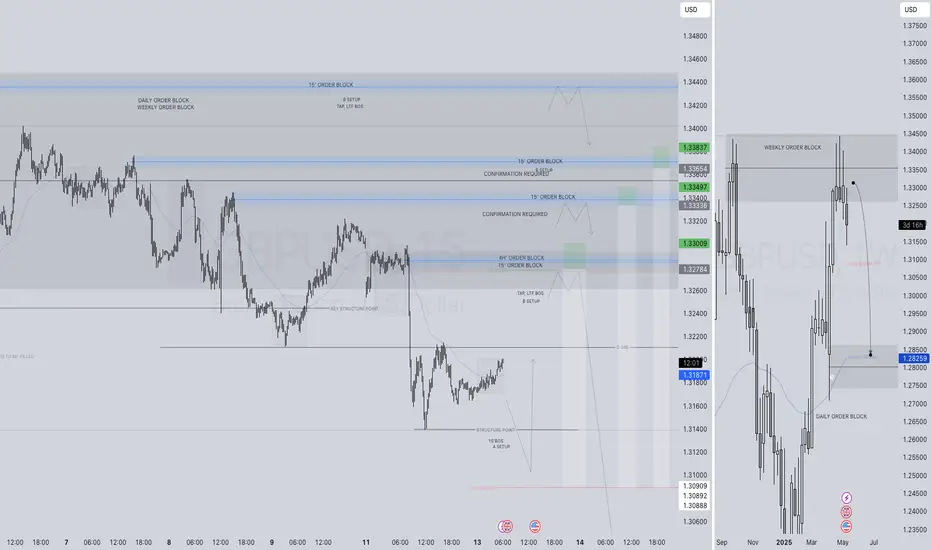
GBPUSD SHORT FORECAST Q2 W20 D13 Y25GBPUSD SHORT FORECAST Q2 W20 D13 Y25
Professional Risk Managers👋
Welcome back to another FRGNT chart update📈
Diving into some Forex setups using predominantly higher time frame order blocks alongside confirmation breaks of structure.
Let’s see what price action is telling us today!
💡Here are some trade confluences📝
✅Weekly order block rejection
✅Daily order block rejection
✅Intraday 15' order blocks
✅Tokyo ranges to be filled
🔑 Remember, to participate in trading comes always with a degree of risk, therefore as professional risk managers it remains vital that we stick to our risk management plan as well as our trading strategies.
📈The rest, we leave to the balance of probabilities.
💡Fail to plan. Plan to fail.
🏆It has always been that simple.
❤️Good luck with your trading journey, I shall see you at the very top.
🎯Trade consistent, FRGNT X
GBP/USD Multi-Timeframe Summary (May 13–17):GBP/USD Multi-Timeframe Summary (May 13–17):
On the daily chart, GBP/USD faces strong resistance at 1.345–1.350 (double-top) and support near 1.280–1.290. The recent pullback to 1.320 aligns with the 61.8% retracement of the April–May rally.
On the hourly chart, price is consolidating in a falling channel between 1.318–1.336, with a bear trap on May 8 indicating demand near the lows. A clean hourly break above 1.336 suggests momentum toward 1.345, while a break below 1.318 targets the 1.300–1.290 daily demand zone.
The 15-minute chart shows a V-reversal from 1.314, followed by a tight flag between 1.318–1.322. This zone offers short-term breakout or fade trades.
Key levels:
Resistance: 1.336, 1.345
Support: 1.318, 1.312, 1.290
Trade triggers: Buy >1.322, Sell <1.318 (tight stops, 15–30 pip targets)
Strategy:
Scalp intraday flags on 15′, trade hourly range extremes, and watch for a breakout from the daily structure.

GBPUSD INVERSE CUP AND HANDLE PATTERNTechnical Overview
Resistance Level: 1.34400
Support Level: 1.27500
Bearish Targets: 1.30200 and 1.28800
The resistance at 1.34400 represents the peak before the formation of the inverted cup, serving as a critical level where selling pressure may intensify. The support at 1.27500 aligns with the neckline of the pattern; a decisive break below this level would confirm the bearish breakout, potentially leading to the projected targets.
📉 Trading Strategy
Consider entering a short position upon a confirmed break below the 1.27500 support level, accompanied by increased trading volume to validate the breakout.
Place a stop-loss order above the handle's peak, near 1.34400, to protect against false breakouts and limit potential losses.

GBPUSD is in the Selling DirectionHello Traders
In This Chart GBPUSD HOURLY Forex Forecast By FOREX PLANET
today GBPUSD analysis 👆
🟢This Chart includes_ (GBPUSD market update)
🟢What is The Next Opportunity on GBPUSD Market
🟢how to Enter to the Valid Entry With Assurance Profit
This CHART is For Trader's that Want to Improve Their Technical Analysis Skills and Their Trading By Understanding How To Analyze The Market Using Multiple Timeframes and Understanding The Bigger Picture on the Charts

GBPUSDToday's other trade opportunity comes from the GBPUSD pair.
The first days of the week usually don’t behave exactly as expected — there's often volatility, fake moves, and false breakouts.
That's why I prefer to approach Mondays with a lower risk appetite.
🔍 Criteria:
✔️ Timeframe: 15M
✔️ Risk-to-Reward Ratio: 1:2
✔️ Trade Direction: Sell
✔️ Entry Price: 1.32940
✔️ Take Profit: 1.32690
✔️ Stop Loss: 1.33066
🔔 Disclaimer: This is not financial advice. It's a trade I’m taking based on my own system, shared purely for educational purposes.
📌 If you're also interested in systematic and data-driven trading strategies:
💡 Don’t forget to follow the page and subscribe to stay updated on future analyses.

GBPUSD SHORT FORECAST Q2 W20 D12 Y25GBPUSD SHORT FORECAST Q2 W20 D12 Y25
Professional Risk Managers👋
Welcome back to another FRGNT chart update📈
Diving into some Forex setups using predominantly higher time frame order blocks alongside confirmation breaks of structure.
Let’s see what price action is telling us today!
💡Here are some trade confluences📝
✅Weekly order block rejection
✅Daily order block rejection
✅Intraday 15' order blocks
✅Tokyo ranges to be filled
🔑 Remember, to participate in trading comes always with a degree of risk, therefore as professional risk managers it remains vital that we stick to our risk management plan as well as our trading strategies.
📈The rest, we leave to the balance of probabilities.
💡Fail to plan. Plan to fail.
🏆It has always been that simple.
❤️Good luck with your trading journey, I shall see you at the very top.
🎯Trade consistent, FRGNT X

GBPUSD ANALYSISThe weekly candle rejected weekly resistance and closed as a doji for consecutive weeks, which could mean price could be transitioning to a bearish market. Overall price is still bullish, but it did form an H4 LH so I'd look for price to retrace to the H4 support. If price breaks & retest minor M15 support around 1.32970, I'd start looking for sells with my TP being 1.32100.

GU-Fri-9/05/25 TDA-Potential bearish continuationAnalysis done directly on the chart
More bearish structure will confirm the
bearish continuation (1h-4h). As of now, we still
reacting good on strong support!
Not financial advice, DYOR.
Market Flow Strategy
Mister Y

GBPUSD STRONG DOWNTRND PATTERNTechnical Analysis
1. Trend Overview:
The GBP/USD pair is in a strong bearish trend, confirmed by:
Price consistently forming lower highs and lower lows
Breakdown of key support zones(1.3200), turning them into new resistance (especially 1.34400)
Momentum oscillators and moving averages showing sustained downward pressure

GBPUSD - Liquidity Grab & BoS Signals Bearish ReversalSmart Money Concepts (SMC) Analysis
1. Liquidity Sweep & Break of Structure (BOS):
Price consolidates above a trendline with multiple rejections (blue lines).
A liquidity grab occurs below this trendline – classic inducement setup.
After the grab, a bearish BOS (break of structure) is confirmed with a strong candle closing below the trendline and recent lows.
2. Order Block:
Price retested a 4H bearish order block (grey shaded zone) before rejection. This OB aligns with the last bullish candle before the drop.
Rejection from the OB confirms institutional interest (SMC).
3. Imbalance / Fair Value Gap (FVG):
The drop left a minor imbalance zone, suggesting possible continuation down to fill the inefficiency.
Price Action Analysis:
1. Trendline Break:
Ascending trendline has been broken with strong bearish momentum.
Indicates a shift from higher lows to lower lows → possible trend reversal.
2. Supply Zone Respect:
The price failed to make a new high and was firmly rejected at resistance.
Double top or lower high formation adds bearish confluence.
3. Target & Risk-Reward:
The trade setup indicates a short entry just below trendline break.
Target around 1.29393, likely based on previous demand zone or liquidity pocket.
Stop above 1.33664, likely above the OB or structural high.
Solid RRR (>3:1) visible.
Confluences Supporting Bearish Bias:
Break of internal structure (Price Action)
Liquidity sweep below trendline (SMC)
Bearish Order Block rejection (SMC)
Strong bearish engulfing candle
Favourable RR trade plan
Conclusion:
This is a high-probability bearish setup combining a trendline liquidity sweep (inducement), break of structure, order block rejection, and efficient risk-reward positioning. The price is expected to target 1.29393, aligning with a previous demand or liquidity zone.
Thanks for your time..

GBP/USD is setting the stage for a deep correction — Don’t chaseA Smart Money trap is unfolding as price enters a major supply zone. Prepare for a sharp move.
GBP/USD is now testing a critical supply zone near 1.3300–1.3500, where institutional sellers are likely to activate.
According to Smart Money Concept (SMC) and Market Structure, we are anticipating a liquidity grab followed by a deep corrective move towards the 1.2500–1.2300 demand zone.
Key Insights:
– Major Supply Zone: 1.3300–1.3500 is the key area for potential reversals
– Expected Move: Short-term bullish exhaustion → Strong sell-off towards 1.2500
– Mid-Term Outlook: After the correction, bullish continuation possible but only from lower demand zones
– Strategy: Wait for bearish confirmation at supply zone before selling | Look for buying opportunities closer to 1.2300 if structure shifts bullish
Smart traders wait for clean entries

GBPUSD - UniverseMetta - Signal#GBPUSD - UniverseMetta - Signal
W1 - Formation of 3 stop candles from the level, which may indicate a potential change in trend.
D1 - Formation of the 3rd wave + 3rd fractal/peak. . Stop behind the maximum of the 2nd wave.
Entry: 1.32548
TP: 1.31381 - 1.30654 - 1.29492 - 1.27081
Stop: 1.34080
More signals in our groups

GU-Thu-8/05/25 TDA-Eyes on BoE possible rate cut 0.25%!Analysis done directly on the chart
If BoE cuts rate, more easing policy. Printing
more money, easier access to credit, lower
cost of borrowing.
Not financial advice, DYOR.
Market Flow Strategy
Mister Y

GBPUSD SHORT FORECAST Q2 W19 D8 Y25GBPUSD SHORT FORECAST Q2 W19 D8 Y25
Professional Risk Managers👋
Welcome back to another FRGNT chart update📈
Diving into some Forex setups using predominantly higher time frame order blocks alongside confirmation breaks of structure.
Let’s see what price action is telling us today!
💡Here are some trade confluences📝
✅Weekly order block rejection
✅Daily order block rejection
✅Intraday 15' order blocks
✅Tokyo ranges to be filled
🔑 Remember, to participate in trading comes always with a degree of risk, therefore as professional risk managers it remains vital that we stick to our risk management plan as well as our trading strategies.
📈The rest, we leave to the balance of probabilities.
💡Fail to plan. Plan to fail.
🏆It has always been that simple.
❤️Good luck with your trading journey, I shall see you at the very top.
🎯Trade consistent, FRGNT X

GBPUSD SHORT FORECAST Q2 W19 D7 Y25GBPUSD SHORT FORECAST Q2 W19 D7 Y25
Professional Risk Managers👋
Welcome back to another FRGNT chart update📈
Diving into some Forex setups using predominantly higher time frame order blocks alongside confirmation breaks of structure.
Let’s see what price action is telling us today!
💡Here are some trade confluences📝
✅Weekly order block rejection
✅Daily order block rejection
✅Intraday 15' order blocks
✅Tokyo ranges to be filled
🔑 Remember, to participate in trading comes always with a degree of risk, therefore as professional risk managers it remains vital that we stick to our risk management plan as well as our trading strategies.
📈The rest, we leave to the balance of probabilities.
💡Fail to plan. Plan to fail.
🏆It has always been that simple.
❤️Good luck with your trading journey, I shall see you at the very top.
🎯Trade consistent, FRGNT X

GBPUSD SHORT FORECAST Q2 W19 D6 Y25GBPUSD SHORT FORECAST Q2 W19 D6 Y25
Professional Risk Managers👋
Welcome back to another FRGNT chart update📈
Diving into some Forex setups using predominantly higher time frame order blocks alongside confirmation breaks of structure.
Let’s see what price action is telling us today!
💡Here are some trade confluences📝
✅Weekly order block rejection
✅Daily order block rejection
✅Intraday 15' order blocks
✅Tokyo ranges to be filled
🔑 Remember, to participate in trading comes always with a degree of risk, therefore as professional risk managers it remains vital that we stick to our risk management plan as well as our trading strategies.
📈The rest, we leave to the balance of probabilities.
💡Fail to plan. Plan to fail.
🏆It has always been that simple.
❤️Good luck with your trading journey, I shall see you at the very top.
🎯Trade consistent, FRGNT X

GU-Wed-7/05/25 TDA-CME group probability 95.6% unchanged rate!Analysis done directly on the chart
Here's the link for CME group FedWatch probability:
www.cmegroup.com
Not financial advice, DYOR.
Market Flow Strategy
Mister Y

GU-Tue-6/05/25 TDA-Tomorrow's Fed rate decision!Analysis done directly on the chart
Patience is key. Even when you're not
in a trade, have you ever asked why
price moved this way rather than other
ways at this specific time and period?
Knowing when not to trade or lower your
risks is as important as when you're placing
a trade simply because it can save you from
bad losses, mistakes.
Not financial advice, DYOR.
Market Flow Strategy
Mister Y

GBP/USD Short Trade Setup: Reversal from 1.34370 with Target at Entry Point:
Marked at 1.34370, where the analyst anticipates a reversal or price rejection.
Stop Loss:
Positioned above at 1.34975, covering a 2.62% risk margin. This is a protective level in case the price moves against the trade.
Target (Take Profit):
Set at 1.31015, just above a strong support zone around 1.30818. This is where the analyst expects the price to eventually fall.
Resistance Point:
Noted around 1.33007 – 1.32859, acting as an intermediate level of interest and possible price reaction zone.
