GU-Mon-5/05/25 TDA-Slowly approaching to daily support 1.32496Analysis done directly on the chart
Fed and BoE rate decision this week affecting
heavily on GU and other dollar and gbp related pairs.
Trade safe, stay informed with basic economic calendar
check. I personally use FXstreet economic calendar.
You can be very good at technical analysis but without
fundamental understanding you'll likely get a lot of stop
losses.
Not financial advice, DYOR.
Market Flow Strategy
Mister Y
Gbpusdanalysis

GBPUSD SHORT FORECAST Q2 W19 D5 Y25GBPUSD SHORT FORECAST Q2 W19 D5 Y25
Professional Risk Managers👋
Welcome back to another FRGNT chart update📈
Diving into some Forex setups using predominantly higher time frame order blocks alongside confirmation breaks of structure.
Let’s see what price action is telling us today!
💡Here are some trade confluences📝
✅Weekly order block rejection
✅Daily order block rejection
✅Intraday 15' order blocks
✅Tokyo ranges to be filled
🔑 Remember, to participate in trading comes always with a degree of risk, therefore as professional risk managers it remains vital that we stick to our risk management plan as well as our trading strategies.
📈The rest, we leave to the balance of probabilities.
💡Fail to plan. Plan to fail.
🏆It has always been that simple.
❤️Good luck with your trading journey, I shall see you at the very top.
🎯Trade consistent, FRGNT X

GBPUSD is in the Selling DirectionHello Traders
In This Chart GBPUSD HOURLY Forex Forecast By FOREX PLANET
today GBPUSD analysis 👆
🟢This Chart includes_ (GBPUSD market update)
🟢What is The Next Opportunity on GBPUSD Market
🟢how to Enter to the Valid Entry With Assurance Profit
This CHART is For Trader's that Want to Improve Their Technical Analysis Skills and Their Trading By Understanding How To Analyze The Market Using Multiple Timeframes and Understanding The Bigger Picture on the Charts

GBP/USD "The Cable" Forex Bank Heist Plan (Scalping / Day Trade)🌟Hi! Hola! Ola! Bonjour! Hallo! Marhaba!🌟
Dear Money Makers & Robbers, 🤑💰✈️
Based on 🔥Thief Trading style technical and fundamental analysis🔥, here is our master plan to heist the GBP/USD "The Cable" Forex Bank. Please adhere to the strategy I've outlined in the chart, which emphasizes short entry. Our aim is the high-risk Green Zone. Risky level, oversold market, consolidation, trend reversal, trap at the level where traders and bullish robbers are stronger. 🏆💸Book Profits Be wealthy and safe trade.💪🏆🎉
Entry 📈 : "The heist is on! Wait for the breakout (1.28877) then make your move - Bearish profits await!"
however I advise placing Sell Stop Orders below the breakout MA or Place Sell limit orders within a 15 or 30 minute timeframe. Entry from the most recent or closest low or high level should be in retest. I Highly recommended you to put alert in your chart.
📌I strongly advise you to set an "alert (Alarm)" on your chart so you can see when the breakout entry occurs.
Stop Loss 🛑: Thief SL placed at 1.29600 (swing / Day Trade Basis) Using the 2H period, the recent / swing high or low level.
SL is based on your risk of the trade, lot size and how many multiple orders you have to take.
Target 🎯: 1.27800 (or) Escape Before the Target
🧲Scalpers, take note 👀 : only scalp on the Short side. If you have a lot of money, you can go straight away; if not, you can join swing traders and carry out the robbery plan. Use trailing SL to safeguard your money 💰.
GBP/USD "The Cable" Forex Bank Heist Plan (Scalping / Day Trade) is currently experiencing a bearishness,., driven by several key factors.
📰🗞️Get & Read the Fundamental, Macro, COT Report, Quantitative Analysis, Sentimental Outlook, Intermarket Analysis, Future trend targets.. go ahead to check 👉👉👉
⚠️Trading Alert : News Releases and Position Management 📰 🗞️ 🚫🚏
As a reminder, news releases can have a significant impact on market prices and volatility. To minimize potential losses and protect your running positions,
we recommend the following:
Avoid taking new trades during news releases
Use trailing stop-loss orders to protect your running positions and lock in profits
💖Supporting our robbery plan 💥Hit the Boost Button💥 will enable us to effortlessly make and steal money 💰💵. Boost the strength of our robbery team. Every day in this market make money with ease by using the Thief Trading Style.🏆💪🤝❤️🎉🚀
I'll see you soon with another heist plan, so stay tuned 🤑🐱👤🤗🤩

GBP/USD Trend JudgmentTechnical Analysis of GBPUSD 4 - hour Chart
Support Level Analysis
Several key support levels are clearly marked in the chart. 1.32000 is a strong support level. If the price drops to this level, it may bounce back due to the buying support formed by past intensive trading 📈. 1.32400 is near the current price and also plays a certain supporting role. The price fluctuating around this level reflects the tug - of - war between bulls and bears here 🤼. 1.30200 is an important support level further down. Once the price breaks below 1.32000, it may further test this level 📉.
Target Level Analysis
The target area is around 1.34200. Judging from the chart trend, the price previously had upward - fluctuating momentum 💹. If the current price can break through the short - term downward trend and is accompanied by trading volume, and the bullish force continues to strengthen, the price is expected to move upward towards the 1.34200 target area 🚀. This target area is derived from the high points of previous price fluctuations and trend lines. It has certain resistance, but once broken, it can open up the upper space 🚪.
Trend Judgment
Currently, the price is in a relatively volatile downward trend, but the lower support levels may change the price trend. If the price obtains effective support at the support levels and forms a reversal signal (such as a bullish engulfing pattern, etc.) 📊, an upward trend is expected to start. Investors can pay attention to the performance of the price at the support levels. If the support is effective, they can try to go long, with the stop - loss set below the support level; if the price breaks below the support level, they can consider going short, with the target looking towards the lower support level 📌.
⚡⚡⚡ GBPUSD ⚡⚡⚡
🚀 Buy@1.32000 - 1.32400
🚀 TP 1.33500 - 1.34000
Accurate signals are updated every day 📈 If you encounter any problems during trading, these signals can serve as your reliable guide 🧭 Feel free to refer to them! I sincerely hope they'll be of great help to you 🌟 👇

GBPUSD TIME TO FALL HELLO TRADERS
GBPUSD has tested a strong resistence level zone and failed to break 1.34100 its also created a Cypher Harmonic pattren on daily chart the important level to break 1.32000 as soon as we will see the breakout forr this zone it will drop more till design levels chart is simple to read and we are look for ur comments and support Stay Tuned for more updates ....

GBP/USD Buy from 2hr demand zone?This week, my analysis for GU focuses on a potential buy opportunity from the 2H demand zone. Although this zone is still quite a distance from current price action, I’m patiently waiting to see which side of liquidity gets taken first — that will help highlight a more immediate area of interest.
Given the recent bearish movement, I’m anticipating a possible break of structure to the downside, targeting the underlying Asia lows. This move could create a new supply zone, which may present a more valid setup in the short term.
However, if price maintains its current trajectory, I’m also eyeing the 13H supply zone, which would offer a strong POI for future sell opportunities after a bullish correction.
Confluences for GU Buys:
- Price is approaching a 2H demand zone.
- Market has been bearish, suggesting a correction may be due.
- DXY analysis aligns with a potential GU recovery.
- Liquidity buildup points toward a possible retracement to the 13H supply zone.
P.S. If the week starts with a bullish move, that could offer a better setup for shorts later on as price approaches the higher supply zone. Stay alert and flexible with your setups — wishing everyone a strong and disciplined trading week!

GU-Fri-2/05/25 TDA-NFP day, mini downtrendAnalysis done directly on the chart
We are creating new lower structure towards
daily support. What's your view on the market?
Comment down below!
Not financial advice, DYOR.
Market Flow Strategy
Mister Y

Market Analysis: GBP/USD Corrects GainsMarket Analysis: GBP/USD Corrects Gains
GBP/USD started a downside correction from the 1.3450 zone.
Important Takeaways for GBP/USD Analysis Today
- The British Pound rallied above 1.3200 and 1.3320 before the bears appeared.
- There is a key bearish trend line forming with resistance at 1.3375 on the hourly chart of GBP/USD at FXOpen.
GBP/USD Technical Analysis
On the hourly chart of GBP/USD at FXOpen, the pair formed a base above the 1.3200 level. The British Pound started a steady increase above the 1.3320 resistance zone against the US Dollar, as discussed in the previous analysis.
The pair even cleared 1.3400 before the bears appeared. A high was formed at 1.3443 before there was a downside correction. There was a move below the 1.3400 and 1.3350 levels.
A low was formed at 1.3301 and the pair is now consolidating losses. On the upside, the pair is facing resistance near the 1.3335 level and the 23.6% Fib retracement level of the downward move from the 1.3443 swing high to the 1.3301 low.
The next key resistance near the 1.3375 level. There is also a key bearish trend line forming with resistance at 1.3375. The trend line is near the 50% Fib retracement level of the downward move from the 1.3443 swing high to the 1.3301 low.
An upside break above the 1.3375 zone could send the pair toward 1.3410. Any more gains might open the doors for a test of 1.3445.
If there is another decline, the pair could find support near the 1.3300 level. The first major support sits near the 1.3245 zone. The next major support is 1.3200. If there is a break below 1.3200, the pair could extend the decline. The next key support is near the 1.3150 level. Any more losses might call for a test of the 1.3080 support.
This article represents the opinion of the Companies operating under the FXOpen brand only. It is not to be construed as an offer, solicitation, or recommendation with respect to products and services provided by the Companies operating under the FXOpen brand, nor is it to be considered financial advice.

GBPUSD SHORT FORECAST Q2 W18 D1 Y25GBPUSD SHORT FORECAST Q2 W18 D1 Y25
Professional Risk Managers👋
Welcome back to another FRGNT chart update📈
Diving into some Forex setups using predominantly higher time frame order blocks alongside confirmation breaks of structure.
Let’s see what price action is telling us today!
💡Here are some trade confluences📝
✅Weekly order block rejection
✅Daily order block rejection
✅Daily high rejection
✅Daily imbalance fill targets
🔑 Remember, to participate in trading comes always with a degree of risk, therefore as professional risk managers it remains vital that we stick to our risk management plan as well as our trading strategies.
📈The rest, we leave to the balance of probabilities.
💡Fail to plan. Plan to fail.
🏆It has always been that simple.
❤️Good luck with your trading journey, I shall see you at the very top.
🎯Trade consistent, FRGNT X

GU-Thu-1/05/25 TDA-Possible bounce up from DR 1.32496?Analysis done directly on the chart
React to candles, you get to see how
really price is doing. It requires time and
effort, it's not easy!
Not financial advice, DYOR.
Market Flow Strategy
Mister Y

GBPUSD STRONG BEARISH PATTERN (H4)Bearish Scenario for GBP/USD
Current Sentiment: The GBP/USD market is displaying a continuous bearish pattern, indicating strong selling pressure. Price action suggests that bears are in control, pushing the pair lower through support levels.
Entry: Price is currently trending downwards after a potential lower high formation, breaking key support zones.
Bearish Targets:
1st Target: 1.32000 – This level aligns with a minor support area where previous consolidation occurred. A breach here confirms continued selling momentum.
2nd Target: 1.30600 – Historical support level; expect a potential short-term bounce or consolidation.
Final Target: 1.28100 – Major support level from previous long-term lows. A break below this could signal a shift in the broader market structure.

GBPUSD Analysis – Classic Spike, But Bearish Bias HoldsTwo days ago, TRADENATION:GBPUSD did what it often does – spiked above the previous high with no solid fundamental reason, likely just to hunt stops.
This return into the resistance zone might look bullish on the surface, but the bigger picture remains unchanged.
Has the market really resumed its up move, or was this just a trap?
Despite the upward push, the overall outlook stays bearish. A drop towards the 1.3000 zone is still highly probable – but we need confirmation.
Why the bearish scenario remains valid:
• The spike occurred without strong fundamental backing.
• Price hasn't broken the strong 1.35 resistance.
• Key support for a breakdown lies at 1.3330–1.3350 – a clear break here is the signal for downside continuation.
Trading Plan:
Wait for a break below 1.3330–1.3350, and then look for short setups on lower timeframes.
Invalidation comes only if the pair pushes and sustains above 1.3500, in which case the bearish thesis is off the table.
Disclosure: I am part of Trade Nation's Influencer program and receive a monthly fee for using their TradingView charts in my analyses and educational articles.

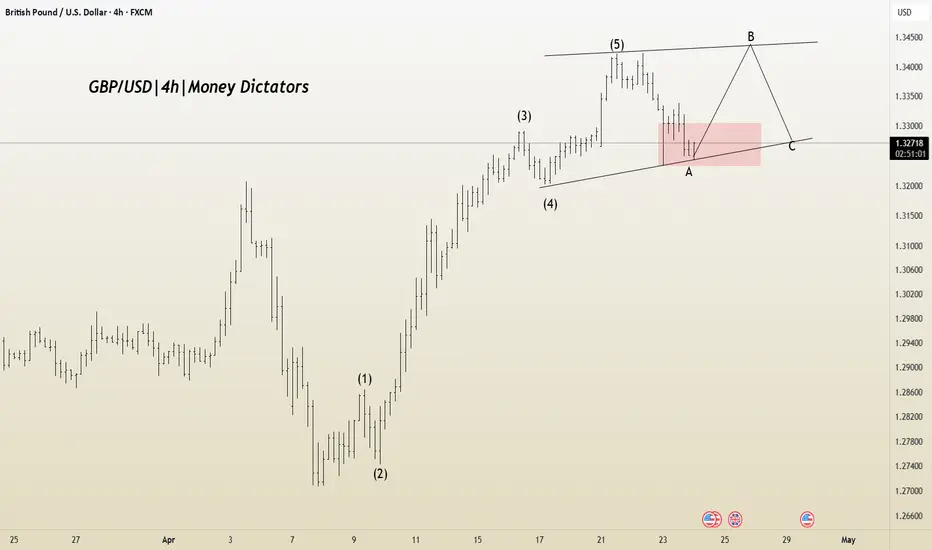
GBP/USD at a Turning Point – Correction Pattern in PlayIt appears that corrective Wave A in the GBP/USD pair is nearing completion, and Wave B may be forming. The Wave 1 to 5 structure seems to have been completed, indicating the beginning of an A-B-C corrective phase.
If the correction unfolds as expected, potential upside targets are 1.32918 and 1.33555. However, if the market faces rejection below the trendline, the stop-loss level would be 1.32021.
GBPUSD(20250430)Today's AnalysisMarket news:
The European Central Bank expects prices to rise 2.9% over the next 12 months, up from 2.6% in February, according to a monthly survey released on Tuesday. This is the highest level since April 2024. The three-year indicator rose slightly to 2.5%. The ECB's first five-year forecast was 2.1%.
Technical analysis:
Today's buying and selling boundaries:
1.3409
Support and resistance levels:
1.3471
1.3448
1.3433
1.3385
1.3370
1.3347
Trading strategy:
If the price breaks through 1.3409, consider buying, the first target price is 1.3433
If the price breaks through 1.3385, consider selling, the first target price is 1.3370

GU-Wed-30/04/25 TDA-Lots of red news ahead, watch out!Analysis done directly on the chart
Sometimes we need to step back and
recharge ourself to continuously do
good and great.
Not financial advice, DYOR.
Market Flow Strategy
Mister Y

GBPUSD SELL/SHORTBy utilizing levels, historical patterns, , we can formulate a hypothesis that the market might follow a similar trajectory if bearish sentiment prevails.

GBPUSD Sell and Buy Trading PlanH4 - We have a clean bullish trend with the price creating a series of higher highs, higher lows structure
This strong bullish move ended with a bearish divergence
While measuring this strong bullish move using the Fibonacci retracement tool we have two key support zones that has formed (marked in green)
So based on this I expect short term bearish moves now towards the Fibonacci support zones and then continuation higher.
If you enjoy this idea, don’t forget to LIKE 👍, FOLLOW ✅, SHARE 🙌, and COMMENT ✍! Drop your thoughts and charts below to keep the discussion going. Your support helps keep this content free and reach more people! 🚀
--------------------------------------------------------------------------------------------------------------------
Disclosure: I am part of Trade Nation's Influencer program and receive a monthly fee for using their TradingView charts in my analysis.

GBPUSD(20250429)Today's AnalysisMarket news:
The U.S. Treasury Department raised its second quarter debt forecast to $514 billion. U.S. Treasury Secretary: The "X Day" for the debt ceiling issue will be announced soon.
Technical analysis:
Today's buying and selling boundaries:
1.3387
Support and resistance levels:
1.3549
1.3488
1.3449
1.3325
1.3286
1.3225
Trading strategy:
If the price breaks through 1.3449, consider buying, the first target price is 1.3488
If the price breaks through 1.3387, consider selling, the first target price is 1.3325

GU-Tue-29/04/25 TDA-Interesting GBP strength yesterday!Analysis done directly on the chart
Interesting GBP strength yesterday compared to its peers
USD, EUR. What could possibly fueled this move up?
Amid of US-China trade war potential negotiation and ahead
of next important week of interest rate decisions.
Comment down below your thoughts!
Not financial advice, DYOR.
Market Flow Strategy
Mister Y

GBPUSD: Eyeing a Bullish Structure Shift - A Wyckoffian ApproachGBPUSD 🚦 Technical Analysis & Trade Plan
📊 Current Market Structure
The GBPUSD 4-hour chart is currently consolidating just below a set of equal highs, indicating a potential liquidity pool above. Price action has shown a series of higher lows, suggesting underlying bullish pressure. The market is in a range, with buyers and sellers in equilibrium, but the clustering of highs signals a likely stop-hunt or breakout scenario.
🧠 Wyckoff Perspective
From a Wyckoff standpoint, the market appears to be in the late stages of accumulation. The equal highs represent a classic “creek” or resistance, where smart money may engineer a breakout to trigger stops and induce breakout traders. A successful breakout, followed by a retrace to retest the broken highs (now support), and a subsequent bullish structure break, would confirm the presence of strong demand and the start of a mark-up phase.
🌍 Fundamental Backdrop
Fundamentally, GBP has been supported by resilient UK economic data and a slightly hawkish tone from the Bank of England, while the USD faces headwinds from softer inflation prints and dovish Fed rhetoric. However, geopolitical risks and global risk sentiment remain key drivers, so any sudden shifts could impact the pair.
📰 Current Sentiment
Market sentiment is cautiously optimistic for GBPUSD. CFTC positioning shows a reduction in net GBP shorts, and recent price action reflects a willingness to buy dips. However, the presence of equal highs suggests that many traders are watching for a breakout, increasing the likelihood of a stop-run before a genuine move higher.
🏦 Trade Idea
Entry: Buy on a confirmed break above the current equal highs (around 1.3340), wait for a retrace to retest the broken highs, and enter long on a bullish structure break (e.g., a higher low and bullish engulfing candle).
Stop Loss: Place stops below the retracement low (e.g., below 1.3300).
Take Profit: Target the next significant resistance zone (e.g., 1.3400–1.3450), scaling out as price approaches these levels.
Risk Management: Risk no more than 1–2% of your trading capital on this setup.
⚠️ Disclaimer
Trading forex involves significant risk and may not be suitable for all investors. The analysis and trade idea provided are for educational purposes only and do not constitute financial advice. Always conduct your own research and consult with a licensed financial advisor before making trading decisions.

GBPUSD(20250428)Today's AnalysisMarket news:
The Fed's subsequent policy path considers two scenarios: First, there is no substantial progress in the negotiations between the United States and its trading partners. After 90 days, the US tariffs are still high. Weakened economic demand may prompt the Fed to cut interest rates starting in July, and the annual rate cut may reach 100 basis points; second, the negotiations are fruitful, tariffs are reduced, and the demand shock is small, but inflationary pressure continues. The Fed may postpone easing and only cut interest rates slightly in December. For the market, although the easing comes early in the first scenario, the "recession-style" rate cut may suppress risky assets.
Technical analysis:
Today's buying and selling boundaries:
1.3309
Support and resistance levels:
1.3379
1.3353
1.3336
1.3282
1.3265
1.3239
Trading strategy:
If the price breaks through 1.3309, consider buying, the first target price is 1.3336
If the price breaks through 1.3282, consider selling, the first target price is 1.3265

#GBPUSD: Major Swing Sell Coming On GU, What's your views? OANDA:GBPUSD , as discussed in our previous analysis, where we predicted price would reach our target area and then reject it. The price has almost reached this area, and we are now waiting for it to fully complete the move so that we can take a swing sell on the GBP. Currently, the British pound is stronger and bullish due to the UK’s strong economic growth. However, this is not the case for the US dollar. The dollar is struggling to keep up with other currencies and is currently the worst-performing currency of the month of April.
While focusing on GBPUSD as a pair, it has been extremely bullish since the start of April. However, we are now at a point where there are no strong reasons for the pair to remain bullish and continue its uptrend. There are fundamental signs that will eventually reverse the bearish trend.
Our advice to all is to wait for the price to do its thing. Once it reaches our target area, it may show strong bearish dominance. However, this is not a guarantee that it will behave as we expect. There are two targets that you can focus on once you trade is activated.
Good luck and trade safely!
Thank you for your unwavering support! 😊
If you’d like to contribute, here are a few ways you can help us:
- Like our ideas
- Comment on our ideas
- Share our ideas
Team Setupsfx_
❤️🚀
