GBPUSD is in the Selling DirectionHello Traders
In This Chart GBPUSD HOURLY Forex Forecast By FOREX PLANET
today GBPUSD analysis 👆
🟢This Chart includes_ (GBPUSD market update)
🟢What is The Next Opportunity on GBPUSD Market
🟢how to Enter to the Valid Entry With Assurance Profit
This CHART is For Trader's that Want to Improve Their Technical Analysis Skills and Their Trading By Understanding How To Analyze The Market Using Multiple Timeframes and Understanding The Bigger Picture on the Charts
Gbpusdanalysis

GBPUSDGBPUSD has correction due before any more downside.
Disclosure: We are part of Trade Nation's Influencer program and receive a monthly fee for using their TradingView charts in our analysis.

GBPUSD July Playbook: Bearish Setup at Channel High GBPUSD just printed a CC SELL signal right at the top of its rising channel — setting the stage for a potential July pullback.
📌 Breakdown using Vinnie’s Trading Cheat Code System:
✅ RSI Overbought zone triggered
✅ CC Sell + Confirm Sell combo at channel resistance (~1.38)
✅ Price stretched far above the mean with no higher timeframe support nearby
✅ MACD histogram rolling over — momentum shift in play
🎯 Targets:
1.3500 (channel median / recent base)
1.3280 (deeper support / previous Confirm Buy area)
This looks like a textbook trap-the-buyers setup. Patience on the entry — I’ll be stalking rallies to sell into.
🧠 Tools Used:
Vinnie’s Confirm Alerts
CC Trend Indicator
RSI OB/OS Scanner
MACD HPS Screener
Following this closely — could be one of the cleanest short opportunities of the month.

GBPUSD is Bearish! Look for Sells!Welcome back to the Weekly Forex Forecast for the week of July 21-25th.
In this video, we will analyze the following FX market:
GBPUSD
Expecting the USD to continue to push higher, which would further drag the EURO down. Look to take advantage of this dynamic and wait for sell setups!
Enjoy!
May profits be upon you.
Leave any questions or comments in the comment section.
I appreciate any feedback from my viewers!
Like and/or subscribe if you want more accurate analysis.
Thank you so much!
Disclaimer:
I do not provide personal investment advice and I am not a qualified licensed investment advisor.
All information found here, including any ideas, opinions, views, predictions, forecasts, commentaries, suggestions, expressed or implied herein, are for informational, entertainment or educational purposes only and should not be construed as personal investment advice. While the information provided is believed to be accurate, it may include errors or inaccuracies.
I will not and cannot be held liable for any actions you take as a result of anything you read here.
Conduct your own due diligence, or consult a licensed financial advisor or broker before making any and all investment decisions. Any investments, trades, speculations, or decisions made on the basis of any information found on this channel, expressed or implied herein, are committed at your own risk, financial or otherwise.

$GU (GBPUSD) 4HGBPUSD is forming a potential reversal structure with liquidity resting above and below the current range.
We expect a move to grab short-term liquidity above 1.3475 followed by a sweep of lows near 1.3369.
This would complete a rounded bottom structure, setting the stage for a bullish reversal.
Once the low is swept and buyers step in, the target sits around the 1.3600 handle.

Bearish GBPUSD?? maybe??I have some questions here and no clear answers yet. For the moment, there is no trading idea here.
1) Is the USD going to be strong this week? - after scanning other USD pairs, the best I can say is "maybe".
2) Looking at GBPUSD, can we say it is bearish. - The uptrend does seem to be exhausting, but until this support is convincingly broken, it is still a "maybe".
It follows that there is no trade here, just a possibility. I don't want to fall in the trap of anticipating what will happen next. That is not a trader's job. Patience is one of the core skills in trading, that we have to acquire and master. Waiting for the market to show us its hand is always advisable.
This is not a trade recommendation; it’s merely my own analysis. Trading carries a high level of risk so carefully managing your capital and risk is important. If you like my idea, please give a “boost” and follow me to get even more.

GBPUSD buy playing outAs projected Post CPI
The pound is responding against the greenback and we can see price pushing upward.

GBPUSD BUYGBP/USD rises to near 1.3450 due to improved market sentiment, UoM Consumer Sentiment eyed
GBP/USD gains ground after registering small losses in the previous session, trading around 1.3440 during the Asian hours on Friday. The pair appreciates as the US Dollar edges lower due to dovish remarks from the Federal Reserve officials.
The Relative Strength Index (RSI) indicator on the 4-hour chart stays below 40, reflecting bearish conditions for GBP/USD. The Fibonacci 61.8% retracement level of the latest uptrend seems to have formed a pivot level at 1.3400.
In case GBP/USD fails to stabilize above 1.3400, technical sellers could remain interested. In this scenario, 1.3300 (Fibonacci 78.6% retracement) and 1.3275 (100-day Simple Moving Average) could be seen as next support levels. On the upside, resistance levels could be spotted at 1.3470 (Fibonacci 50% retracement), 1.3500 (static level, round level) and 1.3540 (Fibonacci 38.2% retracement).
TP 1 1.34403
TP 2 1.34859
TP 3 1.35407
RESISTANCE 1.33627

GBPUSD SELLBy utilizing levels, historical patterns, , we can formulate a hypothesis that the market might follow a similar trajectory if bearish sentiment prevails.
GBPUSD ANALYSIS From the previous trading day we can see that the pair has been making random up and down movements without a clear direction and even though we rejected a key support area the higher timeframes like daily and weekly still show bearish sentiment right now the best move is to wait


GBPUSD(20250717)Today's AnalysisMarket news:
The annual rate of PPI in the United States in June was 2.3%, lower than the expected 2.5%, the lowest since September 2024, and the previous value was revised up from 2.6% to 2.7%. Federal Reserve Beige Book: The economic outlook is neutral to slightly pessimistic. Manufacturing activity declined slightly, and corporate recruitment remained cautious.
Technical analysis:
Today's buying and selling boundaries:
1.3423
Support and resistance levels:
1.3544
1.3499
1.3470
1.3377
1.3348
1.3303
Trading strategy:
If it breaks through 1.3423, consider buying, and the first target price is 1.3470
If it breaks through 1.3377, consider selling, and the first target price is 1.3348

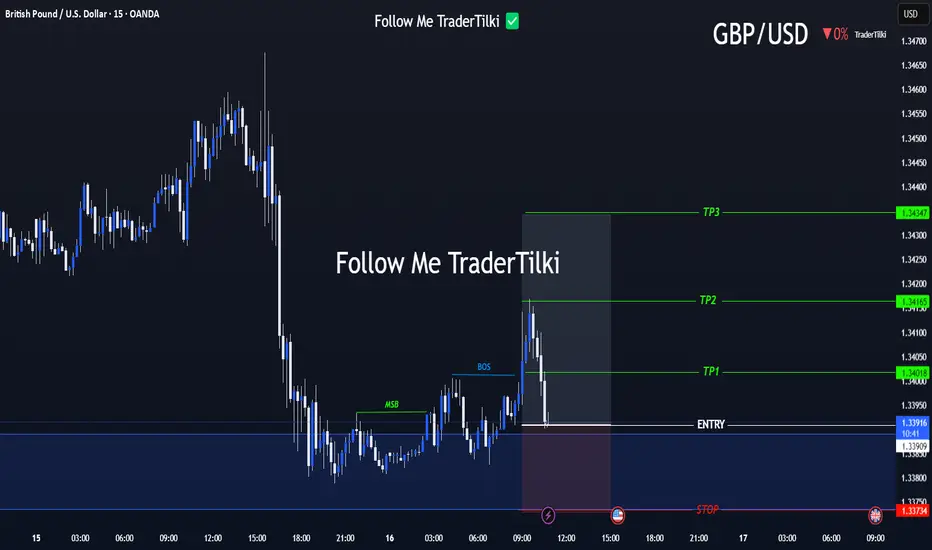
Strategic Entry, Clear Targets: The GBPUSD Game Plan Is Set📢 Hello Guys,
I've prepared a fresh GBPUSD signal for you:
🟢 Entry Level: 1.33918
🔴 Stop Loss: 1.33734
🎯 TP1: 1.34018
🎯 TP2: 1.34165
🎯 TP3: 1.34347
📈 Risk/Reward Ratio: 2,40
------
Your likes and support are what keep me motivated to share these analyses consistently.
Huge thanks to everyone who shows love and appreciation! 🙏
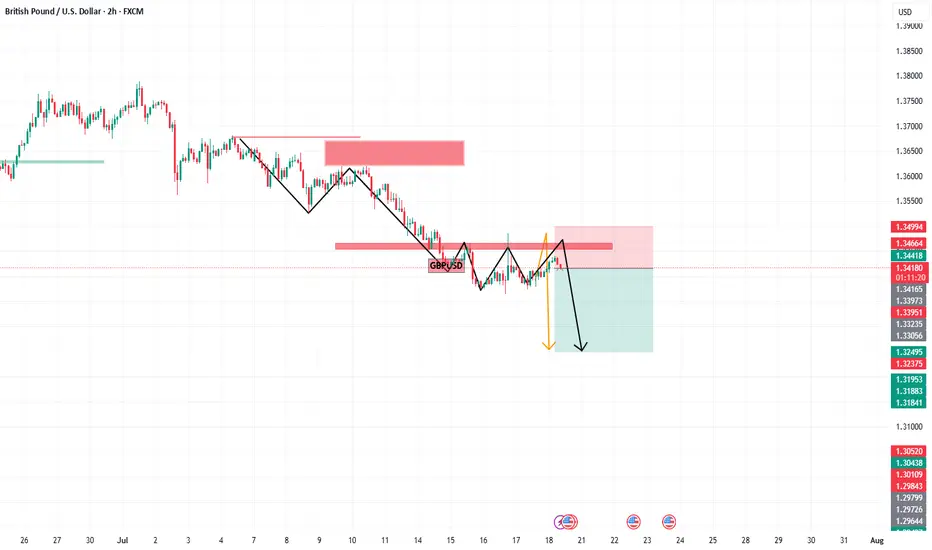
GBPUSD – Levels, Adjustments, and Scenario PlanningAs mentioned in our pinned analysis, we had two levels on GBPUSD —
✅ Both of them were broken.
📉 After the break of the first level, we shorted the pullback and took a great profit.
📍 Now after the second level has also broken, I’ve adjusted the level slightly —
There’s a chance price retraces to 1.35774 before continuing its drop.
🟢 Below, there’s a solid buy zone.
🔁 My Updated Scenarios:
✅ If price pulls back to the short level before hitting the buy zone → I’ll take the short.
⚠️ But if price touches the buy zone first, then any short afterward will just be partial or used for pyramiding — not a major trade.
Let’s stay patient and let the market tell us what to do.
📌 All previous scenarios are still valid.

GBPUSD h4 big downhe resistance at 1.36554 may be weak due to:
Multiple taps already
Reduced seller interest
A breakout above this zone could trigger short covering → sharp rally
✅ 2. Higher Low Structure
Recent low at 1.35475 held strong
Current consolidation appears like a bullish flag or accumulation range
Could indicate continuation, not rejection
GBPUSD SELL IDEA Fakeout Reversal Setup
If price dips into the support at 1.35475 again, it might:
Trap breakout traders
Reverse and form a new impulse leg upward
Target = 1.3700–1.3750 zone
Disruption Path: Bullish Breakout
Minor dip or tight range around current price
Break and hold above 1.3655
Acceleration toward 1.3700–1.3750
Disruption Invalidation
A strong close below 1.3540 with volume

GBPUSD(20250716)Today's AnalysisMarket news:
① The annual rate of the overall CPI in the United States in June rose to 2.7%, the highest since February, in line with market expectations, and the monthly rate was 0.3%, the highest since January, in line with market expectations; the annual rate of the core CPI rose to 2.9%, the highest since February, lower than the expected 3%, but slightly higher than 2.8% last month, and the monthly rate was 0.2%, lower than the market expectation of 0.3%.
② Interest rate futures still show that the Fed is unlikely to cut interest rates this month, but there is a high possibility of a 25 basis point cut in September.
③ Fed mouthpiece: The CPI report will not change the Fed's policy direction.
④ Trump: Consumer prices are low and the federal funds rate should be lowered immediately. The Fed should cut interest rates by 3 percentage points.
⑤ Fed Collins: The core inflation rate is expected to remain at about 3% by the end of the year, and the Fed should maintain active patience.
Technical analysis:
Today's buying and selling boundaries:
1.3409
Support and resistance levels:
1.3497
1.3464
1.3443
1.3375
1.3354
1.3321
Trading strategy:
If the price breaks through 1.3409, consider buying, the first target price is 1.3443
If the price breaks through 1.3375, consider selling, the first target price is 1.3354

DeGRAM | GBPUSD broke down the channel📊 Technical Analysis
● Cable’s bounce stalled at the channel base (≈1.3500); price is now carving a bear flag beneath that rail and the prior wedge-break line, signalling failure to regain trend support.
● A 4 h close under 1.3415 confirms channel loss, opening the mid-May pivot 1.3271; flag top at 1.3470 caps risk while lower-high sequence stays intact.
💡 Fundamental Analysis
● Friday’s firm US consumer-sentiment and Fed Gov. Waller’s “no urgency to cut” comments nudged 2-yr yields back toward 4.80 %, reviving dollar demand.
● UK June payrolls contracted for a third month and wage growth cooled, boosting August BoE-cut odds and weighing on sterling.
✨ Summary
Sell 1.3460-1.3490; sustained trade below 1.3415 targets 1.3271. Short view void on a 4 h close above 1.3470.
-------------------
Share your opinion in the comments and support the idea with a like. Thanks for your support!

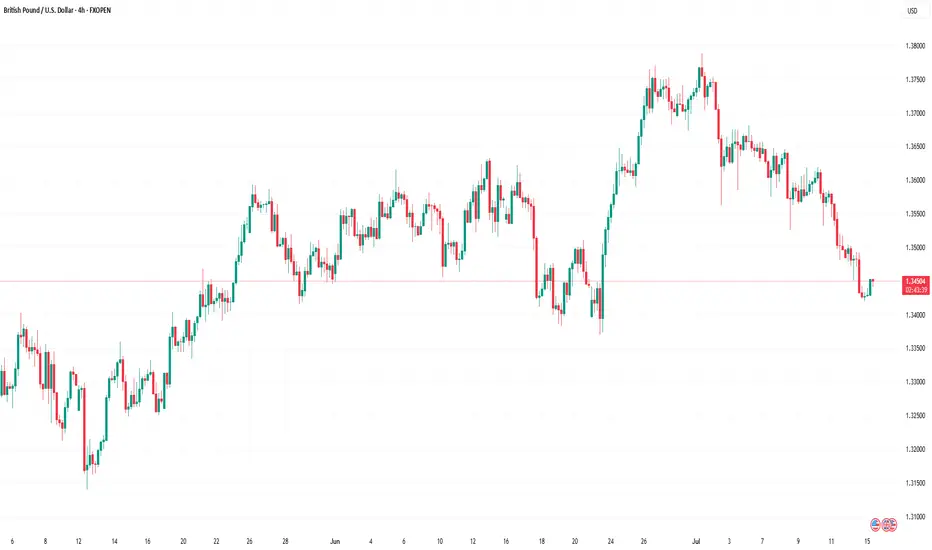
GBP/USD Rate Falls to Key Support LevelGBP/USD Rate Falls to Key Support Level
As of today, the GBP/USD chart indicates that the British pound has declined by more than 2% against the US dollar since the beginning of July. Notably, the pace of the decline accelerated on Friday and continued into Monday.
According to Reuters, the pound is under pressure due to market concerns over a potential economic slowdown amid an escalating trade war. Last week’s data confirmed a contraction in UK GDP, which could have far-reaching implications. In this context, criticism of the UK government’s failure to reduce public spending is becoming more pronounced.
What’s next for GBP/USD?
Technical Analysis of the GBP/USD Chart
From a bullish perspective, it is worth noting that the pair has fallen to a significant support level around 1.3425. This level previously acted as resistance in the spring, but after a breakout, it has now turned into support (as indicated by arrows on the chart). Additionally, the RSI indicator shows strong oversold conditions, which suggests a potential short-term rebound.
From a bearish standpoint, it is concerning that the sharp rally from point A to point B has been entirely erased by the July decline. This indicates that despite significant gains by the bulls, they failed to hold them—casting doubt on GBP/USD's ability to sustain growth in the medium term.
Ongoing pressure may lead to an attempt by bears to push GBP/USD below the June low at point A. However, it is also possible that bearish momentum will weaken thereafter, potentially leading to a recovery within the developing downward channel (marked in red).
This article represents the opinion of the Companies operating under the FXOpen brand only. It is not to be construed as an offer, solicitation, or recommendation with respect to products and services provided by the Companies operating under the FXOpen brand, nor is it to be considered financial advice.
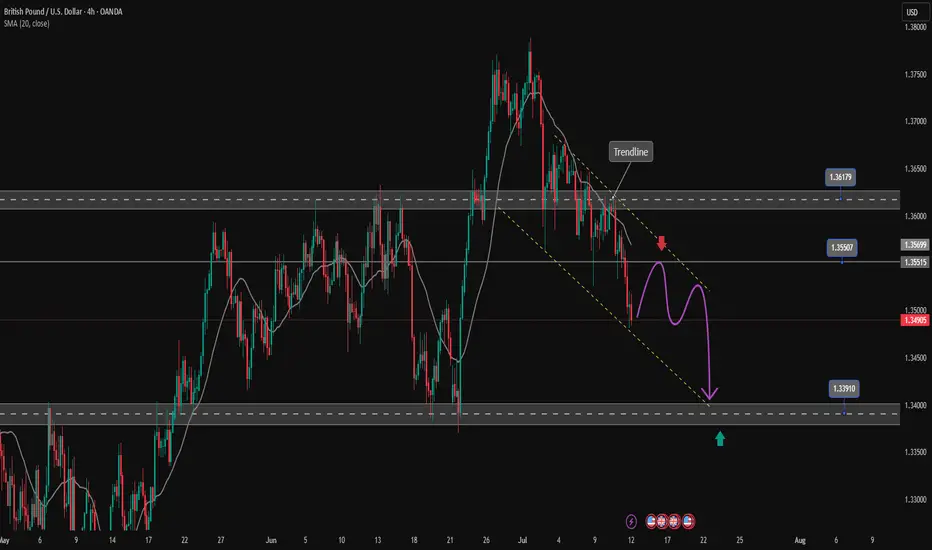
GBPUSD downtrend continuesOANDA:GBPUSD is trading in a bearish channel heading towards the important support zone of 1.340. This is the bottom support zone of last month so there is a lot of buying pressure in this zone. Any recovery of GBPUSD is considered a good opportunity to enter a SELL signal to the target. When the price breaks 1.361, the downtrend will really break.
Support: 1.340
Resistance: 1.355-1.361
SELL Trigger: rejection 1.355 with bearish confirmation
SELL zone 1.361 (Strong Resistance zone)
Target: 1.340
Leave your comments on the idea. I am happy to read your views.
GBPUSD ANALYSIS After seeing the previous day close bearish we can expect the market to continue in to support area of 133.750 but a slight retracement could be in play before further push down

GBPUSD(20250714)Today's AnalysisMarket news:
① Fed's Goolsbee: The latest tariff threat may delay rate cuts. ② The Fed responded to the White House's "accusations": The increase in building renovation costs partly reflects unforeseen construction conditions. ③ "Fed's megaphone": The dispute over building renovations has challenged the Fed's independence again, and it is expected that no rate cuts will be made this month. ④ Hassett: Whether Trump fires Powell or not, the Fed's answer to the headquarters renovation is the key.
Technical analysis:
Today's buying and selling boundaries:
1.3518
Support and resistance levels:
1.3621
1.3583
1.3558
1.3479
1.3454
1.3415
Trading strategy:
If the price breaks through 1.3518, consider buying in, with the first target price at 1.3558
If the price breaks through 1.3479, consider selling in, with the first target price at 1.3454

GBPUSD: Two Strong Bullish Area To Buy From ?GU is currently in a bullish trend when examined on a daily time frame. There are two potential areas for purchase. The first area is currently active, as we anticipate a price reversal from this point. There is a significant possibility that price could decline to the second area and subsequently reverse from there directly. The sole reason we believe price could drop to the second area is if the US Dollar experiences corrections, which could cause GU to drop to our second area and subsequently rebound.
If you appreciate our analysis, we kindly request that you consider the following actions:
-Liking the Ideas
-Commenting on the Ideas
-Sharing the Ideas
We extend our sincere gratitude for your continuous support. We trust that our insights have provided even a modicum of assistance.
Team Setupsfx_
❤️🚀

EURUSD and GBPUSD Analysis todayHello traders, this is a complete multiple timeframe analysis of this pair. We see could find significant trading opportunities as per analysis upon price action confirmation we may take this trade. Smash the like button if you find value in this analysis and drop a comment if you have any questions or let me know which pair to cover in my next analysis.
