GU-Tue-01/07/25 TDA-Strong resistance area approaching 1.37500Analysis done directly on the chart
Follow for more, possible live trades update!
I often share my live trades in Tradingview public chat in London session, stay tuned!
Timing!
You might ask yourself why sometimes your
trade idea was good but still ended up hitting your sl before it moves to your direction.
The reason is simple: Timing.
price is just not ready to push at that time
and needed extra liquidity and structure before it finally has the force to push.
Understanding when the market is ready is one of the most difficult thing for a trader to do but with experience you start to understand better and improve.
If you like the way I present and analyze, make sure to boost,
share and follow me for more future posts, ideas and useful informations.
Active in London session!
Not financial advice, DYOR.
Market Flow Strategy
Mister Y
Gbpusdanalysis

GBPUSD: Targeting 1.4200 Swing Move Target! Swing Trading GBPUSD: We’ve identified a key reversal zone where our long-term take-profit target is set at 1.4200. This is a long-term approach, but in the short term, we could target 1.3900, which is a reasonable take-profit area. Before taking any buying entry, please do your own analysis.
Good luck and trade safely!
Like
Comment
Share
Team Setupsfx_

GU-Mon-30/06/25 TDA-Good support 1.37000&Good resistance 1.37500Analysis done directly on the chart
Follow for more, possible live trades update!
I often share my live trades in Tradingview public chat in London session, stay tuned!
The reality of life is that if you don't work for yourself,
you'll never achieve what you want.
Don't expect things to come, work for it, act on it.
Notice the difference between DOers and Dreamers.
Comment down below what do you think!
Active in London session!
Not financial advice, DYOR.
Market Flow Strategy
Mister Y

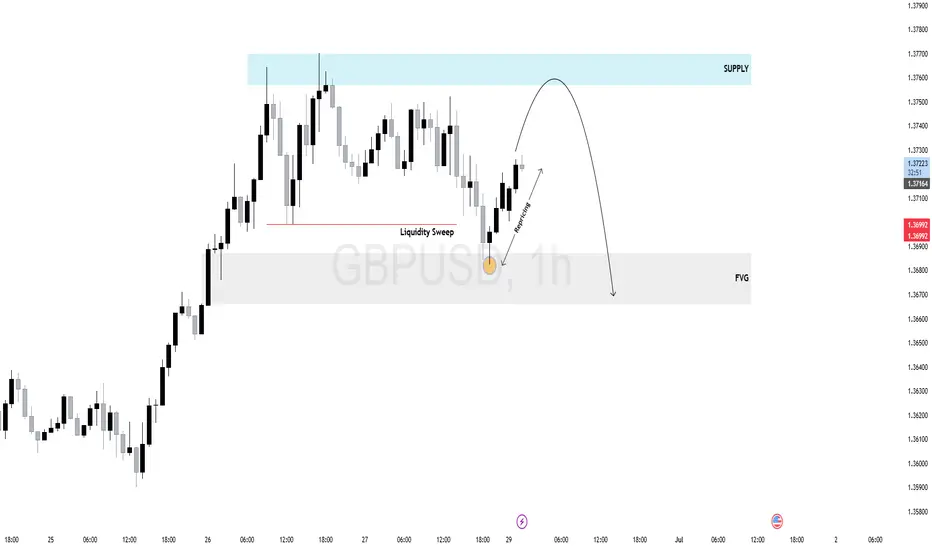
$GU (GBPUSD) 1H AnalysisPrice swept internal liquidity before dropping into a clear 1H Fair Value Gap (FVG), which acted as a draw on liquidity. Following the mitigation, GBPUSD is now retracing toward a high-probability supply zone.
Expect potential rejection as price rebalances inefficiency and seeks sell-side liquidity.
Watch for bearish confirmation inside the supply zone — ideal for intraday shorts if the structure shifts.
Pullbacks = short opportunities.
GBPUSD ANALYSIS After seeing that the previous candle closed really bullish on the week we could expect that momentum to continue since the daily and the 4hr structure are not showing any signs of reversal

Exclusive: GBP/USD Swing Heist – Limited-Time Opportunity!🏴☠️ GBP/USD HEIST ALERT: Bullish Loot Grab Before the Cops Arrive! 🚨💰
🌟 Attention, Market Pirates & Profit Raiders! 🌟
"The vault is unlocked—time to swipe those pips!"
🔥 THIEF TRADING STRATEGY (Swing/Day) 🔥
Based on high-risk, high-reward technical & fundamental analysis, here’s the master plan to plunder GBP/USD ("The Cable")!
📈 ENTRY (Bullish Heist Zone)
"The vault is OPEN!" – Long at any price, but for precision:
Buy Limit orders preferred (15m-30m timeframe).
Pullback entries from recent swing lows/highs = sneakiest loot grab!
🛑 STOP LOSS (Escape Route)
Thief SL: Nearest swing low (4H chart).
Adjust based on: Risk tolerance, lot size, & number of orders.
"A good thief always has an exit plan!"
🎯 TARGETS
1.37500 (or escape early if the cops 🚓 (bearish traps) show up!).
Scalpers: Only long-side raids! Use trailing SL to lock profits.
💥 WHY THIS HEIST? (Bullish Momentum)
Technicals + Fundamentals align for a potential breakout.
Overbought? Risky? Yes—but the best loot is guarded!
📢 TRADING ALERT (News & Risk Mgmt)
Avoid new trades during high-impact news (volatility = police sirens!).
Trailing stops = Your getaway car. Protect profits!
🚀 BOOST THE HEIST!
💖 Hit "Like" & "Boost" to fuel our next raid!
💬 Comment your loot tally below!
"Stay sharp, thieves—see you at the next heist! 🤑🔥"

GBPUSD: The Big Short Opportunity?(Breakout Confirmation Needed)🚨 GBP/USD BANK HEIST ALERT: The Bearish Robbery Plan (Swing/Day Trade) 🚨
🔥 Steal Pips Like a Pro – Thief Trading Strategy Inside! 🔥
🌟 GREETINGS, MARKET PIRATES! 🌟
🤑 To all the Money Makers, Risk Takers & Midnight Breakers!
Based on our 🔥Thief Trading Style🔥 (a deadly mix of technical + fundamental + intermarket analysis), we’re plotting a massive bearish heist on GBP/USD ("The Cable").
This is not financial advice—just a strategic robbery plan for those who dare to trade smart.
📉 THE HEIST STRATEGY (SHORT ENTRY FOCUS)
🎯 Target Zone: 1.32300 (or escape earlier if the market turns)
⚡ High-Risk, High-Reward Play: Oversold market, consolidation, trend reversal setup.
💣 Trap Level: Where bullish traders get wrecked.
🔑 ENTRY RULES:
"The Heist is ON!" – Wait for breakout confirmation at 1.33800 before striking.
Sell Stop Orders below breakout MA OR Sell Limit Orders (15-30 min timeframe).
Retest Entry? Ideal if price retraces to recent low/high before dropping.
📌 ALERT SETUP: Don’t miss the breakout—set a chart alert!
🛑 STOP LOSS (Risk Management):
Thief SL at 1.34800 (Swing/Day Trade basis – 3H period).
🚨 Pro Tip: "Yo, rebels! You can place SL wherever you want… but if you ignore this level, don’t cry later. Your risk, your rules."
🎯 PROFIT TARGET:
First Take-Profit: 1.32300 (or bail earlier if momentum fades).
Scalpers: Ride the short side only. Use trailing SL to lock profits.
📰 FUNDAMENTAL BACKUP (Why This Heist Works)
Before executing, check:
✅ COT Report (Are big players dumping GBP?)
✅ Macro News (UK vs. USD economic strength)
✅ Intermarket Analysis (DXY, Bonds, Equities correlation)
✅ Sentiment & Seasonality (Is the crowd too bullish?)
⚠️ WARNING: NEWS & VOLATILITY ALERTS
Avoid new trades during high-impact news (unless you love gambling).
Use trailing stops to protect profits if the market flips.
💥 BOOST THIS HEIST! 💥
🚀 Like & Share to strengthen our Thief Trading Squad!
💸 More heists = More profits. Stay tuned for the next robbery plan!
🤑 See you on the profitable side, bandits! 🏴☠️
🔴 DISCLAIMER: This is entertainment, not financial advice. Trade at your own risk.
#Forex #GBPUSD #TradingStrategy #ThiefTrading #BankHeist #SwingTrading #DayTrading
💬 COMMENT BELOW: Are you joining the heist or waiting for a better setup? 🚨👇

GBP/USD Robbery: Can You Grab the Cash Before the Cops Arrive?🚨 GBP/USD "The Cable" forex bank Heist Alert: The Bullish Breakout Robbery Plan (Swing & Scalp Strategy) 🚨
🌟 Hi! Hola! Ola! Bonjour! Hallo! Marhaba! 🌟
Attention Money Makers & Market Robbers! 🤑💰💸
Based on the 🔥Thief Trading Style🔥, here’s our master plan to loot the GBP/USD "The Cable" forex bank. Follow the strategy on the chart—focusing on LONG entries—and escape near the high-risk Red Zone. This area is overbought, consolidating, and a potential reversal trap where bears lurk. 🏆 Take profits fast—you’ve earned it! 💪
🎯 Heist Entries:
📈 Entry 1: "The Breakout Heist!" – Wait for Resistance (1.36200) to break, then strike! Bullish profits await.
📈 Entry 2: "Big Players’ Pullback!" – Jump in at 1.34000+ buy above at any price for a safer steal.
🔔 Pro Tip: Set a chart alert to catch the breakout instantly!
🛑 Stop Loss Rules:
*"Yo, listen! 🗣️ If you’re entering with a buy-stop, DON’T set your SL until AFTER the breakout. Place it at the nearest swing low (3H timeframe) or wherever your risk allows—but remember, rebels risk more! 🔥"*
🏴☠️ Target: 1.37500
🧲 Scalpers: Only play LONG! Use trailing SL to lock in profits. Big wallets? Go all in. Small stacks? Join the swing heist!
📊 Market Pulse:
The GBP/USD "The Cable" is neutral but primed for bullish momentum. Watch:
Fundamentals (COT, Macro, Geopolitics)
Sentiment & Intermarket Trends
Positioning & Future Targets & Overall score
📌 Check our bioo linkks for deep analysis! 🔗🌍
⚠️ Trading Alert:
News = Volatility! Protect your loot:
Avoid new trades during major news
Use trailing stops to secure profits
💥 Boost This Heist!
Hit 👍 & 🔄 to strengthen our robbery crew! Let’s dominate the market daily with the Thief Trading Style. 🚀💵
Stay tuned—another heist drops soon! 🎯🐱👤

GBP/USD HEIST ALERT: Bullish Breakout or Bearish Trap?🌟 Hey! Hola! Ola! Bonjour! Hallo! Marhaba! 🌟
Calling all Market Robbers & Profit Pirates!💸💰
🔥 Thief Trading Intel: Our crew’s latest heist targets GBP/USD "The Cable"—bullish breakout incoming! Long entry only. High-risk Red Zone ahead: overbought, consolidating, and ripe for a reversal. Don’t get caught in the bear trap! 🏴☠️
"Take your loot and run, trader—you’ve earned this steal!" 💪🎯
🚪 ENTRY: The Heist Begins!
📈 "Wait for MA breakout (1.36000) then STRIKE—bullish profits await!"
Option 1: Buy Stop above Pink Resistance (breakout confirmation).
Option 2: Buy Limit at swing low/high (15-30 min TF).
📌 Pro Tip: SET AN ALERT! Don’t miss the breakout.
🛑 STOP LOSS: Escape Route
🔊 "Yo, listen up! 🗣️
Buy Stop orders? NO SL until after breakout! 🚀
Rebels: Place SL wherever—but you’ve been warned! ⚠️🔥
📍 Thief SL (Smart Crew): Recent/swing low (1.35000, 4H TF).
📍 Adjust based on your risk, lot size, and orders.
🎯 TARGET: Loot & Exit!
🎯 1.37500 (or escape early if the market turns!)
⚡ SCALPERS’ QUICK GRAB
👀 Long scalps ONLY!
Big wallets? Raid now.
Small stacks? Join swing traders.
Trailing SL = Your Money Shield! 🛡️💰
📢 WHY THIS HEIST? (GBP/USD Bullish Momentum)
"The Cable" is heating up! Key drivers:
Fundamentals (COT, Macro Data)
Sentiment & Intermarket Trends
Future Targets & Score Outlook
🔗 Full intel? Bio links below! 👉👉
⚠️ TRADING ALERT: News = Danger Zone! 📰🚨
News = Volatility Spikes! Protect your loot:
❌ Avoid new trades during news.
🔒 Trailing SL = Profit Lock.
💖 SUPPORT THE HEIST CREW!
💥 SMASH THAT BOOST BUTTON! 💥
More boosts = easier money grabs!
Stronger crew = bigger heists!
Profit daily with Thief Trading Style! 🏆🚀
Next heist coming soon—stay tuned! 🤑🐱👤🤩

GBPUSDCable still have some upside towards the level highlighted on the chart.
Disclosure: We are part of Trade Nation's Influencer program and receive a monthly fee for using their TradingView charts in our analysis.

#GBPUSD: Bulls are in control, DXY Dropping Sharply!Hello Team,
We have identified a promising opportunity with a favourable price movement. The Pound Sterling to US Dollar (GBPUSD) pair has exhibited strong bullish volume, indicating potential further appreciation.
The current geopolitical tensions, particularly the involvement of the United States in the Iran-Israel conflict, are expected to negatively impact the US Dollar. This decline could potentially lead to an appreciation of the GBPUSD pair and other USD-denominated currencies.
It is advisable to closely monitor the price behaviour of the GBPUSD pair and consider potential investment opportunities based on its current trend.
Best regards,
Team Setupsfx

Bullish Bias Holds for GBP/USD – Focus on 1.37500 BreakHi everyone,
A strong push up from our highlighted support level at 1.33800 toward 1.36850 saw GBP/USD enter a brief period of consolidation. During the week, price action ranged between this newly established support and the 1.37500 resistance level.
Looking ahead, we anticipate a decisive break above 1.37500, which could open the way for further upside.
As previously noted, the clearance of these levels strengthens our expectation for further upside, with the next key level of interest around 1.38400. We'll be watching to see how price action develops from here.
We’ll continue to provide updates on the projected path for GBP/USD as price approaches this target.
The longer-term outlook remains bullish, and we expect the rally to continue extending further from the 1.20991 January low towards 1.40000 and 1.417000.
We’ll be keeping you updated throughout the week with how we’re managing our active ideas. Thanks again for all the likes/boosts, comments and follows — we appreciate the support!
All the best for the week ahead. Trade safe.
BluetonaFX

GU-Fri-27/06/25 TDA-Good resistance area 1.37500, PCE news laterAnalysis done directly on the chart
Follow for more, possible live trades update!
I often share my live trades in Tradingview public chat in London session, stay tuned!
Have priorities in your life.
What are the things that you consider to be top
before anything else?
Do you consider trading as top priority?
When facing doubts and insecurities, if you have
set a list of priorities, you'll likely to be more
oriented and not get lost easily shifting your focus
with your own top priorities.
Active in London session!
Not financial advice, DYOR.
Market Flow Strategy
Mister Y

GBP/USD Rally in Full Swing – Bullish Targets AheadHi everyone,
Price achieved the 1.36850 having found support near the 1.33800 level.
As previously noted, the clearance of these levels strengthens our expectation for further upside, with the next key level of interest around 1.38400. We'll be watching to see how price action develops from here.
We’ll continue to provide updates on the projected path for GBP/USD as price approaches this target.
The longer-term outlook remains bullish, and we expect the rally to continue extending further from the 1.20991 January low towards 1.40000 and 1.417000.
We’ll be keeping you updated throughout the week with how we’re managing our active ideas. Thanks again for all the likes/boosts, comments and follows — we appreciate the support!
All the best for the week ahead. Trade safe.
BluetonaFX
GBPUSD 1H | Bearish Divergence GBPUSD has reached a critical technical zone where multiple confluences are signaling a downside correction:
✅ Bearish Divergence spotted on RSI at the top, indicating momentum exhaustion.
✅ Price got rejected from a strong Daily Supply Zone, showing clear institutional selling pressure.
✅ On the LTF (Lower Timeframe), structure has shifted — new Lower Highs (LH) and Lower Lows (LL) are now printing, confirming a short-term bearish trend change.
✅ Price also broke the LTF trendline and is retesting, adding further bearish confluence.
📊 Bias:
Expecting a corrective move to the downside with targets around previous liquidity zones:
⚠️ Market is still sensitive to USD fundamentals this week, so watch key news events for volatility spikes.
🔔 Wait for proper confirmations and manage risk accordingly.

GU-Thu-26/06/25 TDA-GU rallying higher in NY-Asian session!Analysis done directly on the chart
Follow for more, possible live trades update!
I often share my live trades in Tradingview public chat in London session, stay tuned!
Losses are part of the game. We are risk takers,
we take losses but it's important to know how to
manage them properly. Not every day, every session
is good to trade. Being a good trader means valuing
more risk management over profits.
Active in London session!
Not financial advice, DYOR.
Market Flow Strategy
Mister Y

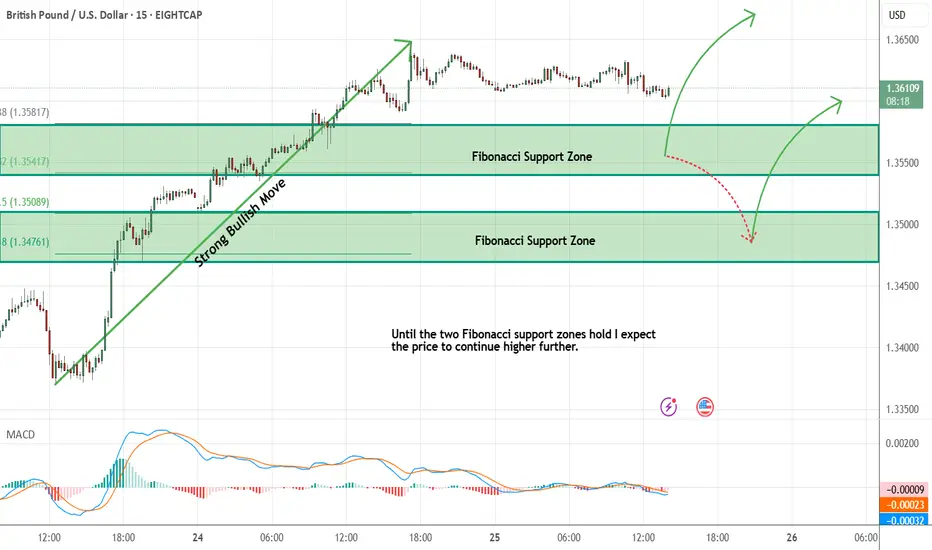
GBPUSD - Expecting Bullish Continuation In The Short TermM15 - Strong bullish momentum followed by a pullback.
No opposite signs.
Until the two Fibonacci support zones hold I expect the price to move higher further.
If you enjoy this idea, don’t forget to LIKE 👍, FOLLOW ✅, SHARE 🙌, and COMMENT ✍! Drop your thoughts and charts below to keep the discussion going. Your support helps keep this content free and reach more people! 🚀
--------------------------------------------------------------------------------------------------------------------
GBPUSD is in the Selling DirectionHello Traders
In This Chart GBPUSD HOURLY Forex Forecast By FOREX PLANET
today GBPUSD analysis 👆
🟢This Chart includes_ (GBPUSD market update)
🟢What is The Next Opportunity on GBPUSD Market
🟢how to Enter to the Valid Entry With Assurance Profit
This CHART is For Trader's that Want to Improve Their Technical Analysis Skills and Their Trading By Understanding How To Analyze The Market Using Multiple Timeframes and Understanding The Bigger Picture on the Charts

GBPUSD Price Action Analysis | Sell Setup Below 1.36106In this GBPUSD market overview, we break down recent price action following yesterday’s strong bullish rally from the momentum low. The session was highly emotional across major forex pairs, which is typical when a major wave structure reaches its end. This often results from incomplete auctions on one side of the market, causing order flow imbalances that drive sharp price movements.
The key price level we're watching on GBPUSD is 1.36326. Price approached this zone with momentum, and the rejection at 1.36267 triggered a classic TCP (Trend Changing Pattern), followed by a single upside break, confirming exhaustion at the highs.
📉 Sell Setup:
According to the Waves of Success execution model, the best short entry is below 1.36106, in alignment with the prevailing bearish structure.
⚠️ Alternative Scenario:
We are not looking for long setups on GBPUSD at this time — our bias remains bearish unless significant structure changes occur.
This analysis combines wave structure, trend confirmation patterns, and institutional price levels for a professional, risk-managed approach.
🔑 Key Levels:
Resistance: 1.36326
Rejection High: 1.36267
Sell Trigger: 1.36106

How I’m Planning My Next GBPUSD Trade Setup📉 GBPUSD Analysis Update
Currently keeping a close eye on GBPUSD 👀. On both the Daily and 4H charts, we’ve seen a strong bullish rally, driving price into a premium zone and tapping into key buy-side liquidity resting above previous highs 🔼💧.
The pair now appears overextended and is trading into a significant resistance level 🧱. Given this context, I’m anticipating a potential retracement. If we see a pullback followed by a clean bullish break in market structure, that’s when I’ll be looking to enter a long position 🎯📈.
⚠️ As always, this is not financial advice — just sharing my personal view of the markets.

GU-Wed-25/06/25 TDA-GU consolidating now!Analysis done directly on the chart
Follow for more, possible live trades update!
I often share my live trades in Tradingview public chat in London session, stay tuned!
Market is fractal, what happens in higher timeframe.
It repeats on lower timeframe but with more noise.
The lower timeframe we go the more technical
analysis is required as price in general is not
subjected to fundamental news as the higher
timeframe does. (Even though fundamental analysis,
is essential no matter what timeframe you trade)
Active in London session!
Not financial advice, DYOR.
Market Flow Strategy
Mister Y

Technical + Fundamental Alignment: GBPUSD Short in PlayGBPUSD ( FX:GBPUSD ) is moving near the Resistance zone($1.354-$1,350) and has managed to break the Support line .
In terms of Elliott Wave theory , it seems that GBPUSD has completed the Zigzag Correction(ABC/5-3-5) , we can expect the next five bearish waves .
--------------------------------------------------------
Fundamental Analysis
1-Weak UK Economic Data:
Recent reports including Retail Sales, Industrial Output, and PMIs have come in below expectations.
Labour market is softening, and wage growth is decelerating.
2-Dovish Expectations for BoE:
With inflation cooling down, the Bank of England is expected to hold or even cut rates soon, reducing support for the pound.
3-Stronger USD Outlook
Despite some weaker U.S. data, the Fed maintains a hawkish stance. U.S. retail sales and inflation still support the dollar overall.
4-UK Political Risk
Upcoming UK elections on July 4 are adding uncertainty and downside risk to GBP.
--------------------------------------------------------
I expect GBPUSD to attack at least the Support lines based on the above explanation.
Targets: 1.3
1)1.3353 USD =>Risk-To-Reward: 1.51
2)1.3315 USD =>Risk-To-Reward: 2.00
Note: Stop Loss(SL): 1.3549 USD
Please respect each other's ideas and express them politely if you agree or disagree.
British Pound / U.S Dollar Analyze (GBPUSD), 1-hour time frame.
Be sure to follow the updated ideas.
Do not forget to put a Stop loss for your positions (For every position you want to open).
Please follow your strategy and updates; this is just my Idea, and I will gladly see your ideas in this post.
Please do not forget the ✅' like '✅ button 🙏😊 & Share it with your friends; thanks, and Trade safe.

GBPUSD– Rejection at Resistance: Technical and Macro PullbackGBPUSD has climbed back into a strong multi-week resistance zone just beneath 1.3670. While the recent rally was sharp, it now confronts both structural resistance and weakening UK fundamentals. The British economy is losing steam—GDP contracted more than expected, manufacturing output is weak, and the latest CBI survey paints a grim industrial outlook. Meanwhile, Fed officials continue to push back on early rate cut expectations, lending resilience to the USD. Technically, this aligns with a potential top forming near 1.3630–1.3670, offering a compelling risk-reward for sellers.
🔻 Bias: Bearish
• Favoring short setups from resistance, backed by weak UK data and a sticky Fed narrative.
🔑 Key Fundamentals
🇬🇧 UK:
May GDP: –0.3% m/m (worse than forecast)
CBI Industrial Trends: Output volumes and orders well below long-run average
Inflation slowing, but BoE hesitant amid stagnant growth – classic stagflation
🇺🇸 US:
Fed officials (Barkin, Collins, Cook) emphasize caution
Core services inflation still elevated
Fed rate cuts now expected in September, not July
⚠️ Risks to the Bearish View
Hawkish surprise from the BoE (if they hike or signal tightening)
U.S. Core PCE comes in soft, pressuring the USD
Sustained global risk-on rally pulling GBP higher via equities
📅 Important Events to Watch
June 25–26: Fed Chair Powell testimony to Congress
June 28: U.S. Core PCE inflation report
UK CPI revisions, retail sales, and BoE commentary
U.S. jobs and consumer confidence (early July)
📉 Technical Setup – Short from Key Supply Zone
Chart Structure:
Major confluence resistance at 1.3625–1.3665 (blue zone)
Multiple rejection wicks + ascending wedge structure
Bearish divergence building on momentum (not shown)
🎯 Trade Setup:
Entry Zone:
🔹 Sell between 1.3625 and 1.3665, ideally after a bearish engulfing/pin bar or 4H rejection
Take Profits:
TP1: 1.3535 – local support
TP2: 1.3465 – fib and horizontal confluence
TP3: 1.3390 – wedge breakdown target
Stop Loss / Invalidation:
🔸 SL above 1.3685**
A 4H/1D candle close above invalidates the setup and opens the door to new highs.
Risk-Reward:
RR to TP1: ~1.8
RR to TP3: 3.5+
🧭 Summary:
GBPUSD is technically stretched and facing key resistance. With UK macro data deteriorating and Fed members holding the line, this rally looks increasingly vulnerable. As long as 1.3685 holds, sellers may dominate with clear downside targets over the next 1–2 weeks.
