GBPUSD(20250619)Today's AnalysisMarket news:
Fed's June meeting - kept interest rates unchanged for the fourth time in a row, and the dot plot showed two rate cuts this year, but the number of officials who expected no rate cuts this year rose to 7, and the rate cut expectations for next year were cut to 1. Powell continued to call for uncertainty, and the current economic situation is suitable for waiting and watching. He also expects tariff-driven inflation to rise in the coming months.
Technical analysis:
Today's buying and selling boundaries:
1.3432
Support and resistance levels:
1.3507
1.3479
1.3461
1.3403
1.3385
1.3357
Trading strategy:
If the price breaks through 1.3432, consider buying, and the first target price is 1.3461
If the price breaks through 1.3403, consider selling, and the first target price is 1.3385
Gbpusdanalysis

GBPUSD Analysis todayHello traders, this is a complete multiple timeframe analysis of this pair. We see could find significant trading opportunities as per analysis upon price action confirmation we may take this trade. Smash the like button if you find value in this analysis and drop a comment if you have any questions or let me know which pair to cover in my next analysis.

GU-Thu-19/06/25 TDA-Fed rate unchanged, now BoE rate decisionAnalysis done directly on the chart
Follow for more, possible live trades update!
Few beneficial things by posting public ideas
1) I improve a lot by doing this every single day
2) People can benefit from my analysis
3) Everyone can still trade their own style and
Strategy and having general idea on htf.
4) Taking myself accountable and be consistent in what I do
5) I can watch and rewatch as many times I
Want and learn more and more
Active in London session!
Not financial advice, DYOR.
Market Flow Strategy
Mister Y

GBPUSD I Technical & Fundamental Forecast Welcome back! Let me know your thoughts in the comments!
** GB{USD Analysis - Listen to video!
We recommend that you keep this pair on your watchlist and enter when the entry criteria of your strategy is met.
Please support this idea with a LIKE and COMMENT if you find it useful and Click "Follow" on our profile if you'd like these trade ideas delivered straight to your email in the future.
Thanks for your continued support!Welcome back! Let me know your thoughts in the comments!

Analysis of GBPUSD 1-Hour Chart Signaling Bullish TrendAnalysis of GBP/USD 1-Hour Chart Signaling Bullish Trend 📈
I. Support Levels & Chart Patterns
Support Confirmation
After testing the 1.34135 support zone, price rebounded sharply with consecutive bullish candles 🚀, forming a potential "double bottom" pattern (or wave low). This successful defense of support reinforces the foundation for upward movement 🏗️.
Resistance Breakout Potential
Price is currently advancing from the 1.34600 short-term support. The key resistance lies at 1.35160. A decisive breakout above this level would validate the bullish projection indicated by the upward arrows on the chart 🎯
⚡️⚡️⚡️ GBPUSD ⚡️⚡️⚡️
🚀 Buy@ 1.33500 - 1.34000
🚀 TP 1.35000 - 1.35500
Accurate signals are updated every day 📈 If you encounter any problems during trading, these signals can serve as your reliable guide 🧭 Feel free to refer to them! I sincerely hope they'll be of great help to you 🌟 👇

GBP/USD Hits June LowGBP/USD Hits June Low
As the GBP/USD chart shows, the pair dropped sharply last night, falling below the 1.34170 level. This move marked the lowest point for the pound against the dollar since the beginning of June.
One of the main drivers behind this decline is the strengthening of the US dollar, which is attracting market participants amid heightened geopolitical tensions and a potential escalation of military conflict between Iran and Israel, involving US armed forces. According to the latest reports, Donald Trump has warned Tehran that US patience is wearing thin.
Today, however, the pound has seen a slight rebound, supported by the release of the UK Consumer Price Index (CPI). While the data confirmed that inflation is easing, the pace of decline is slower than expected. This may reduce the likelihood of interest rate cuts by the Bank of England – which in turn has boosted the pound’s value.
What could happen next?
Technical Analysis of the GBP/USD Chart
Since the end of May, price fluctuations have formed an ascending channel (shown in blue), with bulls making several attempts to break the resistance level at 1.3600 – so far, without much success.
The sharp decline from point A to B suggests that the bears have seized the initiative, with the pair rebounding from the lower boundary of the blue channel.
GBP/USD traders may:
→ interpret the bounce from the lower blue boundary as an upward correction following a sharp fall;
→ use Fibonacci retracement levels to estimate potential upside. In such cases, particular attention is typically given to the 0.5–0.618 zone (highlighted in orange). Here, it aligns with the 1.3526 level, which acted as support on 12–13 June, but may now serve as resistance after being breached.
This article represents the opinion of the Companies operating under the FXOpen brand only. It is not to be construed as an offer, solicitation, or recommendation with respect to products and services provided by the Companies operating under the FXOpen brand, nor is it to be considered financial advice.

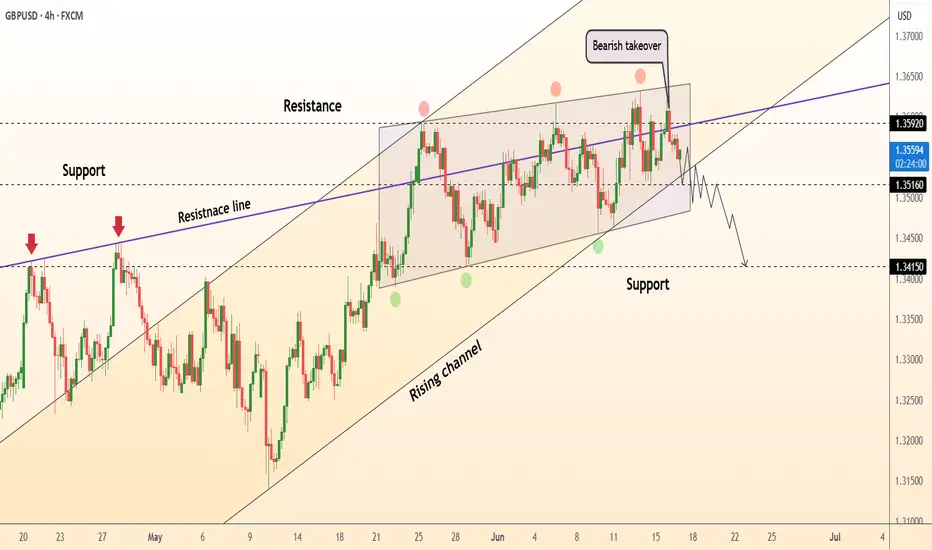
DeGRAM | GBPUSD moving in the rising wedge📊 Technical Analysis
● A five-week rectangle at the channel top has broken south after a bearish engulfing, turning 1.3550 into fresh supply; the break also pierces the inner purple resistance line that capped every rally since April.
● Momentum now points to the channel mid-band/May swing low at 1.3516; loss of that neckline activates the measured move toward the lower rail and horizontal support at 1.3415.
💡 Fundamental Analysis
● Pre-BoE election-period caution and firmer post-FOMC USD yields have widened the short-term gilt–UST spread, draining bid tone from sterling.
✨ Summary
Sell 1.3530-1.3560; break below 1.3516 targets 1.3415. Bear view invalidated on an H4 close above 1.3592.
-------------------
Share your opinion in the comments and support the idea with a like. Thanks for your support!
GU-Wed-18/06/25 TDA-Amid middle east tensions, USD strengtheningAnalysis done directly on the chart
Follow for more, possible live trades update!
Just like a person that wants to become a doctor,
an engineer or whatever. It needs to study, learn,
apply, improve, and repeat the process again and again.
You can't pretend to know how to trade, if you haven't
gone through the process of study, learning, applying
and improving.
Active in London session!
Not financial advice, DYOR.
Market Flow Strategy
Mister Y

#GBPUSD: Smaller Time-Frame Tells A Different Story! GBPUSD has exhibited strong bullish sentiment in shorter timeframes. However, an analysis of shorter timeframes reveals a different picture. The current price trend is upward, and it is anticipated to continue. Nevertheless, we anticipate a price correction around 1.3470, followed by a continuation of the bullish move. We strongly recommend conducting your own analysis before making any investment decisions.
Best of luck in your trading endeavours, and please remember to prioritise safety.
Kindly consider liking, commenting, and sharing this analysis for further insights.
Team Setupsfx_

GBP/USD Bearish Rejection at Resistance Zone – Downside Targets GBP/USD Bearish Rejection at Resistance Zone – Downside Targets Ahead 🚨
This chart analysis of GBP/USD reveals a clear bearish structure unfolding after the pair tested a strong resistance zone near the 1.36000 level. Here's the professional breakdown:
🔴 Key Resistance Zone: 1.36000 – 1.36200
Price has been rejected multiple times from this upper zone (marked in red).
Repeated upper wicks and lower closes signal selling pressure.
Recent candle formations suggest a potential reversal from this level.
🟢 Major Support Zones:
1.33090 (Mid-Level Support)
This level has acted as a reaction zone in the past.
Could provide temporary consolidation or bounce.
1.31500 – 1.32000
Strong historical support, price bounced here previously.
Bears might slow down in this area before continuation.
1.28000 – 1.29000
Deeper support zone; if broken, could indicate a major trend shift.
📉 Bearish Projection
Price is expected to descend toward 1.33090, and if momentum continues, potentially down to the 1.28 region.
The zigzag projection in the black box reflects a stair-step pattern typical of strong bearish legs.
🧠 Market Psychology & Price Action
Sellers are defending the resistance aggressively.
Lower highs and consistent rejection candles imply weakening bullish momentum.
This setup aligns with a distribution phase before a drop.
📌 Conclusion
🔻 As long as the price remains below the 1.36000 resistance, the bias remains bearish. Watch for confirmations at 1.33090 and 1.32000 – these are crucial zones where price decisions will unfold.
📆 Short to mid-term traders may look for sell setups on retracements with stop-losses above the resistance and targets near support zones.

GU-Tue-17/06/25 TDA-Daily resistance 1.36155 holding strong!Analysis done directly on the chart
Follow for more, possible live trades update!
No one is born with skills and knowledge.
Everyone see the success but not the struggle
behind everything (not all of course). If you want
to get out of a situation, you need to learn to be
uncomfortable and getting out of your comfort zone.
Active in London session!
Not financial advice, DYOR.
Market Flow Strategy
Mister Y

GBPUSD(20250617)Today's AnalysisMarket news:
Revised version of the Republican tax cut bill in the US Senate: It is proposed to raise the debt ceiling to 5 trillion, and the overall framework is consistent with the House version.
Technical analysis:
Today's buying and selling boundaries:
1.3577
Support and resistance levels:
1.3664
1.3632
1.3611
1.3544
1.3522
1.3490
Trading strategy:
If it rises and breaks through 1.3577, consider entering the market to buy, and the first target price is 1.3611
If it falls and breaks through 1.3544, consider entering the market to sell, and the first target price is 1.3522

GBPUSD ANALYSIS After seeing how the previous daily candle close bullish and the 4hr structure make a retracement to a key level of 1.35626, we could be looking for another push leg up to make a new HH on the 4hr but waiting for confirmation on the daily timeframe.

GBPUSD ANALYSISAfter seeing the previous weekly candle close bullish, and the structure on the daily and 4hr timeframes all pointing to a bullish trend we could expect the market to make a new leg to the upside.

GU-Mon-16/06/25 TDA-All major banks rate decisions this week!Analysis done directly on the chart
Follow for more, possible live trades update!
To measure your consistency performance, you
need years of track record. Having good days or
weeks or months is not enough to say that you
are consistently profitable. This is the reality of
trading. You need to adapt to how market is
changing and with time that really proves how
good you are.
Active in London session!
Not financial advice, DYOR.
Market Flow Strategy
Mister Y

GBPUSDGBPUSD needs one more push up before a drop.
Disclosure: We are part of Trade Nation's Influencer program and receive a monthly fee for using their TradingView charts in our analysis.

GBPUSD | 2 Long Scenarios | The Empire will strike backGeneral
GBPUSD fell through the first big support zone (Zone 2) unless a reclaim i am not gonna look for longs currently. Personally waiting for price falling deeper into Zone 1. Marked 2 Scenarios that i would want to see to develop.
Be aware that i usually use LTF (such as the 1 hour chart to plan my entries). Meaning the SLs and RR are not completly correct as shown.
1. Long (Green arrow)
Price moves below Zone 1. Reclaim. Enter on reclaim.
Target: Slightly below Zone 3
Stop- Loss: Depending on the LTF entry i wouldnt want to see it going below Zone 1 again
Time duration: Days, weeks, months, years... ;)
2. Long (Orange arrow)
Price pushes into Zone 1, reacts supportive and then generates a Swing. Enter on breaking of the generated swing.
Target: Slightly below Zone 3
Stop- Loss: A bit below of top of the Zone 1
Time duration: Days, weeks, months, years... ;)
Good luck
Disclaimer:
- This information does not constitute as financial advice and is only for educational purposes. I am not your financial advisor.
- You trade entirely at your own risk
- Make your own research
- Finance and trading is evil, capitalism is bad, duh ;)

GBPUSD will continue to rise and break last week's highGBPUSD is correcting lower in the range at the end of the week. This pullback is heading towards the 1.350 support. There will be a bullish reaction at this area. Or if the selling pressure really takes over the market at this support area, then pay attention to the 1.346 bottom for the BUY strategy of this currency pair.
On the other hand, 1.360 will prevent the price increase. It will act as strategic resistance before a new extended breakout to the upside.
The uptrend is more likely to continue than the downtrend, so prioritizing BUY signals will bring better profits to the currency pair.
Support: 1.350, 1.346
Resistance: 1.360, 1.366

GU-Fri-13/06/25 TDA-Difficult zone, prioritize risk management!Analysis done directly on the chart
Follow for more, possible live trades update!
June definitely showing slower price action,
tighter range movement (average daily movement).
This is how markets work! Some months it gives
good push, wide average daily movement. Some others,
it gives less average daily movement and slower pushes.
Active in London session!
Not financial advice, DYOR.
Market Flow Strategy
Mister Y

GBPUSD(20250613)Today's AnalysisMarket news:
The number of initial jobless claims in the United States for the week ending June 7 was 248,000, higher than the expected 240,000, the highest since the week of October 5, 2024. The monthly rate of the core PPI in the United States in May was 0.1%, lower than the expected 0.30%. Traders once again fully priced in the Fed's two interest rate cuts this year.
Technical analysis:
Today's buying and selling boundaries:
1.3585
Support and resistance levels
1.3685
1.3648
1.3624
1.3547
1.3522
1.3485
Trading strategy:
If the price breaks through 1.3624, consider buying in, the first target price is 1.3648
If the price breaks through 1.3585, consider selling in, the first target price is 1.3547

GBP/USD Rally Resumes – Bullish Targets AheadHi everyone,
As outlined in our previous GBP/USD analysis (idea linked below), the Cable confirmed its continued rally following a decisive break above the 1.35195 level. This was quickly followed by a move through our highlighted levels at 1.35630 and 1.35934.
As previously noted, the clearance of these levels strengthens our expectation for further upside, with the next key level of interest around 1.36850. We'll be watching to see how price action develops from here.
We’ll continue to provide updates on the projected path for GBP/USD as price approaches this target.
The longer-term outlook remains bullish, and we expect the rally to continue extending further from the 1.20991 January low.
We’ll be keeping you updated throughout the week with how we’re managing our active ideas. Thanks again for all the likes/boosts, comments and follows — we appreciate the support!
All the best for the week ahead. Trade safe.
BluetonaFX


GBPUSD is rising towards the resistance zone of 1.35600GBPUSD is heading towards 1.35600. If the gold price closes around this area, it confirms that the buyers have entered the market. You can set up a BUY signal now with SL placed below the candle wick. After touching 1.356, we can wait for the price reaction and set up a SELL signal again following the sideways border.
Do you agree with our view of buying 1.34900 and SL 1.34600?
Leave a comment
