Consolidation ahead of the next bullish rallyThe GBP/USD exchange rate has edged lower below the three-year high of 1.3592 set in May. To sustain the upward momentum, prices need to decisively close above the resistance line of 1.3597 since July 2023 (which capped gains last week). A breakthrough above the key resistance zone of 1.3658 could trigger a stronger rally, targeting the 2022 high of 1.3747. Further breakthroughs may shift market focus to the upward trendline (around 1.3865). Technically, short-term risks remain biased to the upside, supported by the rebound of the stochastic oscillator.
Humans need to breathe, and perfect trading is like breathing—maintaining flexibility without needing to trade every market swing. The secret to profitable trading lies in implementing simple rules: repeating simple tasks consistently and enforcing them strictly over the long term.
Trading Strategy:
buy@1.3490-1.3500
TP:1.3550-1.3600
Gbpusdanalysis

GBP/USD M15 Support & Resistance Levels🚀 Here are some key zones I've identified on the 15m timeframe.
These zones are based on real-time data analysis performed by a custom software I personally developed.
The tool is designed to scan the market continuously and highlight potential areas of interest based on price action behavior and volume dynamics.
Your feedback is welcome!

GU-Tue-3/06/25 TDA-DR 1.35577 tapped, GU consolidatingAnalysis done directly on the chart
Follow for more, possible live trades update!
Consistency, build solid confidence in your
execution, management. It's not easy, but
if your plan is to stay for the long term. With
discipline, consistently showing off, patience,
dedication, study, learn, apply. You'll eventually
get there!
Not financial advice, DYOR.
Market Flow Strategy
Mister Y

The current trend of the US dollar remains bullish.During the European session, the US Dollar Index extended its weakness, falling 0.67% intraday to 98.7731, approaching the low seen on April 22nd. GBP/USD rose synchronously by 0.61% to 1.3538.
Key Drivers:
Tariff rhetoric reignites market concerns
Potential impact of the S899 clause
Diverging expectations on Federal Reserve policy
ING analyst Chris Turner noted: "The risk of early termination of the trade agreement and the S899 clause have created dual pressures, causing the US dollar to continue weakening. GBP/USD is likely to remain bullish-dominated."
Humans need to breathe, and perfect trading is like breathing—maintaining flexibility without needing to trade every market swing. The secret to profitable trading lies in implementing simple rules: repeating simple tasks consistently and enforcing them strictly over the long term.
Trading Strategy:
buy@1.13400-1.13450
TP:1.13550-1.13600

GU-Mon-2/06/25 TDA-GU pushing up, possible breakout buy!Analysis done directly on the chart
Follow for more, possible live trades update!
Breakout trade:
It's always good to wait for candle closure above
or below certain levels (depending on if you are buying
or selling). Then have lower timeframe structure to
put good sl and be able to manage properly.
Always know beforehand where to put your sl and tp.
Not financial advice, DYOR.
Market Flow Strategy
Mister Y

SHORT IT !! - GBPUSD SHORT FORECAST Q2 W23 D2 Y25GBPUSD SHORT FORECAST Q2 W23 D2 Y25
🔥👀QUICK SCOPE TECHNICAL REVERSAL HOT PICK
Professional Risk Managers👋
Welcome back to another FRGNT chart update📈
Diving into some Forex setups using predominantly higher time frame order blocks alongside confirmation breaks of structure.
Let’s see what price action is telling us today!
💡Here are some trade confluences📝
✅Weekly order block
✅15' order block
✅4 hour order block
✅Tokyo ranges to be filled
🔑 Remember, to participate in trading comes always with a degree of risk, therefore as professional risk managers it remains vital that we stick to our risk management plan as well as our trading strategies.
📈The rest, we leave to the balance of probabilities.
💡Fail to plan. Plan to fail.
🏆It has always been that simple.
❤️Good luck with your trading journey, I shall see you at the very top.
🎯Trade consistent, FRGNT X

GBPUSD Holds Above 1.34 – Is 1.35 the Launch Pad?In last week’s GBPUSD outlook, I pointed to the 1.34 zone as a potential buy area and likely end of the correction.
The market reacted as expected, reversing from 1.34 and rallying to 1.35. Toward the end of the week, a brief correction followed — but price held above 1.34 and has now returned to 1.35, printing a higher low in the process.
📌 From both a technical and psychological standpoint, 1.35 remains a key level. A confirmed break above could lead to a retest of the recent high — or even push for a new high.
✅ My bias stays bullish as long as 1.34 support remains intact.
Disclosure: I am part of TradeNation's Influencer program and receive a monthly fee for using their TradingView charts in my analyses and educational articles.

GBPUSD Support & Resistance LevelsThese zones have been generated using a custom-built software tool, developed and refined over an extended period of time. The tool is the result of dedicated effort and research, aiming to identify high-probability support and resistance areas with precision.

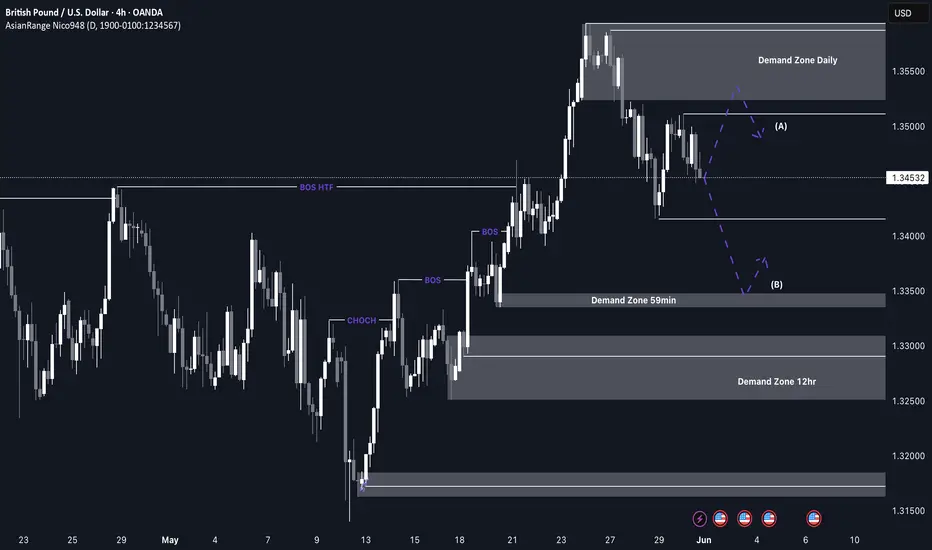
GBP/USD Shorts from the daily supplyI’m anticipating a potential retracement as price has been heavily bullish and is now beginning to show signs of being overbought. After recently breaking major structure to the upside, there’s room for a temporary sell-off as price corrects before continuing higher.
I’ll be watching for possible reactions from the 59-minute demand zone for a minor bounce, but the more ideal long opportunity would be at the 12H demand zone around 1.3300, where structure is cleaner and confluences align.
Confluences for Short-Term Sells:
- A recent change of character (CHOCH) to the downside signals a shift in momentum
- A clean daily supply zone has been left behind that could initiate a deeper pullback
- Significant liquidity below, including the Asia low, ready to be swept
- For price to maintain long-term bullish movement, it must first correct, fill imbalances, and mitigate valid demand levels
P.S. If price drops further and breaks structure, we’ll likely see a new supply zone form. This will provide a closer and more refined opportunity to participate in the move.
Stay sharp and trade safe! 📉📈
Long term vision on Pound, seems bullish.Not muc to say, graph is so clear.
If we look at the long term chart - which starts in 2008 crisis, trend broken in 2024 summer.
We can see a clean breakout from the fallen wedge, also there is a cup % handle breakout in the last candle.
As a supporting point, my power indicators are also supporting a long signal.
So it's a clear bullish signal on my side.
Be aware that each candle represents 3 months.
Wondering about your thoughts!

EURUSD,GBPUSD and AUDUSD Analysis todayHello traders, this is a complete multiple timeframe analysis of this pair. We see could find significant trading opportunities as per analysis upon price action confirmation we may take this trade. Smash the like button if you find value in this analysis and drop a comment if you have any questions or let me know which pair to cover in my next analysis.

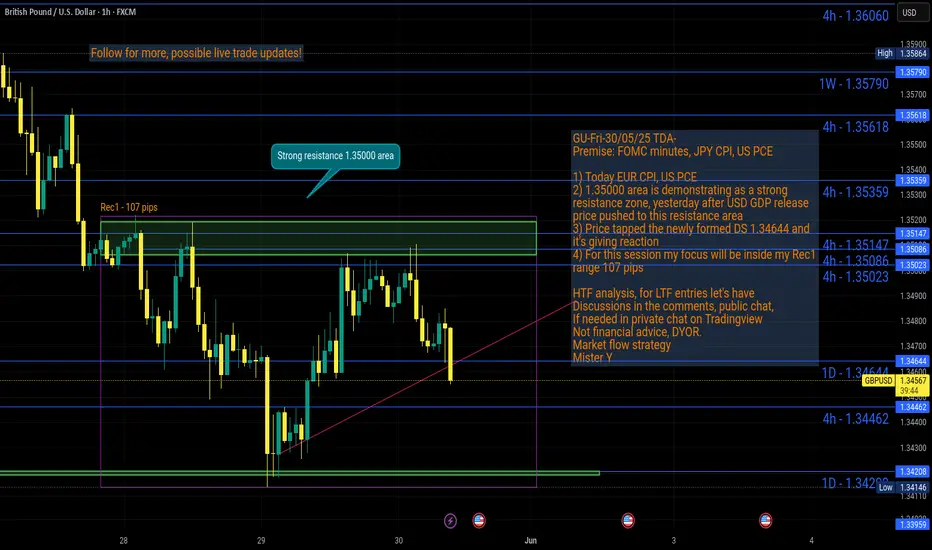
GU-Fri-30/05/25 TDA-Strong resistance 1.35000 zone! Analysis done directly on the chart
Follow for more, possible live trades update!
I trade zone to zone, from support to resistance,
and vice versa. Once I see price entering my
zone of interest, I see how candle reacts to the
level.
Not financial advice, DYOR.
Market Flow Strategy
Mister Y
GBP/USD – Correction in Progress - Where to buy?A few days ago, I pointed out that GBP/USD broke above key resistance from above 1.34, and even cleared the psychological barrier at 1.35.
That breakout opened the door for a potential move toward 1.4000, and I suggested that traders should look for buying opportunities on pullbacks.
Well — we’re in that pullback now.
So, where do we buy?
📍 The most obvious area is the old resistance around 1.3430. But here’s the catch:
GBP/USD is notorious for fakeouts and spikes.
If price tests that level, it could easily dip under 1.34, take out stops, and only then reverse to the upside.
🛡️ Bottom line: If you’re buying the dip, set your stop-loss wisely
Disclosure: I am part of Trade Nation's Influencer program and receive a monthly fee for using their TradingView charts in my analyses and educational articles.

GU-Thu-29/05/25 TDA-Zone of conflict of interest, Bull and Bear!Analysis done directly on the chart
Follow for more, possible live trades update!
Predicting the market is impossible, you react
to how price is forming and telling you the volume
strength, potential push/consolidation/pullback.
Not financial advice, DYOR.
Market Flow Strategy
Mister Y

CONFLUENCE KEY GBPUSD SHORT FORECAST Q2 W22 D29 Y25GBPUSD SHORT FORECAST Q2 W22 D29 Y25
🔥👀QUICK SCOPE TECHNICAL REVERSAL HOT PICK
Professional Risk Managers👋
Welcome back to another FRGNT chart update📈
Diving into some Forex setups using predominantly higher time frame order blocks alongside confirmation breaks of structure.
Let’s see what price action is telling us today!
💡Here are some trade confluences📝
✅Weekly order block
✅15' order block
✅1 hour order block
✅Tokyo ranges to be filled
🔑 Remember, to participate in trading comes always with a degree of risk, therefore as professional risk managers it remains vital that we stick to our risk management plan as well as our trading strategies.
📈The rest, we leave to the balance of probabilities.
💡Fail to plan. Plan to fail.
🏆It has always been that simple.
❤️Good luck with your trading journey, I shall see you at the very top.
🎯Trade consistent, FRGNT X

GBP/USD Correction Potentially Complete – Key Breakout LevelsHi everyone,
GBP/USD has been undergoing a short-term correction since the start of the week. Our view is that this correction may now be complete, with the bullish trend potentially resuming.
For confirmation, we’re watching for a break above the 1.35195 level, followed by a move through 1.35934.
If these levels are cleared, we anticipate further upside. We’ll continue to share updates on the projected path for GBP/USD should price action reach our key zone.
The longer-term outlook remains bullish, and we expect the rally to extend further from the 1.20991 January low.
We’ll be keeping you updated throughout the week with how we’re managing our active ideas. Thanks again for all the likes/boosts, comments and follows — we appreciate the support!
All the best for the week ahead. Trade safe.
BluetonaFX

GBP/USD Analysis: Price Searching for SupportGBP/USD Analysis: Price Searching for Support
In the second half of May, the British pound showed notable strength: from its 12 May low, GBP/USD climbed to a peak on 26 May — marking its highest level in over three years.
Demand for the pound has been driven by several factors:
→ A surge in inflation. CPI data released last Wednesday came in above expectations. As a result, market participants interpreted this as a reason for the Bank of England to remain cautious about cutting interest rates. Holding rates at elevated levels is generally considered bullish for the pound.
→ The pound’s relative resilience amid trade tensions, particularly following a newly signed agreement with the US, as well as strengthening trade ties between the UK and the EU.
Can the pound continue to rise? The GBP/USD chart offers reasons for doubt.
Technical Analysis of the GBP/USD Chart
Recent price movements have formed an ascending channel (outlined in blue), and earlier this week, demand was so strong that the pair briefly moved above the upper boundary. But what happened next?
That strong buying momentum appears to have faded — resulting in a sequence of lower highs (A→B→C→D), suggesting that the market may be searching for a foothold. Today’s bounce (highlighted by the arrow) hints that such a foothold may have been found. But how reliable is it? And can the uptrend be resumed?
→ From a bullish perspective: Support may be provided by the lower boundary of the channel, reinforced by the 1.345 level.
→ From a bearish perspective: The 1.352 level is acting as resistance, further strengthened by the median line.
It is possible that the area marked by lower highs (A→B→C→D) could ultimately prove to be an insurmountable barrier for the developing uptrend on the GBP/USD chart.
This article represents the opinion of the Companies operating under the FXOpen brand only. It is not to be construed as an offer, solicitation, or recommendation with respect to products and services provided by the Companies operating under the FXOpen brand, nor is it to be considered financial advice.

GBPUSD|SHORT"I’m sharing this analysis with you based on Fibonacci tools, a retraced descending channel, and key supply and demand zones."
its just my idea so use m/m

GU-Wed-28/05/25 TDA-Heavy pump and dump pre FOMC minutes!Analysis done directly on the chart
Follow for more, possible live trades update!
Multitasking is good once you have mastered
each single task because you have practiced,
trained your subconscious mind so much that
your brain subconsciously automatically act
accordingly.
And this is where developing good
pattern recognition on how price is moving will
help you enhance your trading skills!
It requires time, a lot but a lot of dedication,
accepting the fact that your not good enough yet.
Trick your mind by thinking you are always two
steps behind. (even if you see good results!)
And learn from your mistakes: Journaling!
Do before, during, after trade analysis!
Not financial advice, DYOR.
Market Flow Strategy
Mister Y

GBPUSD Near Key Resistance – Watching for PullbackGBPUSD has surged to test the 1.3538 resistance, forming a strong impulsive rally supported by higher lows and tight bullish consolidation patterns. However, price is now pressing into a major horizontal resistance and rising trendline, setting up for either continuation or correction.
Key Levels:
Major Resistance: 1.35389 (previous high, potential double top)
Trendline Support: ~1.3440 (ascending structure)
Downside Target (if break occurs): 1.3140 (range floor)
Scenarios to Watch:
🔹 Bearish Scenario (Primary Watch)
Price reacts to 1.3538 and forms a rejection candle
Break of the ascending trendline may trigger a retracement
Downside target zones:
1.3440 (initial structure)
1.3140 (major support zone)
🔹 Bullish Breakout (Alternate Scenario)
Clean break and close above 1.3538
Would invalidate short-term correction and open path to new highs
Momentum continuation possible toward 1.3600–1.3700
Pattern Notes:
Bullish structure with minor flags and wedges in the uptrend
But rally is extended and hitting overbought territory near resistance
RSI divergence or reversal patterns around this level would strengthen short case
Conclusion:
📌 GBPUSD is at a major resistance. Watch for rejection or breakout.
📌 If it holds below 1.3538 and breaks trendline, short setup is favored.
📌 If it breaks out above 1.3538 with volume, stay out of shorts and wait for retest.

EUR USD Entry Setup EUR USD has formed a bullish break and retest and has also retraced back to the 50-618 FIB retracement level.
The trend is bullish so we will continue to look for buying opportunities

GU-Tue-27/05/25 TDA-Great pullback, good structure is forming!Analysis done directly on the chart
Follow for more, possible live trades update!
Consistency, show up daily is not easy. Many
in fact will quit. If you want to really get good
at something you need to put into hard work.
Short cuts will benefit short term, but long term
it will cost you!
Not financial advice, DYOR.
Market Flow Strategy
Mister Y

GBPUSD Trade IdeaThe GBPUSD pair is showing a strong bullish trend on the 4-hour chart. However, the price currently looks overextended. This suggests the market may be due for a corrective pullback.
I’m watching for a pullback into a discounted zone near the fair value gap.
If the price moves back into this zone, I’ll look for a bullish break of market structure as a signal to enter long.
This plan emphasizes patience and the importance of waiting for a favorable entry rather than chasing an extended move. As always, this is my personal strategy and not financial advice. Proper risk management and discretion are essential.
