GBPUSD NeutralTime Frame: 4H
Symbol: GBPUSD
Bias: Neutral
The current price pattern and the momentum structure of this pair does not show any strong evidence medium or high scale price move. We therefore stay neutral.
Gbpusdforecast

EURGBP Prediction H1Here is my view for GBPUSD on H1. The price should go up, you can put a pending order on the Order block or find an entry on LTF within OB Zone. Trade Safe!

GBPUSD NeutralTime Frame: 4H
Symbol: GBPUSD
Bias: Neutral
For GBPUSD our bias is neutral today. We do not see any specific bias . We have to wait for a better time for entry.

GBPUSD ShortTime Frame: 4H
Symbol: GBPUSD
Entry: 1.30896
TP: 1.27396
SL: 1.33107
Bias: Short
GBPUSD will go further down as it will not not be able to stand against its pairing currency . We expect a selling opportunity.

GBPUSD Prediction H1Here is my view for GBPUSD on H1. The price should go down, you can put a pending order on the Order block or find an entry on LTF within OB Zone. Trade Safe!

GBPUSD LongTime Frame: 4H
Symbol: GBPUSD
Entry: 1.31485
TP: 1.34731
SL: 1.30256
Bias: Long
The current price structure and the volatility patterns of this instrument suggest a bearish bias . Our goal is to go short with proper money management.

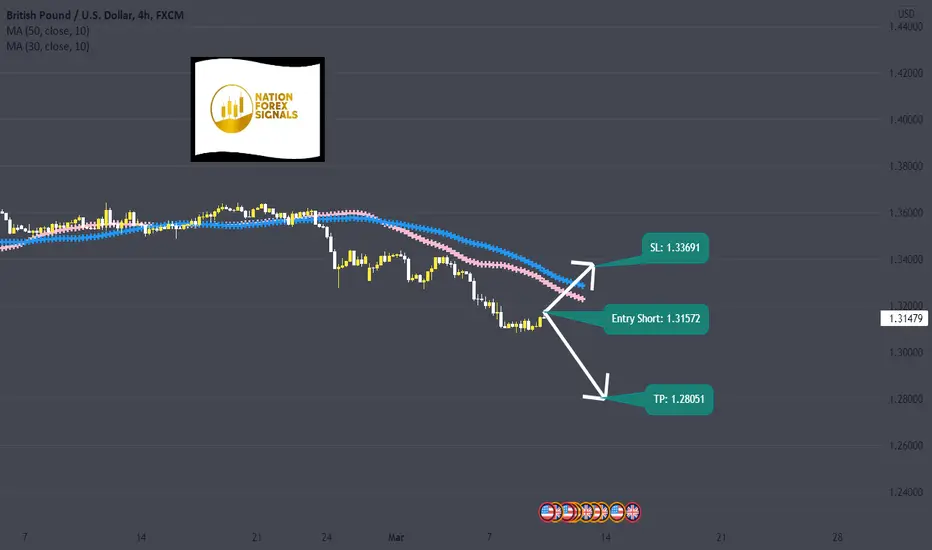
GBPUSD ShortTime Frame: 4H
Symbol: GBPUSD
Entry: 1.31572
TP: 1.28051
SL: 1.33691
Bias: Short
For this instrument our projection is bearish and we believe the pair will continue moving further down following the beaten track.
GBPUSD ShortTime Frame: 4H
Symbol: GBPUSD
Entry: 1.31050
TP: 1.28045
SL: 1.33279
Bias: Short
For this instrument, our bias is short and we anticipate a further short move from the current price structure.

New Lows For The GBPSPrice has pushed the previous low around 1.31575. This indicates continued sellers for the GBP. On the daily timeframe you can see more fluctuations. I'm anticipating more sells until price begins to correct itself again.
This is just something to keep your eyes on.

GBPUSD ShortTime Frame: 4H
Symbol: GBPUSD
Entry: 1.31502
TP: 1.29781
SL: 1.32944
Bias: Short
The price pattern of GBPUSD is also indicating a short bias. Our goal is to go with the current short ride. There is no strong possibility for a long movement standing against dollar. So, our expectation is high for shorting.

GGBP/USD is challenging its strong support zone. Will it bounce?After breaking below the trendline support, what bit confirmed that the GBP/USD will test its significant support level, and it happens.
Now the question is will GBP/USD bounce from the strong support level?
We have seen gold and oil didn't respect any substantial resistance. EUR/USD is falling apart and not the following support as well. So, can GBP/USD respect the support zone and bounce?
From my view, GBP has 50/50 chances. As long as GBP/USD is above 1.3150, I believe that GBP/USD will bounce nearly 1.3350 zones. After that, if the Russia-Ukraine war turns into a more critical situation or if GBP/USD breaks below the 1.3150 zones, it has a big room to drop till 1.2800.
So, I suggest you put one sell limit order at 1.3350 or sell after a breakout at 1.3150. Our first target to the downside is 1.3000, and the final target is 1.2800.
Remember: as long as the Russia-Ukraine war exists, we should not buy GBP and EUR. As commodities prices rise, commodities currencies are rising like AUD, NZD, and CAD. Otherwise, they would also drop.
Please like, comment, share, follow, and join me if you like my analysis.


GBPUSD ShortTime Frame: 4H
Symbol: GBPUSD
Entry: 1.32939
TP: 1.31298
SL: 1.34436
Bias: Short
For GBPUSD our bias is short. We believe it may take some strength to stand against dollar and therefore this instrument is not going to overtake the current trend considering the momentum and volatility.

GBPUSD ShortTime Frame: 4H
Symbol: GBPUSD
Entry: 1.33762
TP: 1.32452
SL: 1.35011
Bias: Short
The momentum and the price pattern is obvious that there is a short bias . We can expect a short trade from the current price context.

GBPUSD another opportunity to sell!!GBPUSD as predicted has broken the local support and is likely to move down. the possible sell area as shown on diagram

GBPUSD top-down analysisHello traders, this is the full breakdown of this pair. We will take this trade if all the conditions are satisfied as discussed in the analysis. Smash the like button if you find value in this analysis and drop a comment if you have any questions or let me know which pair to cover in my next analysis.

GBPUSD ShortTime Frame: 4H
Symbol: GBPUSD
Entry: 1.33929
TP: 1.32548
SL: 1.35025
Bias: Short
For GBPUSD our goal is to go short . The pair indicates a propensity to move against the strength of US dollar.

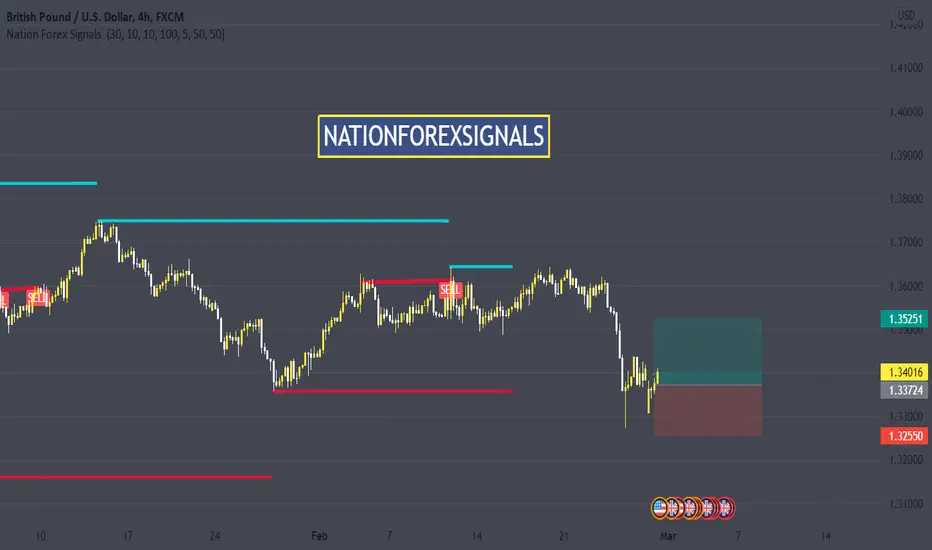
GBPUSD LongTime Frame: 4H
Symbol: GBPUSD
Entry: 1.33789
TP: 1.35251
SL: 1.32550
Bias: Long
For GBPUSD our technical analysis indicates a long trade. After a sharp fall the trend is loitering in a range but the correction move will reset the course for the pair upward and generate a high probability long entry.
GBP/USDHere is Bear Ob Confirmation and a Good Level For Sell So We Can Accpact To Minumum Fill Wick Area

GBPUSD Shorts Continuation ?I m Still bearish on GBPUSD for in Long Runs There are Couple of Reason which Could be Stated . But For Now i m trynna give a GBPUSD setup With Small SL which could become healthy in Long Term Shorts !
Target Must b 1:2 RR , 1:4 RR & 1:10 RR

GBP/USD may drop first before it pulls back to the upside. GBP is a bit under pressure after BOE delivers a dovish statement. But GBP/USD is still supported because of the USD's weakness.
Market commentators said that the sanctions announced by the US against Russia on Tuesday weren't as harsh as feared, facilitating the broad rebound in risk assets and selling pressure on safe-havens.
Market commentators also noted that US officials also committed to implementing further sanctions on Russia if needed.
But still, GBP/USD has big chances to go upside. 1.3640/1.3650 is identified as a trendline and horizontal resistance from the price zone.
So, as long as GBP/USD is below the resistance level, it has chances to drop first. But if GBP/USD can break above the trendline resistance, the scenario will be different than it has a long way to go upside.
On the other hand, 1.3500/1.3480 is a powerful support zone. So, as long as GBP/USD is above 1.3480/1.3500, there will be a strong upside bias.
So, if GBP/USD drops nearly 1.3500/1.3480 price zone, it may be a wise decision to play into buy with stop loss below the 1.3420 price zone.
On the other hand, If GBP/USD breaks above 1.3650, there will be an explicit confirmation of upside breakout. Our first target to the upside is 1.3740/1.3750. Breaking above 1.3750 will open the door for 1.3820, and the final target to the upside is the 1.3950/1.4000 price zone.

GBP/USD Sell Opportunity: Breaks Below The Trendline Support.Hello GBP/USD traders, welcome back again. GBP/USD has closed its candle below the trendline support that has created chances to test one more time 1.3200 price zone.
Last week BoE delivered a dovish statement, and Russia-Ukraine issues have created high demands of the safe-haven USD one more time.
After breaking below the 1.3490 price zone yesterday, it confirms its downtrend again. So, as long as GBP/USD is below the trendline support zone, we will see more selling pressure on GBP/USD.
1.34/40/1.3490 is identified as a selling zone for the current circumstance. Stop-loss should be above its trendline resistance and swing high zone of 1.3645 price zone. Our target zone to the downside is the 1.3200/1.3180 price zone.

GBPUSD top-down analysisHello traders, this is the full breakdown of this pair. We will take this trade if all the conditions are satisfied as discussed in the analysis. Smash the like button if you find value in this analysis and drop a comment if you have any questions or let me know which pair to cover in my next analysis.
