GBP/USD - For FOMC & Fed Interest RateThe GBP/USD pair on the M30 timeframe presents a Potential Buying Opportunity due to a recent Formation of a Channel Pattern. This suggests a shift in momentum towards the upside and a higher likelihood of further advances in the coming hours.
Possible Long Trade:
Entry: Consider Entering A Long Position around Trendline Of The Pattern.
Target Levels:
1st Resistance – 1.3567
2nd Resistance – 1.3682
🎁 Please hit the like button and
🎁 Leave a comment to support for My Post !
Your likes and comments are incredibly motivating and will encourage me to share more analysis with you.
Best Regards, KABHI_TA_TRADING
Thank you.
Disclosure: I am part of Trade Nation's Influencer program and receive a monthly fee for using their TradingView charts in my analysis.
Gbpusdlong

GBPUSD I Technical & Fundamental Forecast Welcome back! Let me know your thoughts in the comments!
** GB{USD Analysis - Listen to video!
We recommend that you keep this pair on your watchlist and enter when the entry criteria of your strategy is met.
Please support this idea with a LIKE and COMMENT if you find it useful and Click "Follow" on our profile if you'd like these trade ideas delivered straight to your email in the future.
Thanks for your continued support!Welcome back! Let me know your thoughts in the comments!

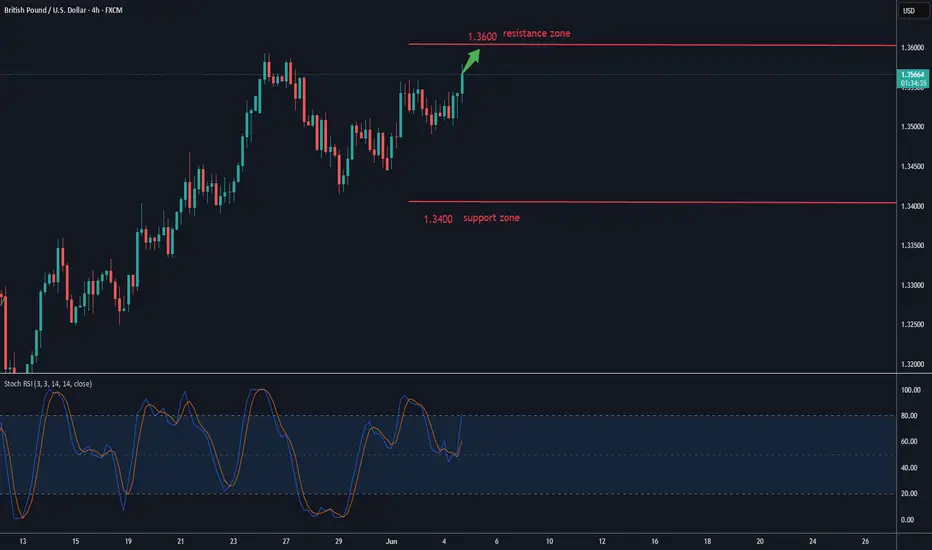
Analysis of GBPUSD 1-Hour Chart Signaling Bullish TrendAnalysis of GBP/USD 1-Hour Chart Signaling Bullish Trend 📈
I. Support Levels & Chart Patterns
Support Confirmation
After testing the 1.34135 support zone, price rebounded sharply with consecutive bullish candles 🚀, forming a potential "double bottom" pattern (or wave low). This successful defense of support reinforces the foundation for upward movement 🏗️.
Resistance Breakout Potential
Price is currently advancing from the 1.34600 short-term support. The key resistance lies at 1.35160. A decisive breakout above this level would validate the bullish projection indicated by the upward arrows on the chart 🎯
⚡️⚡️⚡️ GBPUSD ⚡️⚡️⚡️
🚀 Buy@ 1.33500 - 1.34000
🚀 TP 1.35000 - 1.35500
Accurate signals are updated every day 📈 If you encounter any problems during trading, these signals can serve as your reliable guide 🧭 Feel free to refer to them! I sincerely hope they'll be of great help to you 🌟 👇

GBPUSD SHORT FORECAST Q2 W25 D18 Y25GBPUSD SHORT FORECAST Q2 W25 D18 Y25
Professional Risk Managers👋
Welcome back to another FRGNT chart update📈
Diving into some Forex setups using predominantly higher time frame order blocks alongside confirmation breaks of structure.
Let’s see what price action is telling us today!
💡Here are some trade confluences📝
✅Weekly order block
✅15' order block
✅Intraday 15' break of structure
✅Tokyo ranges to be filled
🔑 Remember, to participate in trading comes always with a degree of risk, therefore as professional risk managers it remains vital that we stick to our risk management plan as well as our trading strategies.
📈The rest, we leave to the balance of probabilities.
💡Fail to plan. Plan to fail.
🏆It has always been that simple.
❤️Good luck with your trading journey, I shall see you at the very top.
🎯Trade consistent, FRGNT X

#GBPUSD: Smaller Time-Frame Tells A Different Story! GBPUSD has exhibited strong bullish sentiment in shorter timeframes. However, an analysis of shorter timeframes reveals a different picture. The current price trend is upward, and it is anticipated to continue. Nevertheless, we anticipate a price correction around 1.3470, followed by a continuation of the bullish move. We strongly recommend conducting your own analysis before making any investment decisions.
Best of luck in your trading endeavours, and please remember to prioritise safety.
Kindly consider liking, commenting, and sharing this analysis for further insights.
Team Setupsfx_

GBPUSD(20250617)Today's AnalysisMarket news:
Revised version of the Republican tax cut bill in the US Senate: It is proposed to raise the debt ceiling to 5 trillion, and the overall framework is consistent with the House version.
Technical analysis:
Today's buying and selling boundaries:
1.3577
Support and resistance levels:
1.3664
1.3632
1.3611
1.3544
1.3522
1.3490
Trading strategy:
If it rises and breaks through 1.3577, consider entering the market to buy, and the first target price is 1.3611
If it falls and breaks through 1.3544, consider entering the market to sell, and the first target price is 1.3522

GBPUSD ANALYSIS After seeing how the previous daily candle close bullish and the 4hr structure make a retracement to a key level of 1.35626, we could be looking for another push leg up to make a new HH on the 4hr but waiting for confirmation on the daily timeframe.

EURUSD, GBPUSD and AUDUSD Analysis todayHello traders, this is a complete multiple timeframe analysis of this pair. We see could find significant trading opportunities as per analysis upon price action confirmation we may take this trade. Smash the like button if you find value in this analysis and drop a comment if you have any questions or let me know which pair to cover in my next analysis.

GBPUSD ANALYSISAfter seeing the previous weekly candle close bullish, and the structure on the daily and 4hr timeframes all pointing to a bullish trend we could expect the market to make a new leg to the upside.

Fundamental Market Analysis for June 16, 2025 GBPUSDEvent to pay attention to today:
15:30 EET. USD - Empire Manufacturing Manufacturing Index
GBPUSD:
The GBP/USD pair remains on the defensive below Friday's three-year high, although it lacks bearish conviction and is trading in a narrow range around 1.3500 during the Asian session.
The latest UK consumer inflation data will be released on Wednesday, ahead of Thursday's Bank of England (BoE) meeting, which will play a key role in influencing the British pound (GBP). In addition, the US Federal Reserve (Fed) plans to announce its monetary policy decision on Wednesday, which will affect the US dollar (USD) exchange rate and give a significant boost to the GBP/USD pair.
Meanwhile, weaker UK GDP data released on Friday, which showed that the economy contracted more than expected by 0.3% in April, reinforced expectations that the BoE will cut interest rates more aggressively than anticipated. On the other hand, the US dollar is receiving some support from the global flight to safe assets caused by rising geopolitical tensions in the Middle East, which is helping to limit the growth of the GBP/USD pair.
However, growing recognition that the US central bank will also resume its rate-cutting cycle in September amid signs of weakening inflation in the US is holding back dollar bulls from aggressive bets. Moreover, the generally positive risk sentiment acts as a barrier to the dollar as a safe haven and provides some support to the GBP/USD pair, which requires some caution before confirming that spot prices have peaked.
Trading recommendation: BUY 1.35500, SL 1.35300, TP 1.36400

GBPUSD | 2 Long Scenarios | The Empire will strike backGeneral
GBPUSD fell through the first big support zone (Zone 2) unless a reclaim i am not gonna look for longs currently. Personally waiting for price falling deeper into Zone 1. Marked 2 Scenarios that i would want to see to develop.
Be aware that i usually use LTF (such as the 1 hour chart to plan my entries). Meaning the SLs and RR are not completly correct as shown.
1. Long (Green arrow)
Price moves below Zone 1. Reclaim. Enter on reclaim.
Target: Slightly below Zone 3
Stop- Loss: Depending on the LTF entry i wouldnt want to see it going below Zone 1 again
Time duration: Days, weeks, months, years... ;)
2. Long (Orange arrow)
Price pushes into Zone 1, reacts supportive and then generates a Swing. Enter on breaking of the generated swing.
Target: Slightly below Zone 3
Stop- Loss: A bit below of top of the Zone 1
Time duration: Days, weeks, months, years... ;)
Good luck
Disclaimer:
- This information does not constitute as financial advice and is only for educational purposes. I am not your financial advisor.
- You trade entirely at your own risk
- Make your own research
- Finance and trading is evil, capitalism is bad, duh ;)

GBP/USD Rally Resumes – Bullish Targets AheadHi everyone,
As outlined in our previous GBP/USD analysis (idea linked below), the Cable confirmed its continued rally following a decisive break above the 1.35195 level. This was quickly followed by a move through our highlighted levels at 1.35630 and 1.35934.
As previously noted, the clearance of these levels strengthens our expectation for further upside, with the next key level of interest around 1.36850. We'll be watching to see how price action develops from here.
We’ll continue to provide updates on the projected path for GBP/USD as price approaches this target.
The longer-term outlook remains bullish, and we expect the rally to continue extending further from the 1.20991 January low.
We’ll be keeping you updated throughout the week with how we’re managing our active ideas. Thanks again for all the likes/boosts, comments and follows — we appreciate the support!
All the best for the week ahead. Trade safe.
BluetonaFX


GBP/USD Technical Analysis – Bearish Setup Developing!GBP/USD Technical Analysis – Bearish Setup Developing! 🔻
Chart Breakdown (H4):
📌 Resistance Zone (🔴 1.35800 – 1.36000):
The pair has been rejected multiple times from this strong resistance area, marked by multiple upper wicks and bearish pressure. Most recent price action shows another rejection, forming a lower high.
📌 Support Level (🟣 1.34732):
This key horizontal level has acted as a strong support multiple times (highlighted with 🟠 circles), suggesting bulls are attempting to defend this zone.
📉 Bearish Structure Formation:
Price recently tested resistance again and was rejected sharply.
A potential double-top or lower high structure is forming.
A break and close below the 1.34732 support will likely confirm bearish momentum.
📍 Next Target (🔻):
If support breaks, price may fall towards the support demand zone around 1.34150 – 1.34300, aligning with the marked red support box.
📈 Invalidation Point:
A clean breakout and hold above 1.36000 would invalidate this bearish bias and potentially signal continuation higher.
⚠️ Summary:
🔼 Resistance Rejection at 1.36000
🔽 Watching for break below 1.34732
🎯 Bearish target: 1.34300 zone
🔄 Invalidation: Break above 1.36000
Bias: 📉 Bearish Below 1.34732

GBPUSD(20250612)Today's AnalysisMarket news:
① The EU hopes that the trade negotiations will be extended beyond the suspension period set by Trump. ② Bessant: As long as "sincerity" is shown in the negotiations, the Trump administration is willing to extend the current 90-day tariff suspension period beyond July 9. ③ Trump will hold multiple bilateral talks during the G7 summit. ④ The total customs revenue of the United States reached a record high of US$23 billion in May, an increase of nearly four times year-on-year. ⑤ Lutnick: One deal after another will be reached.
Technical analysis:
Today's buying and selling boundaries:
1.3525
Support and resistance levels:
1.3627
1.3589
1.3564
1.3486
1.3461
1.3423
Trading strategy:
If the price breaks through 1.3564, consider buying in, the first target price is 1.3589
If the price breaks through 1.3525, consider selling in, the first target price is 1.3486

GBPUSD ready to jump?GBPUSD after retest of the daily support has got a bounce back to the upside with a momentum as the price already has got rejected back, we may see potential trend continuation. We can spot the double bottom on the lower timeframe from this support and may continue to rise to the resistance. A bullish trade is high probable after confirmation of potential inverted head and shoulder

How should GBP bulls prepare for battle?The GBP/USD came under pressure during the North American session, trading near 1.353. The market is digesting a series of upcoming UK domestic data and global macro risk events, with overall volatility likely to increase. The recent high of 1.3616 forms a short-term resistance, while the 1.3500 level below serves as a key support zone. Short-term bulls need to hold the 1.3500 support band. If the price rebounds without breaking this level and can break above the 1.3570–1.3616 resistance area with increased trading volume,
Humans need to breathe, and perfect trading is like breathing—maintaining flexibility without needing to trade every market swing. The secret to profitable trading lies in implementing simple rules: repeating simple tasks consistently and enforcing them strictly over the long term.

"Continue to maintain strength"The GBP/USD trended higher in a volatile manner this week, rising 0.5% on a weekly basis and demonstrating relatively robust performance among major currencies. The UK's exemption from Trump's newly imposed steel and aluminum tariffs provided support for the British pound, with market sentiment remaining relatively optimistic. Analysts noted that the UK's immunity to Trump's steel and aluminum tariffs constitutes a positive factor for the GBP, but next week's employment data will be pivotal. A rise in the unemployment rate for April could weaken the pound's upward momentum. The market holds a positive view on the Bank of England's (BoE) cautious monetary policy stance, believing it will help the GBP maintain its strength in the short term.
Humans need to breathe, and perfect trading is like breathing—maintaining flexibility without needing to trade every market swing. The secret to profitable trading lies in implementing simple rules: repeating simple tasks consistently and enforcing them strictly over the long term.

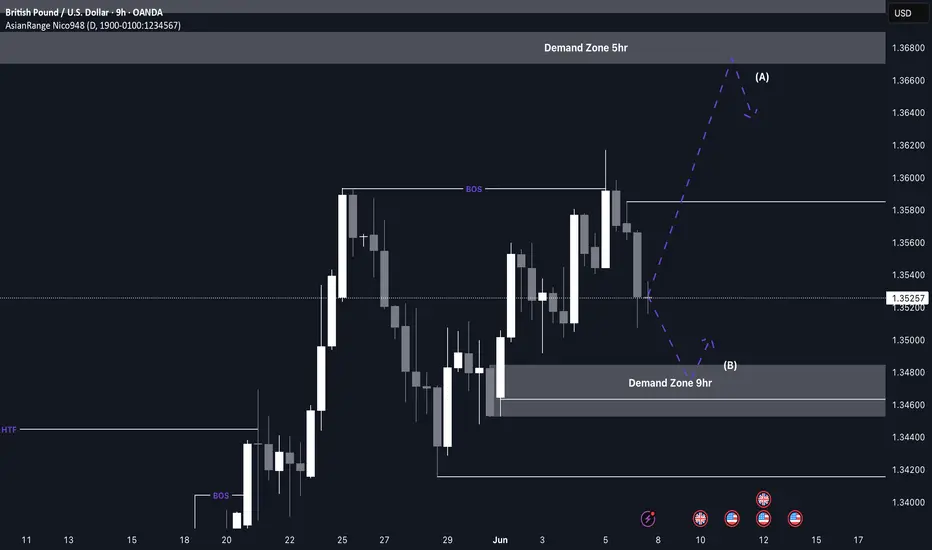
GBP/USD Buys from 1.34800 This week’s analysis focuses on capitalising on the strong bullish structure forming on GU. After a clear break of structure to the upside, price has been forming consistent higher highs and higher lows.
From this move, a key Point of Interest has been left around the 1.34800 level, which aligns with a clean 9H demand zone. As price now needs to retrace after the recent bullish push, this 9H zone becomes a likely area for accumulation and a potential continuation rally.
Confluences for GU Buys:
- GU has been very bullish overall on the higher timeframes
- The 9H demand zone caused the latest break of structure to the upside
- There’s plenty of liquidity and imbalance above that needs to be taken
- The DXY is moving bearish, supporting GU upside
P.S. If price pushes higher before retracing, it may enter a premium supply zone, where I’ll be watching for any significant reaction. Either way, patience is key — don’t hesitate to wait for your setup to fully form.
Wishing you a focused and profitable trading week!
GBPUSD Trading Analysis ### 1. Overall Trend & Market Context
- Bullish Momentum: GBPUSD is in a strong bullish trend, driven by DXY weakness (U.S. Dollar Index declining) and GBP strength. Key factors include:
- Fundamental Drivers:
- UK manufacturing contraction (less severe than expected) and rising housing prices.
- U.S. dollar weakness due to manufacturing slowdown (ISM PMI at 48.5), trade tensions, and fiscal concerns.
- Fed policy uncertainty (rates likely to remain unchanged post-May cut).
- Technical Drivers: Higher lows and higher highs on the 4-hour chart, indicating trend continuation.
### 2. Key Technical Levels & Patterns
- Support Zones:
- 1.3490–1.3500: A critical support area (pullback retracement, 61.8% Fibonacci level).
- 1.34420: Stop-loss level for long positions (below the liquidity pocket).
- Resistance Levels:
- 1.3580: Target for bullish breakout.
- 1.37370: Next major resistance (1:2 risk-reward setup).
- Patterns:
- Bullish Flag: Breakout above key resistance (1.3430) followed by consolidation.
- Broadening Wedge: High volatility pattern with widening highs/lows; potential for breakout (bullish or bearish).
- Bullish Engulfing: Confirmed entry after breaking key support/resistance.
### 3. Trading Opportunities
- Buy Zones:
- 1.3490–1.3500: Entry on breakout from consolidation range (1.3500).
- 1.35260: Buy limit for a liquidity hunt below minor intraday lows.
- Take Profit:
- 1.3580 (first resistance) and 1.37370 (measured move target).
- Risk Management:
- Stop-loss at 1.34420 (below support).
- 1:2 risk-reward ratio for long positions.
### 4. Key Risks & Considerations
- Bearish Scenarios:
- Failure to hold above the breakout zone (1.3500).
- Pressure from resistance at 1.3580.
- Return to consolidation range, delaying the upside move.
- Volatility: Broadening wedge patterns may fake out traders, emphasizing the need for strict risk management.
### 5. Fundamental Outlook
- GBP Strength: UK economic data (housing, manufacturing) supports GBP.
- USD Weakness: U.S. manufacturing slowdown, trade tensions, and fiscal concerns weigh on the dollar.
- Fed Policy: Markets expect rate cuts to continue, further pressuring USD.
### 6. Final Notes & Disclaimers
Stay disciplined, manage risk, and let the market confirm your trades. 📈
*Disclaimer: This is for educational purposes only. Trading involves risk; ensure you understand the risks before trading.*

GBPUSD(20250604)Today's AnalysisMarket news:
Fed Logan: We should focus on achieving the 2% inflation target rather than trying to make up for past inflation shortfalls; Bostic: We still think there may be a rate cut this year.
Technical analysis:
Today's buying and selling boundaries:
1.3521
Support and resistance levels:
1.3588
1.3563
1.3547
1.3496
1.3480
1.3455
Trading strategy:
If the price breaks through 1.3547, consider buying, with the first target price at 1.3563
If the price breaks through 1.3521, consider selling, with the first target price at 1.3496

Can it break through 1.36?The GBP/USD exchange rate continued to trade in a high-range consolidation during the North American session, currently hovering near the 1.353 level with a slight intraday rebound. The US Dollar Index turned lower following the release of weak ADP employment data, providing some support for the British Pound. The US added only 37,000 jobs in the private sector in May, far below the market expectation of 115,000, reinforcing market bets on future Federal Reserve rate cuts. In the short term, the exchange rate may continue to consolidate within the range of 1.3450 to 1.3600. If the US non-farm payroll data remains weak, the exchange rate is expected to break above the 1.3600 level, opening up further upside potential.
Humans need to breathe, and perfect trading is like breathing—maintaining flexibility without needing to trade every market swing. The secret to profitable trading lies in implementing simple rules: repeating simple tasks consistently and enforcing them strictly over the long term.
EURUSD and GBPUSD Breakout?Hello traders, this is a complete multiple timeframe analysis of this pair. We see could find significant trading opportunities as per analysis upon price action confirmation we may take this trade. Smash the like button if you find value in this analysis and drop a comment if you have any questions or let me know which pair to cover in my next analysis.
