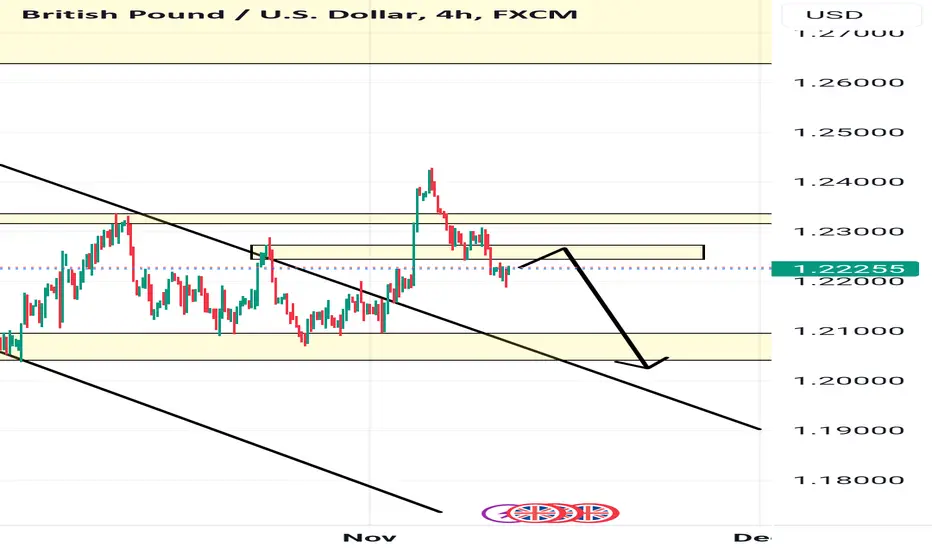
GBP-USDGBPUSD is currently traded at 1.22250. The market created a support area at 1.2200 and that is also a demand area. In a 4-hour timeframe market makes a pennant breaks with high momentum and now retests the support and demand zones.
Gbpusdlong

GBPUSD Technical Analysis And Trade IdeaConducting a thorough analysis of GBPUSD charts reveals a retracement from its recent peak, notably observed on the 1D timeframe, signaling a significant pullback. The key question is whether this retracement will intensify or if there's potential for a rotation at the current level, aiming for liquidity beyond prior highs. Our video explores various time frames, ultimately pinpointing a potential trading opportunity based on market structure, price dynamics, trend analysis, and other crucial elements of technical evaluation.
It's essential to underscore that the insights shared here are intended solely for educational purposes and should not be construed as financial advice. Participation in the foreign exchange market and cryptocurrency trading inherently involves a substantial level of risk. Therefore, it is imperative to strategically incorporate robust risk management strategies into your trading plan to adeptly navigate the challenges associated with these markets.

Israel's military is still tenseUS President Joe Biden's administration is concerned that Israel is trying to provoke a war in Lebanon, causing it to risk becoming a regional war, Axios news portal cited sources as saying.
“Some in the Biden administration are concerned that Israel is trying to provoke (Lebanese Shiite movement) Hezbollah and create a pretext for a larger war in Lebanon that risks drawing in the US and other countries conflict", - the news said.
According to sources, US Defense Secretary Lloyd Austin in a phone conversation last week with his Israeli counterpart Yoav Gallant expressed concern about Israel's role in escalating tensions with Lebanon.
An Israeli army soldier advances during an exercise at a position in Israel's northern Galilee region near the border with Lebanon - Sputnik Vietnam, 1920, November 12, 2023
Palestinian-Israeli conflict tensions
Israel wages a war of attrition in southern Lebanon
According to this news portal, Mr. Austin's message reflects growing concerns in the White House that Israel's military actions in Lebanon are increasing tensions along the border and risk leading to a war. paintings on a regional scale.

GBPUSD I Forecast ahead of CPI newsWelcome back! Let me know your thoughts in the comments!
** GBPUDS Analysis - Listen to video!
We recommend that you keep this pair on your watchlist and enter when the entry criteria of your strategy is met.
Please support this idea with a LIKE and COMMENT if you find it useful and Click "Follow" on our profile if you'd like these trade ideas delivered straight to your email in the future.
Thanks for your continued support!

GBPUSD WEEKLY MAPPINGGBPUSD Mapping
Each zone acts as support (we buy upon confirmation) if the market is above the zone & each zone acts as a resistance (we sell upon confirmation) if the market is below zone.
GBPUSD Long towards 1.22800 (possibly higher)For today's GU breakdown I will be looking for buys from current price as it has tapped in a nice 6hr demand zone that has caused a BOS to the upside. As we have seen from last week's GU analysis we did anticipate scenario (A) to play out and it did so perfectly. Now, we are looking for buys back up as it has filled in the major imbalances left from before.
On Monday I will be looking for a clean entry where I can continue this trend that GU has set to the upside, possibly causing another rally to the upside and a new BOS. In addition to this, the zone also lies between the 0.78 fib range which is a good confluence that price will respect this AOI. As this is an uptrend I can also expect price to push past the 11hr supply (where the take profit target is) and mitigate the extreme supply above it.
Confluences for GBPUSD Longs are as follows:
- 6hr demand zone lies between the 0.78 range on the fib tool.
- Demand zone has also broken structure to the upside following short term bullish trend.
- Price has completed a wyckoff accumulation schematic and CHOCH'd to the upside.
- Lots of liquidity lying above i.e. asian highs and imbalances that need to be filled.
- Dollar index also looking bearish as well good confluence for GU to then push upwards.
- A lot of rejection candles inside zone as well as a consolidation (good sign that price is going to respect that POI.)
P.S. I am still temporarily bullish, but my overall bias is bearish (looking at the monthly/weekly time frames.) Price has also slowed down and sells are getting exhausted hence the consolidation In our POI. I would be looking to see how this plays out on Monday before CPI, then re assess my next potential trading setups for the rest of the week.

GBPUSD LONG SETUP, POSSIBLE SHIFT OF STRUCTURE 1H - 4HHello Traders This is Forex Precision daily Markets Analysis, We found a setup earlier this Week And the price is actually approach our zone so i had to share with you guys this setup, Why do i think is Valid because we already Break 4H structure to the Upside, We have this FVG or Imbalances that's has ben filled the Liquidity has been Sweaped now we wait for the candlestick Mitigation and our Entry

today a good buy limit in GBPUSDWe have the macro trend is bullish and in the daily and weekly it has given me a signal to go shopping today, today for me is just looking for buys

💡 GBPUSD: A reversal pattern appearsGBPUSD sustained a downward trend in its recent session, although the decline was moderated by a recovery towards the session's end. A notable development is the emergence of a bullish pin bar pattern on the daily chart, indicating a weakening of selling pressure. This suggests a potential conclusion to the correction phase and a likelihood of the price resuming its upward momentum, aligning with signals of reversal observed in the preceding session.

GBPUSD: Mixed US stock index futures, FTSE 100 static ahead of in Thursday, November 9, 2023, the FTSE 100 was flat and US stock index futures were mixed in the financial markets. The UK's third quarter GDP data is about to be released, and this will likely have an impact on the Bank of England's (BoE) December monetary policy. Swati Dhingra is thinking about lowering interest rates in the event that growth statistics fall short.
The third quarter of UK economic growth was hindered by a number of issues, including declining consumer spending, weak PMIs for services, a lagging market for housing, and declining employment. Despite declining US Treasury yields, this circumstance has caused the GBP/USD pair to stabilize near 1.2300 following three days of negative closing.
The same day, prospective USD influencers came into focus for the market. Among them is the US Department

GPBUSD - Potential pullback ✅Hello traders!
‼️ This is my perspective on GBPUSD.
Technical analysis: As we can see here price filled the imbalance and now is in a bearish order block, I expect we could see rejection from it + institutional big figure 1.24000. This could be a potential pullback to fill the imbalances lower.
Fundamental news: This week on Friday will be released monthly GDP on GBP. If the result is negative for GBP, it will support our analysis.
Like, comment and subscribe to be in touch with my content!

Buying opportunity for a weekly target in GBPUSDIt seems that the pound will rise in the coming days and we will see a short growth.
In the relevant chart, I considered a series of support areas where we can see the reaction of candles to those areas.
If you agree with my opinion, please support me

Selling the rallies in GBP/USD as long as the resistance holdsHello traders, as per my previous trading plan on GBPUSD, our
sell entry at the 1.2410 zone gave us over 170 pips profit as
GBP/USD fell to 1.2240 levels.
Currently, the price is not in an area where we can execute new
sells. So, my plan is to wait for a pullback and see if the price reaches
the resistance level near 1.24.
If the resistance zone holds, we can consider selling GBP/USD again
at 1.24 with 1.2200 as the target.

GBPUSD possible buy area!GBPUSD experienced a continuous downtrend in its latest session, but the descent was tempered by a rebound towards the session's close. An interesting observation is the appearance of a bullish pin bar pattern on the daily chart, signaling a reduction in selling pressure. This implies a possible end to the correction phase and an increased probability of the price returning to its upward trajectory, in line with reversal signals seen in the previous session.

💡GBPUSD: Wait around the support levelThe GBPUSD is getting closer to the 1.2290 support zone. However, it appears that the market is slowing down in this region, and there haven't been any notable price action reactions or buy signals so far.
We'll have to remain patient at this point. If a buy signal does materialize in this area, we can consider entering a trade.
Additionally, it's advisable to keep an eye on the support level around 1.2230, which is also a viable trading zone. The price may gravitate toward this area, as it aligns with the previous peak region. If a buy signal forms here, it's another opportunity worth considering for a trade.


GBPUSD day trading hello dear trader
there are 2 buy setup position for gbpusd on 15 min time farame
gbp ready for next move
stop loss need for any position
good luck

eurusd for long A eurusd scalp seeing that the price has reacted to us in an important area and gives us confirmation with the price action in small periods

GBPUSDGBPUSD was trading in descending parallel channel and recently it seems like the sellers are bit exhausted now and bulls took the charge and now has given the breakout from descending channel.
Currently the price is forming a local support around 1.225 region.
Will the bulls take charge again continue for leg higher?
What you guys think of this idea?

GBPUSD 4H (STILL BEARISH)Trading in the pound sterling pair against the dollar stabilizes below the level of 1.2229 , so that the bearish trend scenario remains valid and effective for today, remembering that our expected targets start at 1.2175 and extend to 1.2137 .
The Stochastic indicator presents negative signals that we expect will contribute to pushing the price to achieve the proposed targets, which will remain in place provided it remains below the 1.2229level.
Pivot Price: 1.2229
Resistance prices: 1.2282 & 1.2335 & 1.2377
Support prices: 1.2175 & 1.2137 & 1.21117
The general trend expected for today: bearish
timeframe:4H


GBPUSD LONGGBPUSD still bullish targets are still intact. first TP stands at 1.26
Correction after a strong bullish breakout

GBPUSD ANALYSIS (LONG)Here gpbusd has reached to level of 23000 level and want to make a pull back . So it now form double button on 15mins showing a buy which means going long is needed
