GBP/USD - Triangle Breakout (16.05.2025)The GBP/USD pair on the M30 timeframe presents a Potential Buying Opportunity due to a recent Formation of a Triangle Breakout Pattern. This suggests a shift in momentum towards the upside and a higher likelihood of further advances in the coming hours.
Possible Long Trade:
Entry: Consider Entering A Long Position around Trendline Of The Pattern.
Target Levels:
1st Resistance – 1.3389
2nd Resistance – 1.3441
🎁 Please hit the like button and
🎁 Leave a comment to support for My Post !
Your likes and comments are incredibly motivating and will encourage me to share more analysis with you.
Best Regards, KABHI_TA_TRADING
Thank you.
Gbpusdlong

GBPUSD pullbackOANDA:GBPUSD
As shown in our pinned analysis, this level was previously considered for a short trade. But after being broken, according to our plan, it has now turned into a buy zone.
We are ready to enter a long position,
but if the price drops below and holds, this level will lose its validity and the analysis will be invalid.
Follow us for more trades analysis!
For detailed entry points, trade management, and high-probability setups, follow the channel:
ForexCSP

Cup & Handle - Bullish Continuation PatternFX:GBPUSD continues its bullish trend, printing higher highs and higher lows. Currently price has formed a Cup & Handle pattern signalling potential bullish continuation!
Following the analysis, buys should only be triggered once neckline / resistance has been broken!

GBP/USD Short Trade Setup – Targeting 1.31580 from 1.34281Entry Point: 1.34281
Stop Loss: 1.34554 (about 27 pips above entry)
Target Points:
Target One: 1.32698
Final Target (EA Target Point): 1.31580 (approx. 270 pips from entry)
Risk/Reward Ratio: Favorable, given the tight stop and wider target.
📈 Chart Features
Highlighted Zones:
Resistance Zone (top purple area): A strong supply zone, where price reversed multiple times.
Support Zone (bottom purple area): Historical demand zone, previous price reactions.
Orange Circles: Represent key swing highs and lows (likely used to confirm the zones or a double/triple top/bottom pattern).
Moving Averages:
Red Line: Likely a shorter-period MA (e.g., 20 EMA).
Blue Line: Likely a longer-period MA (e.g., 50 or 200 EMA), often used for trend confirmation.
🧠 Interpretation
Price Action: The chart suggests the price recently hit a resistance zone and is expected to reverse.
Trade Bias: Bearish – expecting the market to drop from the resistance.
Indicators Support:
Price has rejected multiple times at the top.
Entry is slightly below resistance, confirming a potential reversal.
Targets align with support and past consolidation zones.

GBPUSD: Bullish Order FlowFollowing a decisive move away from the 1.32500 level, GBP/USD has gained bullish traction. This price action has left an unmitigated order block in its wake, which may act as a key area of interest for buyers and could support the continuation of the current upward trend.

#GBPUSD: Risk Entry Vs Safe Entry, Which One Would You Chose? The GBPUSD currency pair presents two promising opportunities for entry, potentially generating gains exceeding 500 pips. However, entering these markets carries a substantial risk of stop-loss hunting during the commencement of the week. Conversely, adopting a safe entry strategy offers a favourable chance for a bullish position.
We encourage you to share your thoughts and feedback on our ideas. ❤️🚀
Team Setupsfx_

GBP/USD Bullish Playbook – Multi-Timeframe Strategy (May 2025)GBP/USD is in a clear daily uptrend, with price respecting an ascending channel since December 2024. A recent pullback to the 1.3200–1.3250 support zone set the stage for a bounce, aligning with a 1-hour double bottom and a 15-minute bull flag forming around 1.3300–1.3360.
Key short-term levels:
Support: 1.3300–1.3310 (H1 neckline & intraday trendline).
Resistance: 1.3360–1.3370 (flag high and daily breakout zone).
Trading plan:
Buy dips near 1.3300 with stops under 1.3285.
Target: 1.3360, then 1.3400–1.3450.
Breakout trade: Long above 1.3370 if momentum holds.
Fade scenario: Short 1.3360 rejections back to 1.3320.
All three timeframes support a bullish bias into higher highs, with clean setups and tight stops. This plan favors high-RR trades in a tight range with breakout potential.

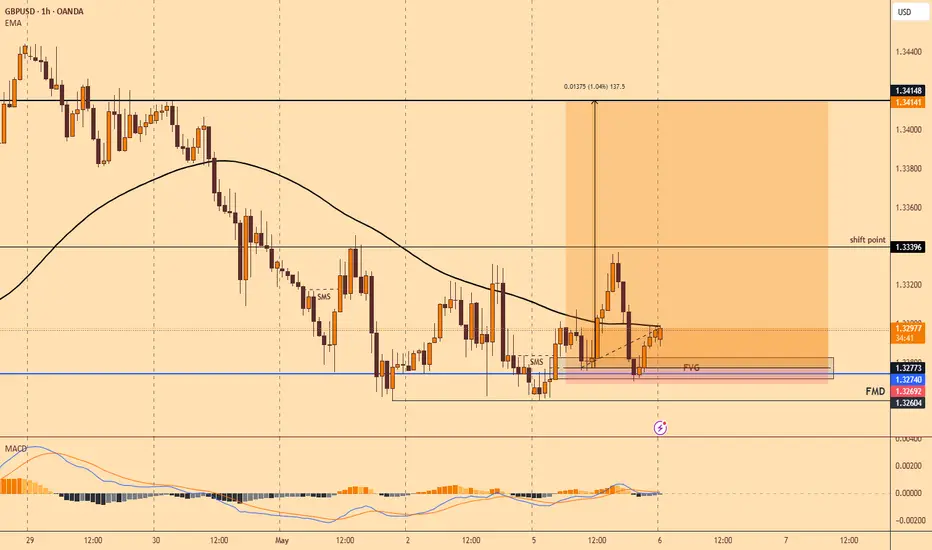
GBPUSD Setup 14.05.2025GBPUSD – Long Setup Pending (May 14, 2025)
Price is approaching a 30m Fair Value Gap (FVG) created after a strong impulsive move. If price taps into the FVG zone at 1.33270–1.33160 and shows a bullish reaction (engulfing or strong rejection wick), it presents a high-probability long setup.
Entry: On bullish confirmation inside FVG (1.33270–1.33160)
Stop Loss: 1.33118 (below FVG)
Target: 1.33760
RR: ~1:3
Wait for clear bullish price action before entering. No entry if FVG fails or price drops through without reaction.
Support, follow, like and comment.

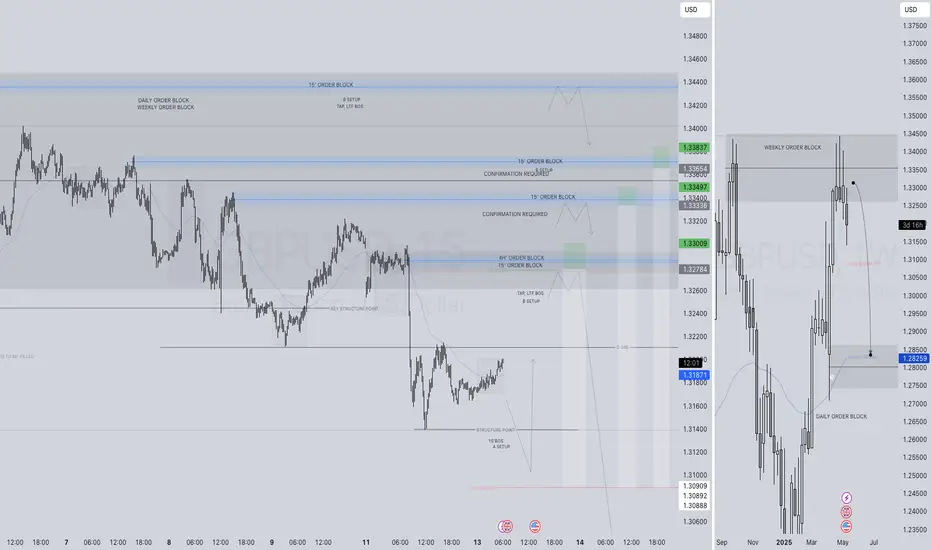
GBPUSD SHORT FORECAST Q2 W20 D14 Y25GBPUSD SHORT FORECAST Q2 W20 D14 Y25
Professional Risk Managers👋
Welcome back to another FRGNT chart update📈
Diving into some Forex setups using predominantly higher time frame order blocks alongside confirmation breaks of structure.
Let’s see what price action is telling us today!
💡Here are some trade confluences📝
✅Weekly order block rejection
✅Daily order block rejection
✅Intraday 15' order blocks
✅Tokyo ranges to be filled
🔑 Remember, to participate in trading comes always with a degree of risk, therefore as professional risk managers it remains vital that we stick to our risk management plan as well as our trading strategies.
📈The rest, we leave to the balance of probabilities.
💡Fail to plan. Plan to fail.
🏆It has always been that simple.
❤️Good luck with your trading journey, I shall see you at the very top.
🎯Trade consistent, FRGNT X

GBPUSDHello traders.
Today's first signal comes from GBPUSD. To be honest, I don’t feel entirely confident about this trade — but I’m still taking it, trusting my system and strategy.
🔍 Criteria:
✔️ Timeframe: 15M
✔️ Risk-to-Reward Ratio: 1:1.50
✔️ Trade Direction: Buy
✔️ Entry Price: 1.32022
✔️ Take Profit: 1.32320
✔️ Stop Loss: 1.31824
🔔 Disclaimer: This is not financial advice. It's a trade I’m taking based on my own system, shared purely for educational purposes.
📌 If you're also interested in systematic and data-driven trading strategies:
💡 Don’t forget to follow the page and subscribe to stay updated on future analyses.

GBPUSD SHORT FORECAST Q2 W20 D13 Y25GBPUSD SHORT FORECAST Q2 W20 D13 Y25
Professional Risk Managers👋
Welcome back to another FRGNT chart update📈
Diving into some Forex setups using predominantly higher time frame order blocks alongside confirmation breaks of structure.
Let’s see what price action is telling us today!
💡Here are some trade confluences📝
✅Weekly order block rejection
✅Daily order block rejection
✅Intraday 15' order blocks
✅Tokyo ranges to be filled
🔑 Remember, to participate in trading comes always with a degree of risk, therefore as professional risk managers it remains vital that we stick to our risk management plan as well as our trading strategies.
📈The rest, we leave to the balance of probabilities.
💡Fail to plan. Plan to fail.
🏆It has always been that simple.
❤️Good luck with your trading journey, I shall see you at the very top.
🎯Trade consistent, FRGNT X
GBPUSD SHORT FORECAST Q2 W19 D9 Y25GBPUSD SHORT FORECAST Q2 W19 D9 Y25
Professional Risk Managers👋
Welcome back to another FRGNT chart update📈
Diving into some Forex setups using predominantly higher time frame order blocks alongside confirmation breaks of structure.
Let’s see what price action is telling us today!
💡Here are some trade confluences📝
✅Weekly order block rejection
✅Daily order block rejection
✅Intraday 15' order blocks
✅Tokyo ranges to be filled
🔑 Remember, to participate in trading comes always with a degree of risk, therefore as professional risk managers it remains vital that we stick to our risk management plan as well as our trading strategies.
📈The rest, we leave to the balance of probabilities.
💡Fail to plan. Plan to fail.
🏆It has always been that simple.
❤️Good luck with your trading journey, I shall see you at the very top.
🎯Trade consistent, FRGNT X

GBP/USD is setting the stage for a deep correction — Don’t chaseA Smart Money trap is unfolding as price enters a major supply zone. Prepare for a sharp move.
GBP/USD is now testing a critical supply zone near 1.3300–1.3500, where institutional sellers are likely to activate.
According to Smart Money Concept (SMC) and Market Structure, we are anticipating a liquidity grab followed by a deep corrective move towards the 1.2500–1.2300 demand zone.
Key Insights:
– Major Supply Zone: 1.3300–1.3500 is the key area for potential reversals
– Expected Move: Short-term bullish exhaustion → Strong sell-off towards 1.2500
– Mid-Term Outlook: After the correction, bullish continuation possible but only from lower demand zones
– Strategy: Wait for bearish confirmation at supply zone before selling | Look for buying opportunities closer to 1.2300 if structure shifts bullish
Smart traders wait for clean entries

GBPUSD SHORT FORECAST Q2 W19 D8 Y25GBPUSD SHORT FORECAST Q2 W19 D8 Y25
Professional Risk Managers👋
Welcome back to another FRGNT chart update📈
Diving into some Forex setups using predominantly higher time frame order blocks alongside confirmation breaks of structure.
Let’s see what price action is telling us today!
💡Here are some trade confluences📝
✅Weekly order block rejection
✅Daily order block rejection
✅Intraday 15' order blocks
✅Tokyo ranges to be filled
🔑 Remember, to participate in trading comes always with a degree of risk, therefore as professional risk managers it remains vital that we stick to our risk management plan as well as our trading strategies.
📈The rest, we leave to the balance of probabilities.
💡Fail to plan. Plan to fail.
🏆It has always been that simple.
❤️Good luck with your trading journey, I shall see you at the very top.
🎯Trade consistent, FRGNT X

GBPUSD BIG MOVE COMING?Structure Overview:
The market has been ranging within a clear horizontal consolidation zone, with two key zones:
Support Zone: 1.32600 - 1.33000 (gray box at the bottom)
Resistance Zone : 1.33500 - 1.33800 (gray box at the top)
Price recently broke above the upper consolidation range, suggesting bullish momentum.
🔍 Analysis:
The pair has broken out of the consolidation range after multiple rejections from the support zone.
We now look for a potential retest of the previous resistance (1.33500 area) as new support.
Two potential bullish continuation scenarios are highlighted:
📌 Trade Plan:
Scenario 1 – Immediate Continuation:
If price holds above 1.33500, look for bullish continuation toward:
TP1: 1.34026
TP2: 1.34208
Scenario 2 – Retest Setup:
Wait for a pullback to the 1.33000–1.33500 zone.
Confirmation of bullish rejection (e.g., bullish engulfing or pin bar) could provide a high-probability long setup.
Entry: After bullish confirmation in retest zone
SL: Below 1.33000 (invalidates breakout)
TP: 1.34026 / 1.34208
📉 Invalidations:
A clean break and close below 1.33000 may suggest a failed breakout, putting 1.32600 back into play.
🧠 Bias: Bullish (as long as 1.33000 holds)
🕒 Timeframe: 4H

Bullish ScenarioH4 is bullish and on the m15 TF it made a shift is structure then a pullback to a FVG now we are expecting a rise in price up.
GBP/USD Short Trade Setup: Reversal from 1.34370 with Target at Entry Point:
Marked at 1.34370, where the analyst anticipates a reversal or price rejection.
Stop Loss:
Positioned above at 1.34975, covering a 2.62% risk margin. This is a protective level in case the price moves against the trade.
Target (Take Profit):
Set at 1.31015, just above a strong support zone around 1.30818. This is where the analyst expects the price to eventually fall.
Resistance Point:
Noted around 1.33007 – 1.32859, acting as an intermediate level of interest and possible price reaction zone.

GBPUSD The second trade of the day comes from the GBPUSD pair.
Even though I'm not a big fan of this pair, I believe it's worth taking advantage of the signal.
However, for this pair, I recommend slightly reducing your lot size and overall risk.
🔍 Criteria:
✔️ Timeframe: 15M
✔️ Risk-to-Reward Ratio: 1:3
✔️ Trade Direction: Buy
✔️ Entry Price: 1.32793
✔️ Take Profit: 1.33054
✔️ Stop Loss: 1.32706
🔔 Disclaimer: This is not financial advice. It's a trade I’m taking based on my own system, shared purely for educational purposes.
📌 If you're also interested in systematic and data-driven trading strategies:
💡 Don’t forget to follow the page and subscribe to stay updated on future analyses.

GBPUSD is in the Selling DirectionHello Traders
In This Chart GBPUSD HOURLY Forex Forecast By FOREX PLANET
today GBPUSD analysis 👆
🟢This Chart includes_ (GBPUSD market update)
🟢What is The Next Opportunity on GBPUSD Market
🟢how to Enter to the Valid Entry With Assurance Profit
This CHART is For Trader's that Want to Improve Their Technical Analysis Skills and Their Trading By Understanding How To Analyze The Market Using Multiple Timeframes and Understanding The Bigger Picture on the Charts

GBP/USD Trend JudgmentTechnical Analysis of GBPUSD 4 - hour Chart
Support Level Analysis
Several key support levels are clearly marked in the chart. 1.32000 is a strong support level. If the price drops to this level, it may bounce back due to the buying support formed by past intensive trading 📈. 1.32400 is near the current price and also plays a certain supporting role. The price fluctuating around this level reflects the tug - of - war between bulls and bears here 🤼. 1.30200 is an important support level further down. Once the price breaks below 1.32000, it may further test this level 📉.
Target Level Analysis
The target area is around 1.34200. Judging from the chart trend, the price previously had upward - fluctuating momentum 💹. If the current price can break through the short - term downward trend and is accompanied by trading volume, and the bullish force continues to strengthen, the price is expected to move upward towards the 1.34200 target area 🚀. This target area is derived from the high points of previous price fluctuations and trend lines. It has certain resistance, but once broken, it can open up the upper space 🚪.
Trend Judgment
Currently, the price is in a relatively volatile downward trend, but the lower support levels may change the price trend. If the price obtains effective support at the support levels and forms a reversal signal (such as a bullish engulfing pattern, etc.) 📊, an upward trend is expected to start. Investors can pay attention to the performance of the price at the support levels. If the support is effective, they can try to go long, with the stop - loss set below the support level; if the price breaks below the support level, they can consider going short, with the target looking towards the lower support level 📌.
⚡⚡⚡ GBPUSD ⚡⚡⚡
🚀 Buy@1.32000 - 1.32400
🚀 TP 1.33500 - 1.34000
Accurate signals are updated every day 📈 If you encounter any problems during trading, these signals can serve as your reliable guide 🧭 Feel free to refer to them! I sincerely hope they'll be of great help to you 🌟 👇

GBP/USD Buy from 2hr demand zone?This week, my analysis for GU focuses on a potential buy opportunity from the 2H demand zone. Although this zone is still quite a distance from current price action, I’m patiently waiting to see which side of liquidity gets taken first — that will help highlight a more immediate area of interest.
Given the recent bearish movement, I’m anticipating a possible break of structure to the downside, targeting the underlying Asia lows. This move could create a new supply zone, which may present a more valid setup in the short term.
However, if price maintains its current trajectory, I’m also eyeing the 13H supply zone, which would offer a strong POI for future sell opportunities after a bullish correction.
Confluences for GU Buys:
- Price is approaching a 2H demand zone.
- Market has been bearish, suggesting a correction may be due.
- DXY analysis aligns with a potential GU recovery.
- Liquidity buildup points toward a possible retracement to the 13H supply zone.
P.S. If the week starts with a bullish move, that could offer a better setup for shorts later on as price approaches the higher supply zone. Stay alert and flexible with your setups — wishing everyone a strong and disciplined trading week!

GBPUSD long to last day's highGBPUSD is showing signs of reversal. The bias for me for today is bullish. It experienced a retracement to the current level and is now showing bullish candles and rejections from the liquidity area. I am targeting yesterday's highs but it could go way higher than that with NFP.
Leave your thoughts in the comments.

