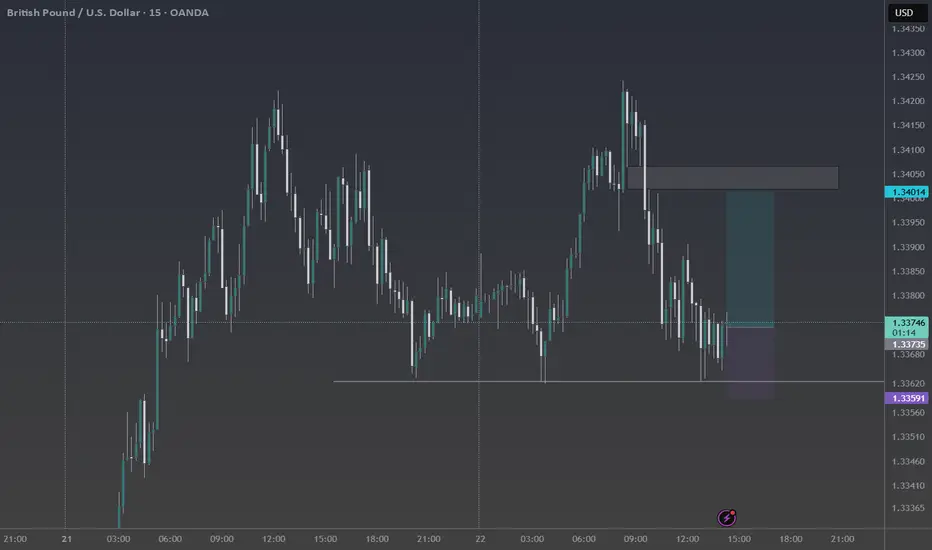
Short term long play in GBPUSDGBPUSD is at a 50% fib level and is showing wicks to the downside. There isn't much liquidity in the market today but looks like there might be a short term long opportunity.
I'd use half risk since we are technically in a downtrend retracement currently.
Gbpusdlong

GBP/USD Opening Trends and Trading Strategies Next WeekTrend Analysis
Examining the 4 - hour chart of GBP/USD, the pair is distinctly navigating an upward trend. A series of successive higher highs and higher lows have been established, serving as a robust testament to the dominant strength of the bulls 🐂. This upward momentum indicates that the bulls are firmly in the driver's seat, consistently pushing the price higher and maintaining control over the market sentiment.
Key Levels
Support Area
The 1.3200 - 1.3240 range emerges as a crucial support zone on the chart. Historical price action reveals multiple instances where the price has found strong support in this area, bouncing back with resilience each time it approached. This repeated pattern underscores the presence of substantial buying pressure, as market participants actively step in to defend this price level. Should the price retrace towards this support zone again, it could potentially present a lucrative opportunity for traders to initiate long positions 💰.
Target Area
The 1.3420 mark has been identified as a significant target level. In the event that the price successfully breaks free from its current consolidation phase and continues its upward trajectory, there is a strong expectation that it will advance towards this target price. This level represents a potential milestone for the bullish rally, and reaching it would further validate the strength of the upward trend 🎯.
Trading Strategy
Long - position Strategy
For traders looking to capitalize on the bullish trend, a well - timed entry point could present itself when the price retraces to the 1.3200 - 1.3240 support area. Once there, the appearance of a bullish candlestick pattern, such as a hammer or an engulfing pattern, can serve as a signal to consider entering a long position. To manage risk effectively, it is advisable to set the stop - loss just below the support area, protecting against any unexpected downward movements. With the 1.3420 target area in sight, traders can aim for a profitable trade as the price moves in the anticipated upward direction 📈.
⚡⚡⚡ GBPUSD ⚡⚡⚡
🚀 Buy@1.32000 - 1.32400
🚀 TP 1.33500 - 1.34000
Accurate signals are updated every day 📈 If you encounter any problems during trading, these signals can serve as your reliable guide 🧭 Feel free to refer to them! I sincerely hope they'll be of great help to you 🌟

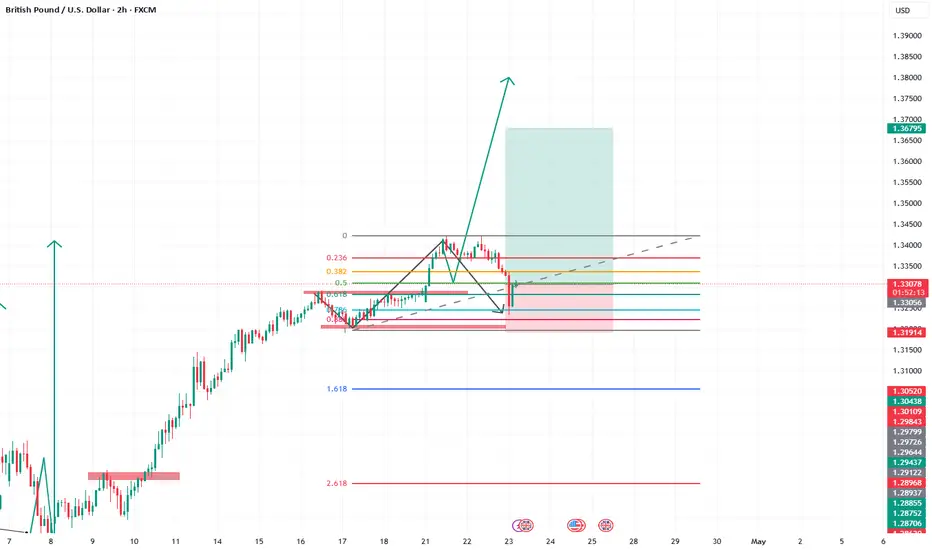
GBPUSD Sell and Buy Trading PlanH4 - We have a clean bullish trend with the price creating a series of higher highs, higher lows structure
This strong bullish move ended with a bearish divergence
While measuring this strong bullish move using the Fibonacci retracement tool we have two key support zones that has formed (marked in green)
So based on this I expect short term bearish moves now towards the Fibonacci support zones and then continuation higher.
If you enjoy this idea, don’t forget to LIKE 👍, FOLLOW ✅, SHARE 🙌, and COMMENT ✍! Drop your thoughts and charts below to keep the discussion going. Your support helps keep this content free and reach more people! 🚀
--------------------------------------------------------------------------------------------------------------------
Disclosure: I am part of Trade Nation's Influencer program and receive a monthly fee for using their TradingView charts in my analysis.

GBPUSD: Eyeing a Bullish Structure Shift - A Wyckoffian ApproachGBPUSD 🚦 Technical Analysis & Trade Plan
📊 Current Market Structure
The GBPUSD 4-hour chart is currently consolidating just below a set of equal highs, indicating a potential liquidity pool above. Price action has shown a series of higher lows, suggesting underlying bullish pressure. The market is in a range, with buyers and sellers in equilibrium, but the clustering of highs signals a likely stop-hunt or breakout scenario.
🧠 Wyckoff Perspective
From a Wyckoff standpoint, the market appears to be in the late stages of accumulation. The equal highs represent a classic “creek” or resistance, where smart money may engineer a breakout to trigger stops and induce breakout traders. A successful breakout, followed by a retrace to retest the broken highs (now support), and a subsequent bullish structure break, would confirm the presence of strong demand and the start of a mark-up phase.
🌍 Fundamental Backdrop
Fundamentally, GBP has been supported by resilient UK economic data and a slightly hawkish tone from the Bank of England, while the USD faces headwinds from softer inflation prints and dovish Fed rhetoric. However, geopolitical risks and global risk sentiment remain key drivers, so any sudden shifts could impact the pair.
📰 Current Sentiment
Market sentiment is cautiously optimistic for GBPUSD. CFTC positioning shows a reduction in net GBP shorts, and recent price action reflects a willingness to buy dips. However, the presence of equal highs suggests that many traders are watching for a breakout, increasing the likelihood of a stop-run before a genuine move higher.
🏦 Trade Idea
Entry: Buy on a confirmed break above the current equal highs (around 1.3340), wait for a retrace to retest the broken highs, and enter long on a bullish structure break (e.g., a higher low and bullish engulfing candle).
Stop Loss: Place stops below the retracement low (e.g., below 1.3300).
Take Profit: Target the next significant resistance zone (e.g., 1.3400–1.3450), scaling out as price approaches these levels.
Risk Management: Risk no more than 1–2% of your trading capital on this setup.
⚠️ Disclaimer
Trading forex involves significant risk and may not be suitable for all investors. The analysis and trade idea provided are for educational purposes only and do not constitute financial advice. Always conduct your own research and consult with a licensed financial advisor before making trading decisions.

GBPUSD- it's breakout? What's next??#GBPUSD... market broke his ultimate resistance and trade above from last week.
So keep close specially pound because if that is a clear breakout then we will go for a longest leg to upside.
Good luck
Trade wisley

GU Liquidity Game—Institutional Absorption vs. Breakout MomentumGBP/USD Hourly Analysis & Trade Execution
I’ve been closely tracking GBP/USD, and now price is sitting at 1.34208, testing the critical resistance zone at 1.34250. Bulls have maintained control, but I’m watching closely for institutional absorption or signs of exhaustion.
Market Structure & Key Zones
Major Resistance: 1.34250-1.34500 → If buyers hold, price could extend toward 1.34500.
Support at 1.33800-1.33950 → A possible demand zone if price pulls back before pushing higher.
Liquidity Trap Below 1.33650 → A quick dip below 1.33800, followed by aggressive buying, would indicate institutional positioning.
Momentum & Trend Confirmation
RSI (1-hour): 66.38 → Bullish, but nearing exhaustion territory.
Stochastic RSI (1-hour): 61.27 → Buyers are in control but watching for signs of slowing momentum.
Stochastic Fast (1-hour): 60.54 → Trend is intact, but reversal signals could emerge near resistance.
Trade Management Strategy
Setup: Bullish Breakout Continuation
Since price is testing 1.34250, I’ll hold my long position if buyers show sustained strength.
Entry: Holding long if price stabilizes above 1.34250.
Stop Loss: Adjusted to 1.33950 to lock in gains.
Target 1: 1.34500, strong resistance level.
Target 2: 1.34650, extended play if volume supports the breakout.
Setup: Liquidity Sweep & Reversal
If price rejects 1.34250, I’ll look for a pullback setup before re-entering long.
Entry: If price dips below 1.33800 but aggressively reclaims 1.34000, re-enter long.
Stop Loss: Below 1.33650, ensuring tight risk control.
Target 1: 1.34150, reclaiming previous resistance.
Target 2: 1.34350, profit zone if buyers remain strong.
Institutional Activity & Order Flow Considerations
Liquidity Sweeps Below 1.33850 → If price dips but quickly recovers, it could be a stop-hunt before continuation.
Absorption Near 1.34250 → If price holds steady here without sharp rejection, buyers may be absorbing sell-side liquidity.
Volume Confirmation at 1.34150 → If volume remains strong, further upside toward 1.34500 is likely.
Final Execution Adjustments
Monitoring order flow to assess whether institutions are accumulating or distributing positions near resistance.
Watching volume absorption and candle behavior near 1.34250.
Right now, GBP/USD is at a pivotal level—if buyers sustain above 1.34250, the trend continuation toward 1.34500-1.34650 is in play. However, failure to hold may signal institutional selling, triggering a pullback before another bullish attempt.

GBPUSD long to fill an imbalance from Market open on FridayThe market is in a consolidation right now.
It has yet to fill an imbalance that was created on last weeks Friday market open (visible on the lower timeframes). It wants to fill it. There is also a bigger imbalance from Tuesday above it.
This is my trade idea for today.
Leave your thoughts in the comments.

Analysis of GBPUSD 4 - hour ChartAnalysis of GBPUSD 4H Chart
Trend Analysis
From the 4 - hour chart, GBPUSD is generally in an uptrend. The price fluctuations have formed a series of higher highs and higher lows, indicating that the bulls are in control 🐂.
Key Levels
Support Area: The range of 1.3200 - 1.3240 is clearly marked as an important support area in the chart. Previously, the price has rebounded near this area multiple times, suggesting that there is strong buying pressure in this area. If the price retraces to this area again, it may present a potential opportunity to go long 💰.
Target Area: 1.3420 is marked as the target area. If the price breaks through the current consolidation range and continues its upward trend, it is expected to move towards this target price level 🎯.
Trading Strategy
Long - position Strategy: When the price retraces to the 1.3200 - 1.3240 support area and a bullish candlestick pattern appears, one may consider entering a long position. Set the stop - loss just below the support area, and target the 1.3420 target area 📈.
⚡⚡⚡ GBPUSD ⚡⚡⚡
🚀 Buy@1.32000 - 1.32400
🚀 TP 1.33500 - 1.34000
Accurate signals are updated every day 📈 If you encounter any problems during trading, these signals can serve as your reliable guide 🧭 Feel free to refer to them! I sincerely hope they'll be of great help to you 🌟

GBPUSD to touch yesterday's highThe short term retracement is getting weaker, signaling a push to the upside soon. The first target would be last day's high around the 1.3332 area.
Price failed to break the last short term low.

As the dollar's weak trend signals an endTrump's remarks and attitudes in trade negotiations have had a significant impact on the market 📈💥
His change in attitude towards the Federal Reserve Chairman first triggered investors' concerns about the Fed's policy, leading them to seek refuge in gold and causing the price of gold to rise 🏆🚀. Later, his remarks alleviated those concerns, prompting funds to flow back into dollar-denominated assets and causing the price of gold to decline from its peak levels 📉💔
In terms of trade negotiations, potential easing measures may reduce the demand for gold as a safe-haven asset ⏳
Taken together, these factors may imply that market confidence in the dollar has been somewhat restored 🌟. When signs of the end of the dollar's weak trend emerge 📊, more funds flow into dollar assets 💸. Against the backdrop of this change in the direction of capital flows, the GBPUSD has declined 😔
⚡⚡⚡ GBPUSD ⚡⚡⚡
🚀 Sell@1.32800 - 1.32600
🚀 TP 1.32200 - 1.32000
The market has been extremely volatile lately 📈📉 If you can't figure out the market's direction, you'll only be a cash dispenser for others 💰

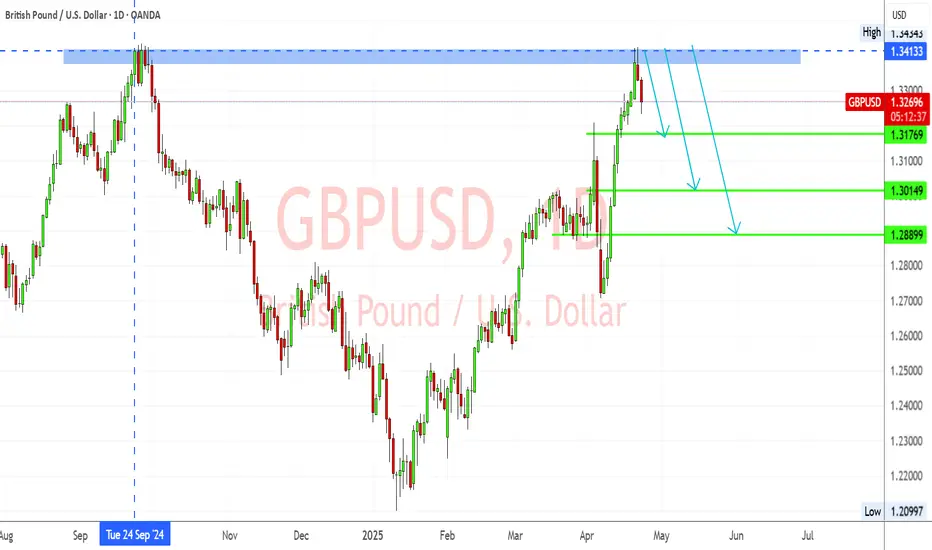
GBPUSD – Rejected at Multi-Month Resistance Amid Weak UK DataGBPUSD has clearly rejected the 1.3413–1.3443 resistance zone—a key area that previously acted as strong supply in September 2024. The pair has formed a bearish rejection candle and is now showing signs of downward momentum.
Key Levels:
Resistance: 1.3413 – 1.3443 (major rejection zone)
TP1: 1.3176 (minor structure)
TP2: 1.3014 (key demand zone)
TP3: 1.2890 (deeper support target)
Bearish Confluences:
Price rejected from major resistance
Bearish candle formation
Previous similar reaction from the same level
Momentum indicators favor downside
📰 Fundamental Analysis:
🔻 UK Data Weakens Further:
According to the latest S&P Global Flash UK PMI (Apr 23):
Composite Output Index: 48.2 (vs 51.5 in March) – 29-month low
Services PMI: 48.9 – 27-month low
Manufacturing PMI: 44.0 – 20-month low
This shows UK private sector activity contracting, led by a steep fall in new export orders, the worst since May 2020.
🔺 Inflation Still High:
Despite falling activity, input and output prices surged, driven by National Insurance hikes and wage growth. This makes it harder for the BoE to justify a cut, despite recession signs.
📌 Conclusion:
The bearish rejection at 1.3413 resistance, combined with deteriorating UK fundamentals, suggests a strong downside setup for GBPUSD. A break below 1.3176 would confirm the bearish move, targeting 1.3014 and potentially 1.2890.
GBPUSD needs to fill an imbalance at the upsideGBPUSD has had it's short term retracement after a rally to the upside. It is now looking like a reversal back bullish at least to the last unfilled imbalance at the 1.3365 area. It may also break though it and continue to go up due to the dollar weakening.

GBPUSD LONG/BUYBy utilizing Fibonacci retracement levels, historical patterns, , we can formulate a hypothesis that the market might follow a similar trajectory if bullish sentiment prevails.
GBPUSD long before a short term bearish retracementBased on my technical analysis, it looks like GBPUSD wants to fill a small imbalance at the 1.34010 range before making a bigger retracement down. We also have a triple bottom forming at 1.3362 area which supports a move to the upside.
GBP/USD Ready for Takeoff!Hi Traders ! Price action remains strong within the uptrend channel, supported by the 20 EMA, while the 200 EMA stays well below—confirming bullish momentum.
Target zone: 1.34234
RSI shows strength with more room to rise.
Stay sharp, traders! If the price continues to respect the channel, we might see a strong bullish push soon.
📌 Disclaimer:
This content is for educational and informational purposes only and does not constitute financial advice. Always do your own analysis and consult with a professional before making trading decisions.

GBPUSD ANALYSISAfter seeing the week continue the bullish move from last week without any gaps, we could expect the pair to continue to the upside into 1.3500

GBPUSD LONG/SWING UPDATESHello folks, its been a long time no post.
Here is my Long/swing trades for Swing traders. This idea base on weekly and monthly.
Buyside liquidity over 1.42600 this is my highest Swing. wait for a retracements we might test this high or break. wait always below.
This is only my view. this is not a financial advice.
lets swing it.
Follow for more.

GBPUSD - bottom out pattern going on? What's next??#GBPUSD - perfect move as per our last couple of ideas regarding #GBPUSD
and now in current situation we have 1.3220 as immediate supporting and below that 1.3140
If market holds that supporting areas then we can expect further bounce towards 1.3500 and after that 1.3700 , 1.3900 n upto 1.4200
So stay sharp and don't be lazy here..
Good luck
Trade wisley

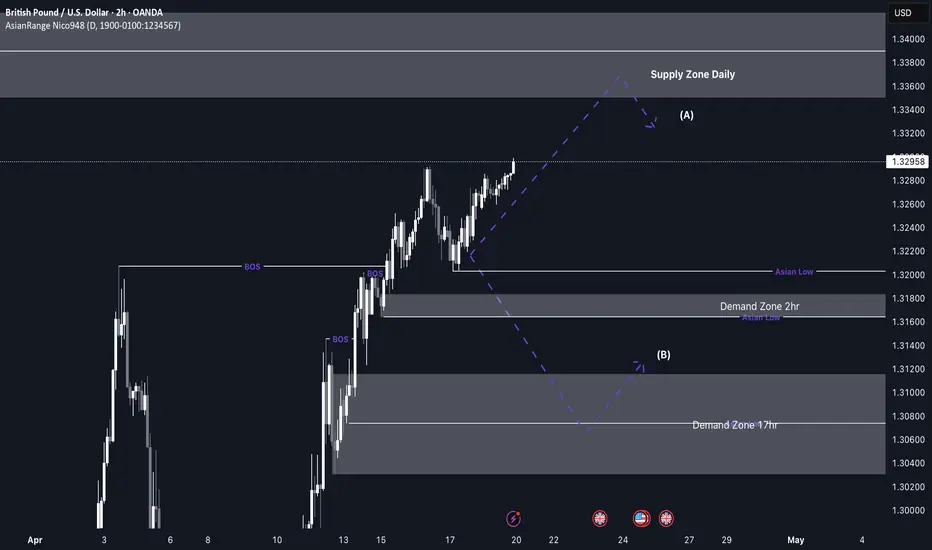
GBP/USD upcoming shorts from 1.33600 back down to demandMy focus this week for GU is around a key daily supply zone that price is currently approaching. As we near this level, I expect price to slow down and begin distributing, potentially leading to a deeper retracement. I anticipate the short setup to form around Tuesday, depending on how price reacts.
If price does retrace, I’ll be watching the 2-hour and 17-hour demand zones, where we could see a bullish reaction and a potential rally from those levels. Since GU has been overall bullish, this would be a counter-trend short, followed by a possible continuation to the upside.
Confluences for GBP/USD Shorts:
- Price is overbought, indicating a potential correction to clear liquidity and fill imbalances.
- Plenty of downside liquidity and imbalances that price could target.
- Approaching a strong daily supply zone, which could act as a key reversal point.
- Unmitigated demand zones below, which may need to be tapped before price continues higher.
P.S. If price doesn’t reach the daily supply zone, I’ll remain patient and look for a buy opportunity to ride price up toward that supply level.
Wishing everyone a great trading week ahead!
#GBPUSD: Two Prominent Buying Points! Will Dxy Bounce Back? Due to strong economic data supporting GBP, its price has been bullish throughout the week, especially since DXY plunged. Given ongoing trade tensions, we may see another higher high. This is risky, so please analyse it yourself.
Like and comment to support us in bringing more analysis.
Have a great weekend! ❤️
Team Setupsfx_

GBPUSD(20250418)Today's AnalysisMarket news:
The European Central Bank cut interest rates by 25 basis points as expected, the seventh rate cut in the past year, and this decision was unanimous.
Technical analysis:
Today's buying and selling boundaries:
1.3246
Support and resistance levels:
1.3316
1.3290
1.3273
1.3219
1.3202
1.3176
Trading strategy:
If the price breaks through 1.3273, consider buying, the first target price is 1.3290
If the price breaks through 1.3246, consider selling, the first target price is 1.3219

GBPUSD:SIGNALHello friends
Given the good growth we had, we can buy within the specified support ranges with capital and risk management because buyers reacted well after the price correction and this could be the beginning of a good growth.
*Trade safely with us*

GBP/USD Fundamental Update (17.04.2025)The GBP/USD pair on the M30 timeframe presents a Potential Buying Opportunity due to a recent Formation of a Breakout Pattern. This suggests a shift in momentum towards the upside and a higher likelihood of further advances in the coming hours.
Possible Long Trade:
Entry: Consider Entering A Long Position around Trendline Of The Pattern.
Target Levels:
1st Resistance – 1.3320
2nd Resistance – 1.3369
🎁 Please hit the like button and
🎁 Leave a comment to support for My Post !
Your likes and comments are incredibly motivating and will encourage me to share more analysis with you.
Best Regards, KABHI_TA_TRADING
Thank you.
