GBPUSD 15MGBPUSD 15M. I see AMD and it's only my view.
Let's see how the market plays out and thank you.
Gbpusdsetup

GBPUSD Breakout TradeGBPUSD wait for breakout and trade in the direction of breakout.
Manage your risk according to account size!

GBPUSD BullishOn Thursday, DXY was become stronger and put GBPUSD down, but If you look on the chart, we can see huge Bearish candle which is abnormal as compared to another candle. I believe GBPUSD may rise more. Every support is an opportunity to buy.

GBP/USD Reversal Anticipation - Long BiasOutlook for GU for a long reversal. I still believe we will be expecting new highs soon, to the Monthly FVG and quite possibly to the NWOG above it.
I have some potential iFVGs that will be reused as support later on.
For lower prices, I am anticipating retracement into the Daily Breaker Block, or back into the NWOG. There is a 2 Week FVG and Daily Order Block further down which I don't think we will get to but it is not out of the realm of possibility.
My anticipation for higher prices is based on the liquidity residing above and the strong correlation in the COT reports.
Always look for confirmation.

GBPUSD, Expecting Long After ShortI am expecting GBPUSD a down move to meet the unmitted POI and then it will fly upside.

GBPUSD Analysis H1Here is my analysis for GBPUSD on H1 using Order Block. The price could go bearish, you can put a pending order on the Order block or find an entry on LTF within OB Zone. Trade Safe!

GBPUSD and GBPJPY Top-down analysis Hello traders, this is a complete multiple timeframe analysis of this pair. We see could find significant trading opportunities as per analysis upon price action confirmation we may take this trade. Smash the like button if you find value in this analysis and drop a comment if you have any questions or let me know which pair to cover in my next analysis.

GBPUSD Analysis H1Here is my analysis for GBPUSD on H1 using Order Block. The price could go bullish, you can put a pending order on the Order block or find an entry on LTF within OB Zone. Trade Safe!

FED's Decision, GBPUSD Pressure of bears still in controlI still believe for GBPUSD to fall back to its support to complete the trend after the climb in the morning. So i considered both the targets to be hit.
GBPUSD Analysis H4Here is my analysis for GBPUSD on H4 using Order Block. The price could go bearish, you can put a pending order on the Order block or find an entry on LTF within OB Zone. Trade Safe!

GU: Remains under pressure around the 1.28 mark ahead of FOMCThe GBPUSD pair is facing downward pressure and struggling to make gains during the Asian trading session on Tuesday. Currently, the major pair is trading around the 1.2840 level, showing a 0.1% increase for the day. Market sentiment is cautious as we approach the Federal Open Market Committee's (FOMC) meeting scheduled for Wednesday.
In July, US business activity experienced a slowdown, reaching a five-month low. The S&P Global Composite PMI dropped from 53.2 to 52. The US S&P Global Manufacturing PMI rose from 46.3 to 49, surpassing market expectations. However, the Services PMI decreased from 54.4 to 52.4, falling short of the anticipated 54. Additionally, the Composite PMI index fell to 52 from 53.2 in June.

EURUSD and GBPUSD Top-down analysisHello traders, this is a complete multiple timeframe analysis of this pair. We see could find significant trading opportunities as per analysis upon price action confirmation we may take this trade. Smash the like button if you find value in this analysis and drop a comment if you have any questions or let me know which pair to cover in my next analysis.

7 Dimension Analysis For GBPUSD😇7 Dimension Analysis
Analysis Time Frame: Daily
1: Price Structure:
The current price structure is bullish, with an initial behavior of a Bullish Order Block (BoS). The move is considered corrective, and the inducement has already taken place and is now considered valid and high. There have been 2 pullbacks, and the extreme order block remains unmitigated. The daily time frame shows a confluence area of demand.
2: Patterns:
🟢TREND LINES:
Trend lines are acting as support.
🟢CHART PATTERNS:
A CIP (Change in Polarity) pattern is observed, with this supply area acting as CIP.
A V-shape swing during the corrective move indicates a rapid impulsive recovery once the low is validated.
🟢CANDLE PATTERNS:
Shrinking candles, with the 3rd candle losing size compared to the previous ones.
A doji classic pattern, with the last candle closing as a doji.
A record session count of 6 consecutive bearish candles, but the low is not yet confirmed.
3: Volume:
Average volume observed.
4: Momentum RSI:
🟢The RSI is in a bullish zone.
🟢Currently in a bullish range shift.
5: Volatility Bollinger Bands:
🟢Middle band support and resistance levels are holding.
6: Strength ADX:
Bulls are slightly stronger than bears, with a kiss and cross pattern at the moment.
7: Sentiment ROC:
The rate of change is neutral, at 50/50.
✔️ Entry Time Frame: H1
✅ Entry TF Structure: Bearish
☑️ Entry Move: Impulsive
✔ Support Resistance Base: H1 Order Block rejection.
➕ FIB: Activated
↕️ Trend Line Breakout: Confirmed.
☑️ Final Comments: Sell for a corrective move.
💡 Decision: Sell
🚀 Entry: 1.2853
✋ Stop Loss: 1.2875
🎯 Take Profit: 1.2705
😊 Risk to Reward Ratio: 1:7
🕛 Expected Duration: 2 days
Summary: The price structure is bullish, but currently in a corrective move. The trend lines are acting as support, and a CIP pattern is observed. Bulls are slightly stronger than bears, and the RSI is in a bullish zone. Selling is suggested for a corrective move, with an entry at 1.2853, stop loss at 1.2875, and take profit at 1.2705, providing a risk to reward ratio of 1:7.

GBPUSD TRADING IDEA Hello Traders
In This Chart GBPUSD HOURLY Forex Forecast By FOREX PLANET
today GBPUSD analysis 👆
🟢This Chart includes_ (GBPUSD market update)
🟢What is The Next Opportunity on GBPUSD Market
🟢how to Enter to the Valid Entry With Assurance Profit
This CHART is For Trader's that Want to Improve Their Technical Analysis Skills and Their Trading By Understanding How To Analyze The Market Using Multiple Timeframes and Understanding The Bigger Picture on the Charts

EURUSD and GBPUSD Top-down Analysis Hello traders, this is a complete multiple timeframe analysis of this pair. We see could find significant trading opportunities as per analysis upon price action confirmation we may take this trade. Smash the like button if you find value in this analysis and drop a comment if you have any questions or let me know which pair to cover in my next analysis.

GBP will keep falling?GBPUSD if straightly falling from a week so here we are still sure it will keep its fall towards the targeted area. The Main reason of fall will be the FED interest rate to raise 0.25% next week.

GBPUSD: Bounces off over one-week low!In the Asian session on Friday, the GBP/USD pair is making a slight upward movement, distancing itself from the previous day's low of around 1.2840-1.2835. However, there isn't much momentum in spot prices and the market is currently trading near 1.2880, with a modest increase of just over 0.10% for the day.

GBPUSD: CPI today with profit?After a volatile day of trading on Monday, GBP/USD is struggling to break free from the 1.3100 level on Tuesday as investors are cautious about making big moves before important economic data is released.
Although GBP/USD experienced minor losses on Monday, the improved risk sentiment in the US session helped to minimize the losses. In the morning, the UK's FTSE 100 Index rose by 0.3%, while US stock indexes remained relatively stable, which enabled GBP/USD to maintain its position.

GBPUSD Analysis 19July2023Currently the price corrected from its bullish trend after touching fibo 1.618. if we pull the fibo retracement and we look for the SnD area which is adjacent to the fibo notation, we can find that there is a possibility that the price will go to the 0.382 fibo area which is also the same area as the SnD.

GBPUSD Breakout TradeGBPUSD moving in parallel channel waiting for breakout to trade.
Manage your risk according to account size!

GBP/USD Breakouts as UK Battles Inflation and Economic ChallengeRecent reports have indicated that the United Kingdom is facing its highest inflation levels in years, with various factors contributing to this uptrend. While this may raise concerns for some, as astute traders, we know that volatility often presents opportunities for substantial gains. The GBP/USD pair has become an enticing market to explore, reflecting the ongoing struggle between inflationary pressures and economic data.
You might be wondering, "Why should I consider adding GBP/USD market orders to my trading strategy?" Well, dear traders, the answer lies within the potential for significant profits derived from this exciting market. By closely monitoring the UK's economic landscape and keeping a keen eye on inflationary trends, we can seize the moment and capitalize on the fluctuations of the GBP/USD pair.
So, let's dive into the call to action! I encourage you to take advantage of this moment and consider adding GBP/USD market orders to your trading repertoire. By doing so, you position yourself to potentially reap the rewards of the UK's highest inflation levels and the impact of poor economic data on the pound. As we navigate these challenging times, let us remember that adversity often breeds success for those willing to take calculated risks.
To maximize your potential gains and minimize risks, I recommend conducting thorough research, staying updated with the latest news, and utilizing technical analysis tools to identify breakout points and establish appropriate stop-loss levels. Remember, knowledge is power, and a well-informed trader is successful!

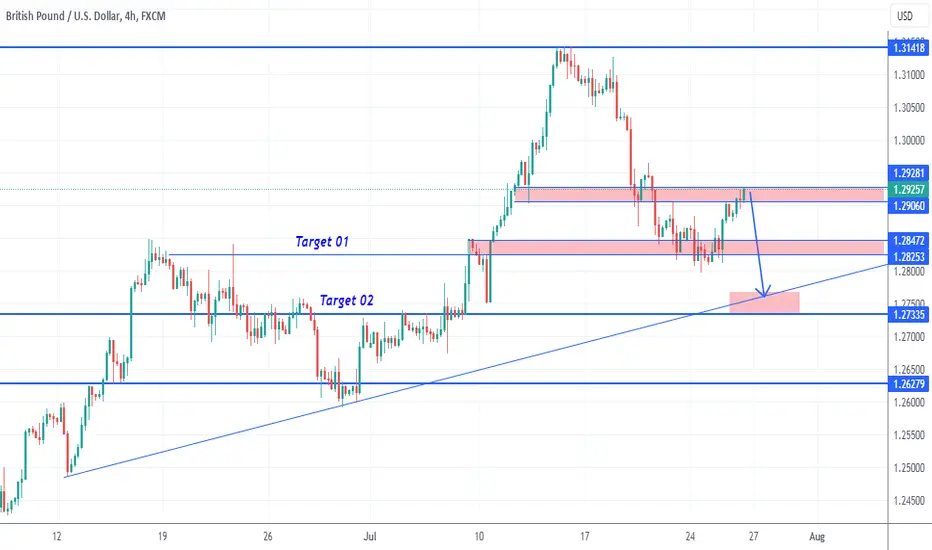
orderblock gbpusdgbpusd has a orderblock on the 4H. look back at this zone. from here we wil fal to the targets
1.3000
1.2935
1.2750

GBPUSD✔️Expecting Mid Term Bullish Wave⚠️C onfirmation Trade Reaction from BUY area ..!!!
🟢 Try to BUY🔼 all the Dips !!!
✅ Confirmation 1.2650 zone
✅ Expecting Mid Term Bullish Wave
🔔 NEXT TARGET 1.2750
