Bearish GBP/USD Outlook: Shorting the Pound Against the DollarI can write a lot of text here but let make it short, liek and sub from you for that:
3 options:
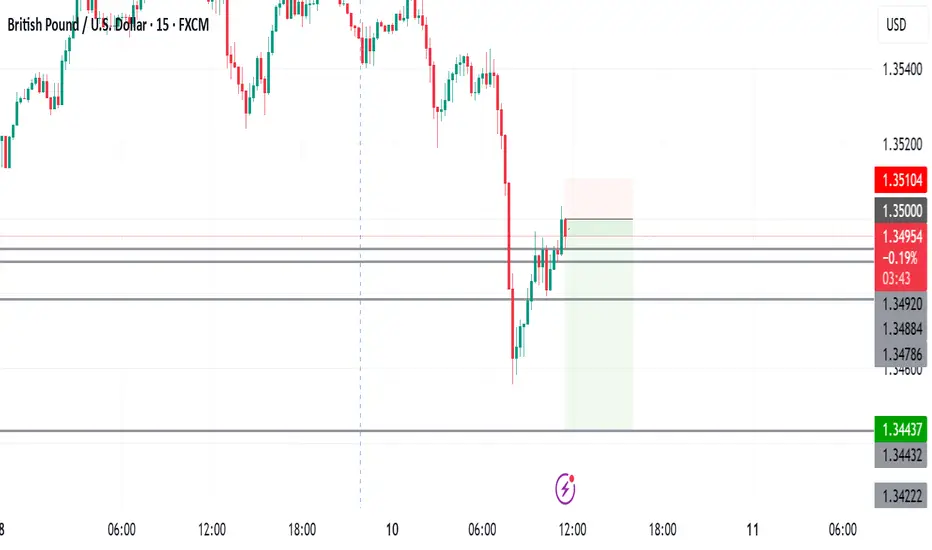
pump till PDH then dump to weekly FVG 1.34 area
dump from here till weekly FVG 1.34 area
if it breaks above PWH with good volume and closing at least on 4h then only longs
Gbpusdshort

GBPUSD(20250619)Today's AnalysisMarket news:
Fed's June meeting - kept interest rates unchanged for the fourth time in a row, and the dot plot showed two rate cuts this year, but the number of officials who expected no rate cuts this year rose to 7, and the rate cut expectations for next year were cut to 1. Powell continued to call for uncertainty, and the current economic situation is suitable for waiting and watching. He also expects tariff-driven inflation to rise in the coming months.
Technical analysis:
Today's buying and selling boundaries:
1.3432
Support and resistance levels:
1.3507
1.3479
1.3461
1.3403
1.3385
1.3357
Trading strategy:
If the price breaks through 1.3432, consider buying, and the first target price is 1.3461
If the price breaks through 1.3403, consider selling, and the first target price is 1.3385

GBPUSD Analysis todayHello traders, this is a complete multiple timeframe analysis of this pair. We see could find significant trading opportunities as per analysis upon price action confirmation we may take this trade. Smash the like button if you find value in this analysis and drop a comment if you have any questions or let me know which pair to cover in my next analysis.

GBPUSD IS LOOKING WEAK FOR A HARD SELL OFF SWING TRADEOANDA:GBPUSD Has broken the bullish swing low on 4 Hour time frame with strong sell off bearish candles leaving behind a big bearish imbalances in price. Which extra confirm that price is extremely bearish on 4 Hour time frame.
Now that trend has shifted from bullish trend to a bearish one, am now bearish on GBPUSD.
Bearish shift in market structure that happened on OANDA:EURUSD EURUSD which is a correlating pair with GBPUSD extra confirm this bearish bias on GBPUSD.
likewise also, the Bullish Shift in Market Structure on OANDA:USDCAD USDCAD, which is an opposite correlating pair confirm this sell on GBPUSD.
So, my focus now is selling GBPUSD in every pullback or retest of key bearish levels.
I will update you as the trade develop.

GBP/USD - SMT with EUR/USD, SHORTExcited to share my first idea with you guys !
To start with, my name is Soulayman and have started my trading journey in October 2024. It was very hard at first, but after hard work and dedication we all know we can make it happen. I basically studied ICT concepts, and was able to integrate those into a system that I have built myself ( this is what every trader should do in my opinion, it will make you understand better ).
And that is why I am here today on Trading View, sharing my first ever idea with you guys !
I'll make it very simple , no extravagant analysis or super complicated trendlines all over the place ... =D
This is what I see :
1 - GBP/USD potentially forming a SMT with EUR/USD after sweeping London High located inside a fair value gap (which makes this play stronger)
2- After the sweep occurs, I will be waiting on a 5 MINUTE break of structure (since 1 min break outs are manipulation most of the times so i prefer to stay safe). If this is followed by a fair value gap, it reinforces our idea showing the market has intent to push price lower.
3 - Now , let's talk about the HIGH TIME FRAME structure (4H) clearly shows the price wants to sell and that it is targeting Sellside liquidity Equal Lows. We could than anticipate a reversal from there.
We currently have price pulling back towards the HTF FVG, failed to close above the most recent high and having bearish reaction.
Since everything aligns with our BIAS, we will let it play out and wait on the sweep !
I will be posting updates during the day =D
Stay tuned ! Talk to you guys soon !

Analysis of GBPUSD 1-Hour Chart Signaling Bullish TrendAnalysis of GBP/USD 1-Hour Chart Signaling Bullish Trend 📈
I. Support Levels & Chart Patterns
Support Confirmation
After testing the 1.34135 support zone, price rebounded sharply with consecutive bullish candles 🚀, forming a potential "double bottom" pattern (or wave low). This successful defense of support reinforces the foundation for upward movement 🏗️.
Resistance Breakout Potential
Price is currently advancing from the 1.34600 short-term support. The key resistance lies at 1.35160. A decisive breakout above this level would validate the bullish projection indicated by the upward arrows on the chart 🎯
⚡️⚡️⚡️ GBPUSD ⚡️⚡️⚡️
🚀 Buy@ 1.33500 - 1.34000
🚀 TP 1.35000 - 1.35500
Accurate signals are updated every day 📈 If you encounter any problems during trading, these signals can serve as your reliable guide 🧭 Feel free to refer to them! I sincerely hope they'll be of great help to you 🌟 👇

GBPUSD London ShortsWhat I see and we could have one massive push down to setup a mid reversal today/tomorrow

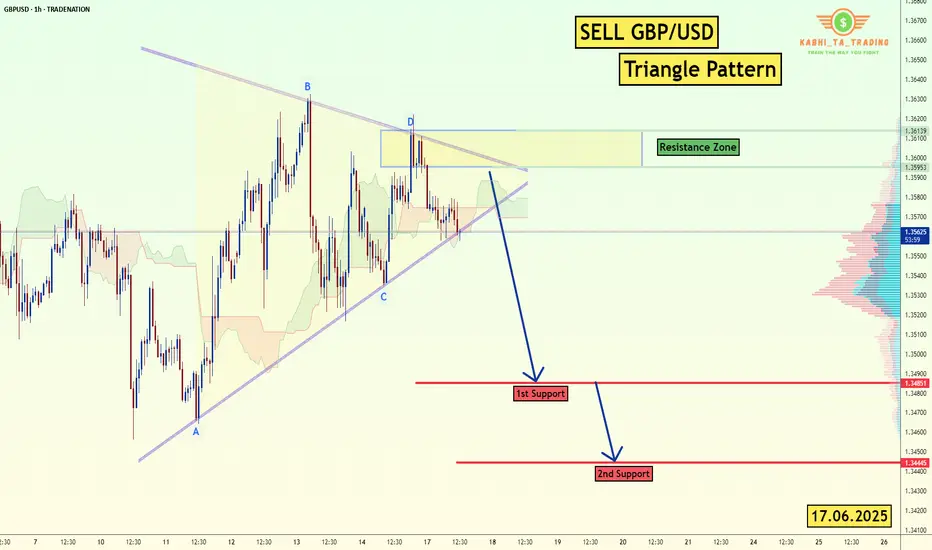
GBP/USD - H1-Triangle Breakout (17.06.2025)The GBP/USD Pair on the H1 timeframe presents a Potential Selling Opportunity due to a recent Formation of a Triangle Breakout Pattern. This suggests a shift in momentum towards the downside in the coming hours.
Possible Short Trade:
Entry: Consider Entering A Short Position around Trendline Of The Pattern.
Target Levels:
1st Support – 1.3485
2nd Support – 1.3444
🎁 Please hit the like button and
🎁 Leave a comment to support for My Post !
Your likes and comments are incredibly motivating and will encourage me to share more analysis with you.
Best Regards, KABHI_TA_TRADING
Thank you.
Disclosure: I am part of Trade Nation's Influencer program and receive a monthly fee for using their TradingView charts in my analysis.
GBPUSD Pre-NY + News SetupPressure to the downside ... until mid-week reversal
Snacking with this one:
GBPUSD SHORT FORECAST Q2 W25 D17 Y25GBPUSD SHORT FORECAST Q2 W25 D17 Y25
Professional Risk Managers👋
Welcome back to another FRGNT chart update📈
Diving into some Forex setups using predominantly higher time frame order blocks alongside confirmation breaks of structure.
Let’s see what price action is telling us today!
💡Here are some trade confluences📝
✅Weekly order block
✅15' order block
✅Intraday 15' break of structure
✅Tokyo ranges to be filled
🔑 Remember, to participate in trading comes always with a degree of risk, therefore as professional risk managers it remains vital that we stick to our risk management plan as well as our trading strategies.
📈The rest, we leave to the balance of probabilities.
💡Fail to plan. Plan to fail.
🏆It has always been that simple.
❤️Good luck with your trading journey, I shall see you at the very top.
🎯Trade consistent, FRGNT X

GBP/USD Bearish Rejection at Resistance Zone – Downside Targets GBP/USD Bearish Rejection at Resistance Zone – Downside Targets Ahead 🚨
This chart analysis of GBP/USD reveals a clear bearish structure unfolding after the pair tested a strong resistance zone near the 1.36000 level. Here's the professional breakdown:
🔴 Key Resistance Zone: 1.36000 – 1.36200
Price has been rejected multiple times from this upper zone (marked in red).
Repeated upper wicks and lower closes signal selling pressure.
Recent candle formations suggest a potential reversal from this level.
🟢 Major Support Zones:
1.33090 (Mid-Level Support)
This level has acted as a reaction zone in the past.
Could provide temporary consolidation or bounce.
1.31500 – 1.32000
Strong historical support, price bounced here previously.
Bears might slow down in this area before continuation.
1.28000 – 1.29000
Deeper support zone; if broken, could indicate a major trend shift.
📉 Bearish Projection
Price is expected to descend toward 1.33090, and if momentum continues, potentially down to the 1.28 region.
The zigzag projection in the black box reflects a stair-step pattern typical of strong bearish legs.
🧠 Market Psychology & Price Action
Sellers are defending the resistance aggressively.
Lower highs and consistent rejection candles imply weakening bullish momentum.
This setup aligns with a distribution phase before a drop.
📌 Conclusion
🔻 As long as the price remains below the 1.36000 resistance, the bias remains bearish. Watch for confirmations at 1.33090 and 1.32000 – these are crucial zones where price decisions will unfold.
📆 Short to mid-term traders may look for sell setups on retracements with stop-losses above the resistance and targets near support zones.

GBPUSD consolidates resistance zone and declinesPlan GBPUSD day: 16 June 2025
Related Information: !!!
The Pound Sterling (GBP) ticks up to near 1.3590 against the US Dollar (USD) so far on Monday, remaining inside Friday’s trading range. The GBP/USD pair is expected to keep trading within a tight range as investors have sidelined ahead of monetary policy announcements by the Federal Reserve (Fed) and the Bank of England (BoE), due on Wednesday and Thursday, respectively.
At the start of the week, the US Dollar Index (DXY), which tracks the Greenback’s value against six major currencies, edges down to near 98.00.
Investors will closely monitor the interest rate guidance from both central banks, while they are expected to leave those unchanged at their current levels
personal opinion:!!!
At the beginning of the week, there was not much important news. GBPUSD price was sideways and reacted to resistance and support zones.
Important price zone to consider :
SELL point: zone 1.35950
Sustainable trading to beat the market

GBPUSD SHORT FORECAST Q2 W25 D16 Y25GBPUSD SHORT FORECAST Q2 W25 D16 Y25
Professional Risk Managers👋
Welcome back to another FRGNT chart update📈
Diving into some Forex setups using predominantly higher time frame order blocks alongside confirmation breaks of structure.
Let’s see what price action is telling us today!
💡Here are some trade confluences📝
✅Weekly order block
✅15' order block
✅Intraday 15' break of structure
✅Tokyo ranges to be filled
🔑 Remember, to participate in trading comes always with a degree of risk, therefore as professional risk managers it remains vital that we stick to our risk management plan as well as our trading strategies.
📈The rest, we leave to the balance of probabilities.
💡Fail to plan. Plan to fail.
🏆It has always been that simple.
❤️Good luck with your trading journey, I shall see you at the very top.
🎯Trade consistent, FRGNT X

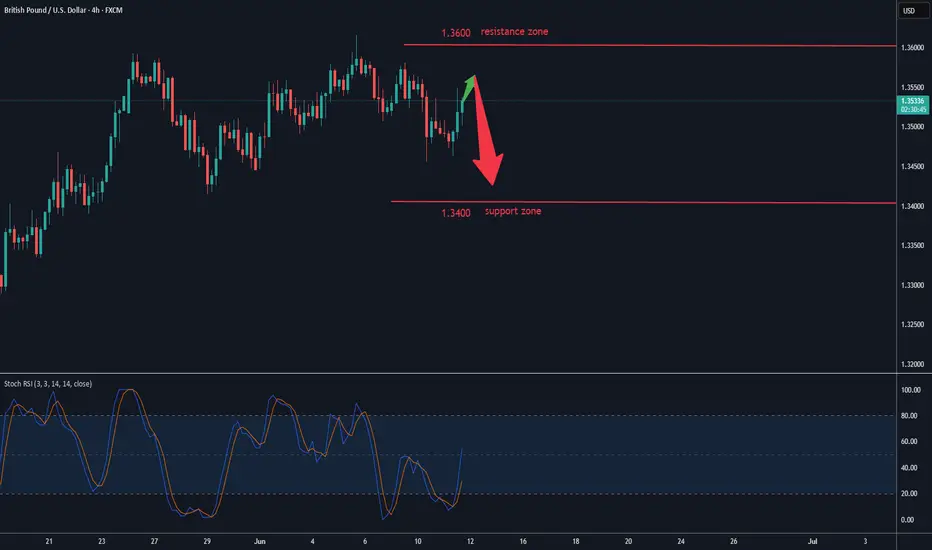
GBPUSD will continue to rise and break last week's highGBPUSD is correcting lower in the range at the end of the week. This pullback is heading towards the 1.350 support. There will be a bullish reaction at this area. Or if the selling pressure really takes over the market at this support area, then pay attention to the 1.346 bottom for the BUY strategy of this currency pair.
On the other hand, 1.360 will prevent the price increase. It will act as strategic resistance before a new extended breakout to the upside.
The uptrend is more likely to continue than the downtrend, so prioritizing BUY signals will bring better profits to the currency pair.
Support: 1.350, 1.346
Resistance: 1.360, 1.366

GBPUSD SHORT FORECAST Q2 W24 D13 Y25GBPUSD SHORT FORECAST Q2 W24 D13 Y25
Professional Risk Managers👋
Welcome back to another FRGNT chart update📈
Diving into some Forex setups using predominantly higher time frame order blocks alongside confirmation breaks of structure.
Let’s see what price action is telling us today!
💡Here are some trade confluences📝
✅Weekly order block
✅15' order block
✅Intraday 15' break of structure
✅Tokyo ranges to be filled
🔑 Remember, to participate in trading comes always with a degree of risk, therefore as professional risk managers it remains vital that we stick to our risk management plan as well as our trading strategies.
📈The rest, we leave to the balance of probabilities.
💡Fail to plan. Plan to fail.
🏆It has always been that simple.
❤️Good luck with your trading journey, I shall see you at the very top.
🎯Trade consistent, FRGNT X

GBPUSD(20250613)Today's AnalysisMarket news:
The number of initial jobless claims in the United States for the week ending June 7 was 248,000, higher than the expected 240,000, the highest since the week of October 5, 2024. The monthly rate of the core PPI in the United States in May was 0.1%, lower than the expected 0.30%. Traders once again fully priced in the Fed's two interest rate cuts this year.
Technical analysis:
Today's buying and selling boundaries:
1.3585
Support and resistance levels
1.3685
1.3648
1.3624
1.3547
1.3522
1.3485
Trading strategy:
If the price breaks through 1.3624, consider buying in, the first target price is 1.3648
If the price breaks through 1.3585, consider selling in, the first target price is 1.3547

GBP/USD Rally Resumes – Bullish Targets AheadHi everyone,
As outlined in our previous GBP/USD analysis (idea linked below), the Cable confirmed its continued rally following a decisive break above the 1.35195 level. This was quickly followed by a move through our highlighted levels at 1.35630 and 1.35934.
As previously noted, the clearance of these levels strengthens our expectation for further upside, with the next key level of interest around 1.36850. We'll be watching to see how price action develops from here.
We’ll continue to provide updates on the projected path for GBP/USD as price approaches this target.
The longer-term outlook remains bullish, and we expect the rally to continue extending further from the 1.20991 January low.
We’ll be keeping you updated throughout the week with how we’re managing our active ideas. Thanks again for all the likes/boosts, comments and follows — we appreciate the support!
All the best for the week ahead. Trade safe.
BluetonaFX

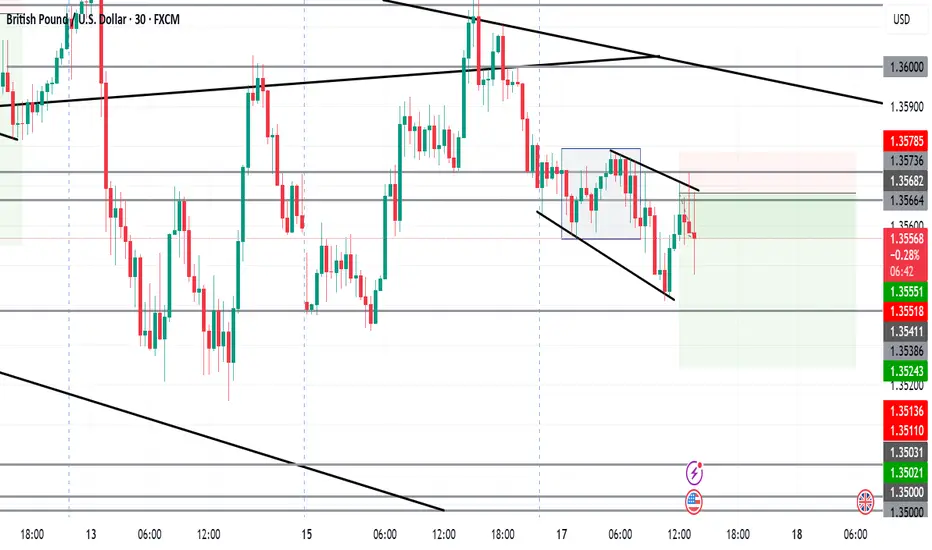
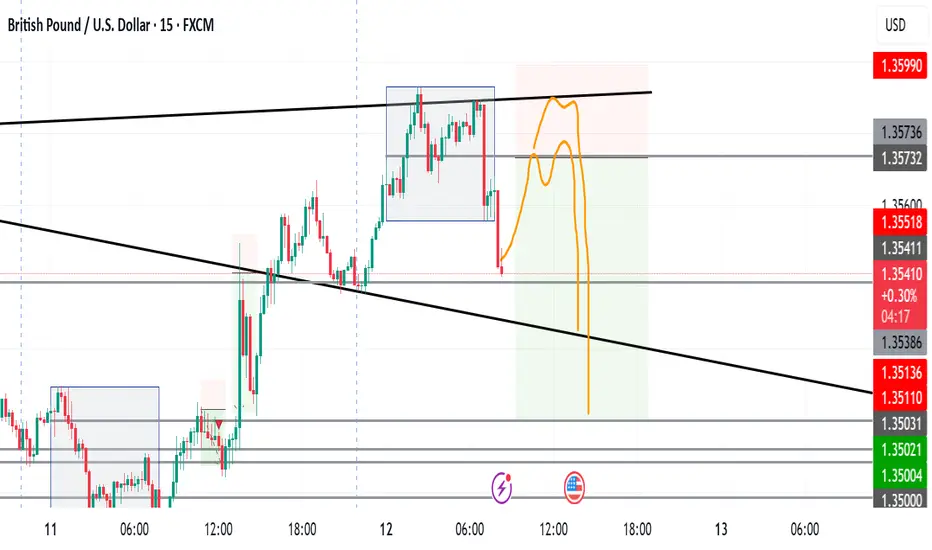
London Take 1 - GBPUSD - 12/6/2025SO this is what I see and anticipating ...more updates will follow.
PINK ZONE initially is ENTRY/KILL ZONE not entry and stoploss, screenshots after I am in the trade will update to atual short position with EP, SL & TP and my notes will elaborate.
News later at NY ...will be staying safe but looking to catch some pips
GBP/USD Technical Analysis – Bearish Setup Developing!GBP/USD Technical Analysis – Bearish Setup Developing! 🔻
Chart Breakdown (H4):
📌 Resistance Zone (🔴 1.35800 – 1.36000):
The pair has been rejected multiple times from this strong resistance area, marked by multiple upper wicks and bearish pressure. Most recent price action shows another rejection, forming a lower high.
📌 Support Level (🟣 1.34732):
This key horizontal level has acted as a strong support multiple times (highlighted with 🟠 circles), suggesting bulls are attempting to defend this zone.
📉 Bearish Structure Formation:
Price recently tested resistance again and was rejected sharply.
A potential double-top or lower high structure is forming.
A break and close below the 1.34732 support will likely confirm bearish momentum.
📍 Next Target (🔻):
If support breaks, price may fall towards the support demand zone around 1.34150 – 1.34300, aligning with the marked red support box.
📈 Invalidation Point:
A clean breakout and hold above 1.36000 would invalidate this bearish bias and potentially signal continuation higher.
⚠️ Summary:
🔼 Resistance Rejection at 1.36000
🔽 Watching for break below 1.34732
🎯 Bearish target: 1.34300 zone
🔄 Invalidation: Break above 1.36000
Bias: 📉 Bearish Below 1.34732

GBPUSD SHORT FORECAST Q2 W24 D12 Y25GBPUSD SHORT FORECAST Q2 W24 D12 Y25
Professional Risk Managers👋
Welcome back to another FRGNT chart update📈
Diving into some Forex setups using predominantly higher time frame order blocks alongside confirmation breaks of structure.
Let’s see what price action is telling us today!
💡Here are some trade confluences📝
✅Weekly order block
✅15' order block
✅Intraday 15' break of structure
✅Tokyo ranges to be filled
🔑 Remember, to participate in trading comes always with a degree of risk, therefore as professional risk managers it remains vital that we stick to our risk management plan as well as our trading strategies.
📈The rest, we leave to the balance of probabilities.
💡Fail to plan. Plan to fail.
🏆It has always been that simple.
❤️Good luck with your trading journey, I shall see you at the very top.
🎯Trade consistent, FRGNT X

The British pound's rebound was blockedThe British pound staged a technical rebound after a sharp decline on Tuesday, trading near 1.35 during the North American session. A day earlier, the exchange rate had retreated amid expectations that the Bank of England (BoE) would continue to cut rates twice within the year, triggered by weak UK labor market data. However, on Wednesday, against the backdrop of the US CPI data falling short of expectations, the US Dollar Index weakened, allowing the pound to rebound. Although the exchange rate has regained the 1.35 threshold currently, if UK economic data continues to be weak, the pound may test support levels at 1.34 or lower again.
Humans need to breathe, and perfect trading is like breathing—maintaining flexibility without needing to trade every market swing. The secret to profitable trading lies in implementing simple rules: repeating simple tasks consistently and enforcing them strictly over the long term.
GBPUSD Downward pressure, an usual setup in line with trend
GBPUSD Downward pressure, an usual setup in line with trend
GBPUSD trade ideaFX:GBPUSD
Reason sell:
1) overall bearish
2) candle on trendline rejection
3) spinning top candle signals nearby reversal
4) target previous low
