GBPUSD SHORT FORECAST Q2 W17 D23 Y25 1' ENTRY MODEL EDUCATIONGBPUSD SHORT FORECAST Q2 W17 D23 Y25 1' ENTRY MODEL EDUCATION
Professional Risk Managers👋
Welcome back to another FRGNT chart update📈
Diving into some Forex setups using predominantly higher time frame order blocks alongside confirmation breaks of structure.
Let’s see what price action is telling us today!
💡Trade confluences📝
✅Weekly Order block rejection
✅15’ order block created
✅15’ wick rejections via order block
✅Intraday bearish breaks of structure
✅Tokyo ranges to be filled
✅1’ break of structure
✅1’ bearish engulfing candle fill
✅Sell limit order on the 1’ candle fill
✅Sell limit order via 1' order block created upon 1' break of structure
🔑 Remember, to participate in trading comes always with a degree of risk, therefore as professional risk managers it remains vital that we stick to our risk management plan as well as our trading strategies.
📈The rest, we leave to the balance of probabilities.
💡Fail to plan. Plan to fail.
🏆It has always been that simple.
❤️Good luck with your trading journey, shall see you at the very top.
🎯Trade consistent, FRGNT X
Gbpusdshort

As the dollar's weak trend signals an endTrump's remarks and attitudes in trade negotiations have had a significant impact on the market 📈💥
His change in attitude towards the Federal Reserve Chairman first triggered investors' concerns about the Fed's policy, leading them to seek refuge in gold and causing the price of gold to rise 🏆🚀. Later, his remarks alleviated those concerns, prompting funds to flow back into dollar-denominated assets and causing the price of gold to decline from its peak levels 📉💔
In terms of trade negotiations, potential easing measures may reduce the demand for gold as a safe-haven asset ⏳
Taken together, these factors may imply that market confidence in the dollar has been somewhat restored 🌟. When signs of the end of the dollar's weak trend emerge 📊, more funds flow into dollar assets 💸. Against the backdrop of this change in the direction of capital flows, the GBPUSD has declined 😔
⚡⚡⚡ GBPUSD ⚡⚡⚡
🚀 Sell@1.32800 - 1.32600
🚀 TP 1.32200 - 1.32000
The market has been extremely volatile lately 📈📉 If you can't figure out the market's direction, you'll only be a cash dispenser for others 💰

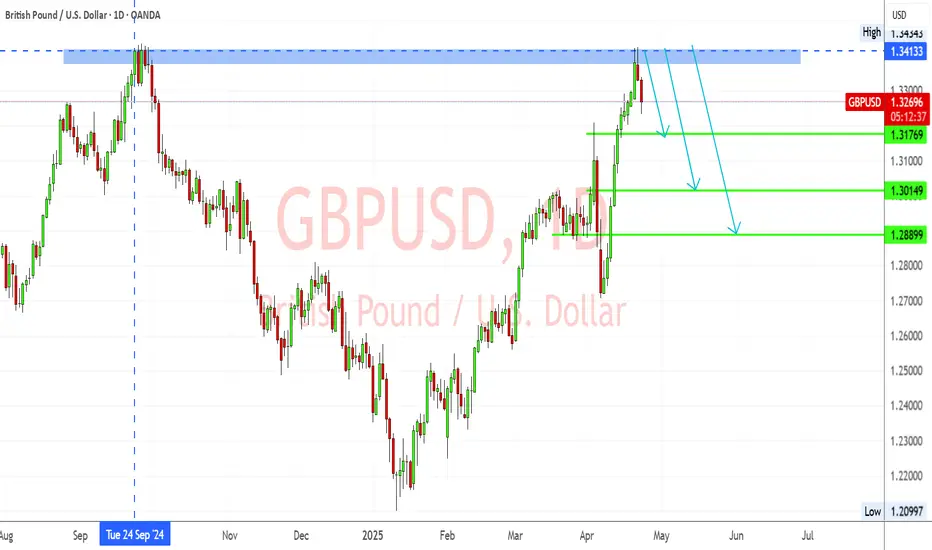
GBPUSD – Rejected at Multi-Month Resistance Amid Weak UK DataGBPUSD has clearly rejected the 1.3413–1.3443 resistance zone—a key area that previously acted as strong supply in September 2024. The pair has formed a bearish rejection candle and is now showing signs of downward momentum.
Key Levels:
Resistance: 1.3413 – 1.3443 (major rejection zone)
TP1: 1.3176 (minor structure)
TP2: 1.3014 (key demand zone)
TP3: 1.2890 (deeper support target)
Bearish Confluences:
Price rejected from major resistance
Bearish candle formation
Previous similar reaction from the same level
Momentum indicators favor downside
📰 Fundamental Analysis:
🔻 UK Data Weakens Further:
According to the latest S&P Global Flash UK PMI (Apr 23):
Composite Output Index: 48.2 (vs 51.5 in March) – 29-month low
Services PMI: 48.9 – 27-month low
Manufacturing PMI: 44.0 – 20-month low
This shows UK private sector activity contracting, led by a steep fall in new export orders, the worst since May 2020.
🔺 Inflation Still High:
Despite falling activity, input and output prices surged, driven by National Insurance hikes and wage growth. This makes it harder for the BoE to justify a cut, despite recession signs.
📌 Conclusion:
The bearish rejection at 1.3413 resistance, combined with deteriorating UK fundamentals, suggests a strong downside setup for GBPUSD. A break below 1.3176 would confirm the bearish move, targeting 1.3014 and potentially 1.2890.
GBPUSD possible short for 1.3030gbpusd tested strong resistance level and high of the year 2024 which is 1.2423. her is weekly supply zone. price may start distribution for big sell. 1.3370-1.3430 weekly supply zone, stop loss place above weekly resistance i.e. 1.3475, target: 1.3030.

GBPUSD SHORT FORECAST Q2 W17 D23 Y25GBPUSD SHORT FORECAST Q2 W17 D23 Y25
Professional Risk Managers👋
Welcome back to another FRGNT chart update📈
Diving into some Forex setups using predominantly higher time frame order blocks alongside confirmation breaks of structure.
Let’s see what price action is telling us today!
🔑 Remember, to participate in trading comes always with a degree of risk, therefore as professional risk managers it remains vital that we stick to our risk management plan as well as our trading strategies.
📈The rest, we leave to the balance of probabilities.
💡Fail to plan. Plan to fail.
🏆It has always been that simple.
❤️Good luck with your trading journey, shall see you at the very top.
🎯Trade consistent, FRGNT X

GBPUSD SHORT FORECAST Q2 W17 D23 Y25GBPUSD SHORT FORECAST Q2 W17 D23 Y25
Professional Risk Managers👋
Welcome back to another FRGNT chart update📈
Diving into some Forex setups using predominantly higher time frame order blocks alongside confirmation breaks of structure.
Let’s see what price action is telling us today!
💡Trade confluences📝
✅Weekly Order block rejection
✅15’ order block created
✅15’ wick rejections via order block
✅Intraday bearish breaks of structure
✅Tokyo ranges to be filled
✅1’ break of structure
✅1’ bearish engulfing candle fill
✅Sell limit order on the 1’ candle fill
🔑 Remember, to participate in trading comes always with a degree of risk, therefore as professional risk managers it remains vital that we stick to our risk management plan as well as our trading strategies.
📈The rest, we leave to the balance of probabilities.
💡Fail to plan. Plan to fail.
🏆It has always been that simple.
❤️Good luck with your trading journey, shall see you at the very top.
🎯Trade consistent, FRGNT X

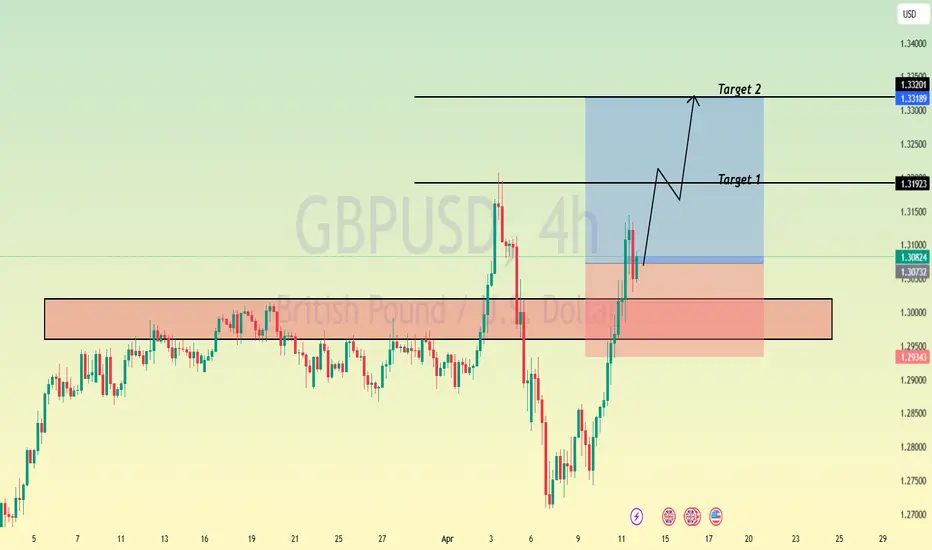
Short term retracement on GBPUSD before continuing the uptrendGBPUSD has been flying for a while now due to dollar weakening.
From my analysis it looks like it is currently making a short term retracement to fill some imbalances before continuing to the upside again.

EURUSD and GBPUSD Analysis todayHello traders, this is a complete multiple timeframe analysis of this pair. We see could find significant trading opportunities as per analysis upon price action confirmation we may take this trade. Smash the like button if you find value in this analysis and drop a comment if you have any questions or let me know which pair to cover in my next analysis.

GBPUSD SHORT FORECAST Q2 W17 D22 Y25GBPUSD SHORT FORECAST Q2 W17 D22 Y25
SUMMARY
- Weekly order block
- Daily order block
- Price action bullish in current point of interest.
REQUIREMNTS
- Setup A) Substantial 15' break of structure, creating 15' order block to short from on the pull back.
- Setup C) Lower time frame break of structure without initial 15' break of structure.
- Candle stick formation confluences.
FRGNT X
IG - JCFRGNT

GBPUSD Let’s see if sellers step in.GBP/USD Trade Update: Holding My Sell at 1.32480
I entered a sell trade at 1.32480, expecting a reversal based on key technical and fundamental setups. But with GBP/USD now sitting at 1.33814, I have to reassess market conditions while still staying true to my trading approach.
Fundamental Overview – Why I Still Favor Downside
This week’s economic events could create volatility, and I’m paying close attention to:
UK PMI (April 23): Expected declines in Manufacturing (44.1) and Services (51.0) suggest economic weakness, which could weigh on GBP.
US Durable Goods Orders (April 24): Mixed expectations—headline at +1.8%, but ex-defense and transportation are negative, meaning uncertainty in USD strength.
UK Retail Sales (April 25): Forecasted at -0.3%, signaling weaker consumer spending. This aligns with my sell bias, as slowing UK economic data could trigger renewed selling pressure.
If the UK data disappoints, GBP/USD could struggle to hold higher levels, reinforcing my trade.
Technical & Price Action Analysis
Resistance Holding at 1.342–1.345:
Strong resistance is forming here. If bulls fail to push past this zone, my sell trade could still play out.
Wick formations near this level suggest some rejection, but confirmation is needed.
Key Support Levels for a Potential Drop:
1.330–1.331 (Flipped Resistance, Now Support) – Watching if price retests this zone.
1.326–1.327 (Major Support) – If momentum shifts, price could revisit this area.
1.321 (Stronger Support) – If price weakens further, this becomes my downside target.
Momentum is slowing, but the bullish trend is still intact unless price rejects at 1.342–1.345.
Volume Profile & Institutional Behavior – Are Big Players Selling?
Signs of Institutional Unloading:
Buy-side orders appear strong, but price is not breaking higher with conviction. This could mean large traders are selling into the rally.
Watching for a delta imbalance where buyers dominate order flow, but price fails to rise. This is a classic distribution sign.
Why This Matters: If institutions are offloading positions near 1.342–1.345, we could see price stall and reverse. My focus is on whether this resistance holds or breaks. That will define whether my sell trade remains valid.
My Trade Management Plan – Staying Patient
As a daily trader, I wait for the daily candle close before making adjustments.
If price rejects 1.342–1.345, I’ll hold my position with targets back toward 1.330–1.327.
If price breaks above resistance and holds, I may need to reevaluate my stop-loss placement.
Final Thoughts – Trusting My Process
I’m still holding my sell at 1.32480, but I recognize that buyers are testing key resistance. If institutions are quietly distributing, we could see a shift back to the bearish side, but I’m waiting for confirmation at the daily close.
I’ll update once the daily candle closes. Let’s see if sellers step in.

GBPUSD Happy Easter Traders! 4/20 6:33pm. I’m currently holding a sell position on GBP/USD at 1.32480, and despite price climbing to 1.32942, I see several technical and fundamental factors that support my trade idea.
Fundamental Perspective
Looking ahead, this week presents major economic events that could drive volatility in GBP/USD.
UK PMI (April 23): Manufacturing PMI is expected to drop to 44.1, while Services PMI may soften to 51.0—both indicators suggest economic slowdown, potentially putting downward pressure on GBP.
US Durable Goods (April 24): Forecasts show mixed numbers—headline durable goods is projected at +1.8%, but ex-transportation and ex-defense figures are negative, meaning uncertainty surrounding USD demand.
UK Retail Sales (April 25): The monthly figure is expected at -0.3%, signaling weaker consumer spending. This aligns with my sell bias, as deteriorating UK economic conditions could contribute to pound weakness.
If the UK data disappoints while US figures remain mixed or slightly stronger, GBP/USD could face renewed selling pressure, validating my position.
Technical Analysis - Historical & Indicator Confirmation
Looking at the daily chart, there’s strong alignment between price action and indicator readings that suggest a potential reversal:
Resistance Holding at 1.330–1.331:
The Stochastic at 74.88 suggests GBP/USD is nearing overbought conditions.
The Williams %R at -22.24 reinforces the idea that price is pushing into exhaustion territory.
Support Structure (Where Downside Pressure Could Build):
Immediate Support at 1.326–1.327: Previous lows from April 20 confirm this zone as a critical level for sellers.
Secondary Support at 1.321: Multiple recent price reactions suggest this area could serve as a strong downside target.
Deeper Support at 1.316–1.318: If bearish momentum strengthens, this area represents a key swing low.
Additionally, while price is pushing higher in the short term, it’s trading well above long-term daily EMAs, suggesting the rally is a temporary overextension rather than a sustained breakout. If GBP/USD fails to break above 1.330–1.331, momentum could shift in favor of my sell trade.
Trade Management & Outlook
Despite the recent push higher, I remain confident in my sell position as long as GBP/USD does not break and hold above 1.330–1.331. If price starts rejecting this level, the next downside target could be 1.326, followed by 1.321, where I’d consider taking partial profits.
With fundamental catalysts ahead, volatility will likely increase. If bullish momentum persists beyond 1.331, I may need to re-evaluate my position, but until that happens, my trade setup remains valid.
Final Thoughts
My sell at 1.32480 is built on strong reasoning—key fundamental risks, extended technical levels, and a solid structure of resistance all favor a potential reversal. If sellers step in soon, I’ll have the opportunity to secure profits on a well-planned move. Now, it’s a waiting game to see how price reacts to resistance and upcoming data.

GBPUSD Discretionary Analysis: Bounce at 1.33Hello traders.
On GBPUSD, I'm watching this 1.33 zone closely. It's where I'll be looking for a reaction. It can be a solid bounce spot if it shows signs.
Discretionary Trading: Where Experience Becomes the Edge
Discretionary trading is all about making decisions based on what you see, what you feel, and what you've learned through experience. Unlike systematic strategies that rely on fixed rules or algorithms, discretionary traders use their judgment to read the market in real time. It's a skill that can't be rushed, because it's built on screen time, pattern recognition, and the ability to stay calm under pressure.
There's no shortcut here. You need to see enough market conditions, wins, and losses to build that intuition—the kind that tells you when to pull the trigger or sit on your hands. Charts might look the same, but context changes everything, and that's something only experience can teach you.
At the end of the day, discretionary trading is an art, refined over time, sharpened through mistakes, and driven by instinct. It's not for everyone, but for those who've put in the work, it can be a powerful way to trade.

#GBPUSD: Massive Swing Sell Is In Making 1200+ Pips Worth? **FX:GBPUSD Price Analysis**
GBPUSD price has recently experienced an overbought condition, primarily due to the significant decline of the DXY index. This decline can be attributed to the ongoing trade dispute between China and the United States, which has resulted in a drop in the DXY index to its lowest point in the past eighteen months.
Conversely, the GBP has gained strength due to positive economic indicators indicating robust growth in the United Kingdom. This has made the GBP more attractive to investors.
The FX:GBPUSD price is expected to continue its upward trend and potentially reach the 1.35 level. However, it is also possible for the price to reverse its direction from this point.
**Targets:**
If the trade is activated, three targets have been set for the FX:GBPUSD price. These targets can be adjusted based on your own analysis and trading strategy.
We extend our sincere gratitude for your unwavering support and well wishes.
Best regards,
Team Setupsfx_

#GBPUSD: Two Prominent Buying Points! Will Dxy Bounce Back? Due to strong economic data supporting GBP, its price has been bullish throughout the week, especially since DXY plunged. Given ongoing trade tensions, we may see another higher high. This is risky, so please analyse it yourself.
Like and comment to support us in bringing more analysis.
Have a great weekend! ❤️
Team Setupsfx_

GBPUSD Analysis 4/18 11:13amI've been analyzing GBP/USD closely over the past few days, and here's where I stand. The daily historical data shows an overall uptrend from around 1.278 on April 9 to roughly 1.328 on April 18. Although the price has been climbing, I've noticed that momentum is starting to taper off, which makes me question whether this rally might be overextended.
On the fundamentals side, a series of high-impact events are coming up. For example, recent UK PMI readings have come in slightly weaker—manufacturing at 44.1 and services at 51—while US indicators like PMIs and housing data have shown mixed results, such as an unusually sharp drop in New Home Sales MoM. These data points suggest both the dollar and the pound are facing headwinds, and they add a layer of uncertainty over the near-term direction.
Technically, I've set up a sell trade at 1.32480 with the current price now at 1.32830. My chart tells me that if the market dives further.
Overall, while the short-term setup shows some bullish energy, the divergence with longer-term daily averages and the mixed fundamental data make me cautious. I'll be watching for a pullback toward those support levels that might validate my bearish stance.
That's it for me for today.. unless something unexpected happens ..
Have a great weekend!
BTW im looking for another pair to trade comment below your recommendations and why! Thanks!

GBPUSD:SIGNALHello friends
Given the good growth we had, we can buy within the specified support ranges with capital and risk management because buyers reacted well after the price correction and this could be the beginning of a good growth.
*Trade safely with us*

GBP/USD: The Bear's Ride Down the TrendAs I assess the GBP/USD market today, I see that the current price is 1.32466, and I’ve taken a sell position at 1.32480, which is moving well. Based on recent fundamentals, technical indicators, and historical weekly data, here’s my full market breakdown:
Fundamentals & Economic Outlook
Recent US economic data has provided mixed signals for the dollar:
Initial & 4-Week Jobless Claims: Came in lower than expected, signaling a stronger labor market, which supports USD strength.
Continuing Jobless Claims: Higher than expected, showing some lingering unemployment pressure.
Housing Starts: Significantly below expectations, hinting at weakness in real estate.
Building Permits: Surpassed expectations, suggesting future construction remains strong.
Looking ahead to next week, key events will shape price action:
UK S&P Global PMIs: If manufacturing and services figures improve, GBP may gain traction.
US PMIs & Home Sales: Expected to trend lower, possibly weakening USD momentum.
UK Retail Sales (Friday): Anticipated to drop significantly, which could weigh on GBP.
US Michigan Consumer Sentiment: Forecasted to decline, potentially putting USD under pressure.
With these fundamental factors, GBP/USD faces mixed conditions—potential volatility ahead.
Momentum readings show caution for bulls:
Short-term (1-minute to 15-minute) indicators suggest mild consolidation.
The 1-hour and daily charts indicate GBP/USD is overextended compared to historical averages.
Weekly and monthly averages are much lower (~1.27047 and 1.23141), signaling the risk of mean reversion.
Trading Strategy & Considerations
Since I’m already in a sell position, I’m watching support levels closely for profit-taking zones.
If price dips near 1.3100, I might secure partial profits before assessing further downside potential.
I’ll keep an eye on daily EMA (~1.25176) as a deeper support that might act as a turning point.
Technical divergences (such as the Accumulation Distribution Oscillator) hint at distribution pressure, reinforcing my bearish bias.
With all this being said, i'm looking for a new pair to dive deep into. What do you recommend and why? Im all ears! also dont hesitate to reach out id love to talk about forex! :) im in the works of creating a youtube page and maybe a X account. Hope to reach some of you there as well.
p.s i love this shit!

GBPUSD SHORT FORECAST Q2W W16 D17 Y25GBPUSD SHORT FORECAST Q2W W16 D17 Y25
GM GM!
- Potential 15' OB Short
- Potential 5' OB Short, lower time frame Break of structure via level
- Potential
SUMMARY
- Weekly order block rejection is the setup
- Required 15' Breaks of structure
FRGNT X

GBPUSD is in the Buying Direction after Testing SupportHello Traders
In This Chart GBPUSD HOURLY Forex Forecast By FOREX PLANET
today GBPUSD analysis 👆
🟢This Chart includes_ (GBPUSD market update)
🟢What is The Next Opportunity on GBPUSD Market
🟢how to Enter to the Valid Entry With Assurance Profit
This CHART is For Trader's that Want to Improve Their Technical Analysis Skills and Their Trading By Understanding How To Analyze The Market Using Multiple Timeframes and Understanding The Bigger Picture on the Charts
GBPUSD I Short Opportunity Coming Soon Welcome back! Let me know your thoughts in the comments!
** GBPUSD Analysis - Listen to video!
We recommend that you keep this pair on your watchlist and enter when the entry criteria of your strategy is met.
Please support this idea with a LIKE and COMMENT if you find it useful and Click "Follow" on our profile if you'd like these trade ideas delivered straight to your email in the future.
Thanks for your continued support!Welcome back! Let me know your thoughts in the comments!

GBPUSD SHORT FORECAST Q2 W16 D16 Y25GBPUSD SHORT FORECAST Q2 W16 D16 Y25
Thoughts- It's not if, it's WHEN !
All longs are null until the weekly order block has been breached or price drops considerably. In the here and now the short seems to be closing in.
It is as always important to stack confluences in favour of the short prior risking capital.
15' break of structure is an absolute requirement as this point of price action.
Within the higher time frame order block- looking for a lower time frame order block is not enough to short from therefore scrolling back months to find is pointless in our opinion.
We will let price show us, we will reaction with price.
What are your thoughts...
Are we dropping today?
FRGNT X

GBPUSD ShortWe have a lot of wicks which indicates slowdown in price and an bearish engulfing, we have an 5m imbalance where my entry is and i can cover the highs with the 10 pip stop.
75% will be taken off at 3RR, rest will go to 8RR asia low or breakeven.

GBPUSD SHORT FORECAST Q2 W16 D15 Y25GBPUSD SHORT FORECAST Q2 W16 D15 Y25
Morning Traders!
Let's await price action to tap into the weekly order block!
From then on, eyes open for 15' breaks of structure. Ensure that key higher low areas and double doubles for potential longs are broken before looking to short a fairly strong looking pound!
We simply await the pull back into s 15' order block that should be created post bearish move we have spoken of above. Upon the turn around in price action, we can be satisfied the bullish trend has exhaust somewhat.
Let's await the setup. No positions on GBPUSD until the above.
FRGNT X
