GBPUSD LONG SETUP CONTINUACION 15MINHello Traders , this an 15Min entry we still on a bullish Pullback we have to reach a daily P.O.I or at least 4H to reverse or continue the overall Bearish Trend because all this upward movement it just a pullback so this is a great 15Min Setup for price continuation
Gbpusdtrade

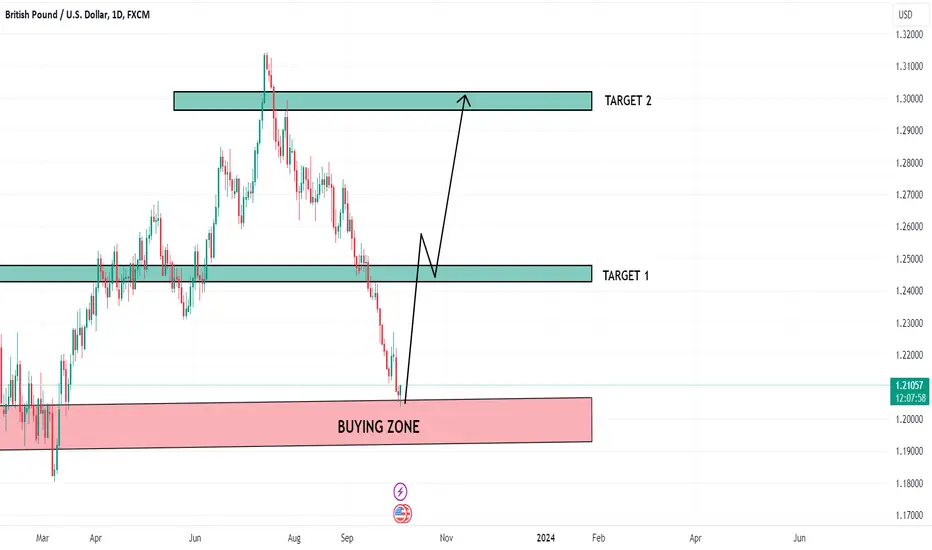
GBPUSD Analysis 12Oct2023During this week, the GBPUSD managed to overcome two bearish obstacles - a trendline and CHoCH formation. This strengthens the analysis that in the medium term, the GBPUSD trend has shifted to being bullish. The initial target for this trend is the SND area, which also intersects with the trendline (marked in red).

GBPUSDHello, according to my analysis of the GBPUSD pair, there is a good opportunity to buy with the pair exiting the descending channel. And breaking the level of 1.22530. It keeps the pair in a positive state and we could see more rises towards the 1.25000 level. Good luck to everyone.

GBPUSD - Bearish continuation ✅Hello traders!
‼️ This is my perspective on GBPUSD.
Technical analysis: Here we are on profit, as I said in my previous analysis price filled the imbalance and rejected from bearish order block. I see price to go lower to take sell side liquidity
Fundamental analysis: This week we have a lot of news on USD, on Wednesday will be released monthly PPI followed by FOMC Meeting and on Thursday monthly and yearly CPI. I expect we can see a decrease on CPI, which means strength of currency. As well, on Thursday will be released monthly GDP on GBP, if the result is lower than forecasted it means weakness of currency.
Like, comment and subscribe to be in touch with my content!

GBPUSD 4H maintains its positive stability GBPUSD
The pound sterling pair against the dollar focused on the breached resistance of the descending channel and rebounded upward to resume the expected upward corrective path in the immediate term.
stabilizing above 1.2172 will support rising to touch 1.2233 then 1.2280 then 1.2328
stabilizing under 1.2124 will support falling to touch 1.2095 then 1.2069
The expected trading range for today is between support 1.2035 and Resistance 1.2233
pivot price: 1.2172
Resistance prices: 1.2233 & 1.2280 & 1.2328
Support prices: 1.2095 & 1.2069 & 1.2035
The expected trading range for today is between support 1.2124 and resistance 1.2233
The general trend expected for today: bullish
timeframe: 4H

GBPUSD LONG TERM BUY IDEAHello Traders
In This Chart GBPUSD HOURLY Forex Forecast By FOREX PLANET
today GBPUSD analysis 👆
🟢This Chart includes_ (GBPUSD market update)
🟢What is The Next Opportunity on GBPUSD Market
🟢how to Enter to the Valid Entry With Assurance Profit
This CHART is For Trader's that Want to Improve Their Technical Analysis Skills and Their Trading By Understanding How To Analyze The Market Using Multiple Timeframes and Understanding The Bigger Picture on the ChartS


GBPUSD Bullish Breakout!GBP-USD was trading in
A falling parallel channel
But now we are seeing
A bullish breakout
So after the pullback and
Retest the pair is likely
To go further up !

GBPUSD - Bearish market structure ✅Hello traders!
‼️ This is my perspective on GBPUSD.
Technical analysis: Here we have similar situation as on GBPNZD, we are in a strong bearish market structure from 4H timeframe perspective, so I am looking for short. I want price to make a retracement in order to fulfill the imbalance higher and then to reject from bearish order block.
Fundamental analysis: On Friday we have important news on USD, will be released NFP and Unemployment Rate. If the results are negative, it will support our analysis.
Like, comment and subscribe to be in touch with my content!

GBPUSD END-WEEK ANALYSIS UPDATE 01/10/2023GBP/USD Bearish Outlook 📉
Watch out for potential bearish momentum in GBP/USD as the US Dollar strengthens. Plan short positions with a well-defined entry, stop-loss, and take-profit. Manage your risk wisely. 🚀💹 #GBPUSD #Forex #TradingView 📉

GBPUSD Analysis H1Here is my analysis for GBPUSD on H1 using Order Block. The price could go bullish, you can put a pending order on the Order block or find an entry on LTF within OB Zone. Trade Safe!

GBPUSD WEEKLY ANALYSIS-UPDATE 01/10/2023Anticipating Dollar Weakness for GBP/USD
📉 Expecting Dollar weakness to trigger a potential retracement on GBP/USD. Keep an eye on this pair for a possible pullback and correction and after we head back down following the current trend. 📈 #GBPUSD #Forex #TradingViewAnalysis

GBPUSD 4H OUTLOOK
GBPUSD
Analyze
If a price can stable above 1.2123 the direction will be uptrend again to reach 1.2160, 1.2205, 1.2243
For any reason if the price backs off and stable under 1.2123, the price will try to reach 1.2089If can break it then will reach 1.2047and 1.1984
Support line:1.2089 ,1.2047,1.1984
resistance line: 1.2160,1.2205,1.2243

GBPUSD LONG TERM BUY IDEAHello Traders
In This Chart GBPUSD HOURLY Forex Forecast By FOREX PLANET
today GBPUSD analysis 👆
🟢This Chart includes_ (GBPUSD market update)
🟢What is The Next Opportunity on GBPUSD Market
🟢how to Enter to the Valid Entry With Assurance Profit
This CHART is For Trader's that Want to Improve Their Technical Analysis Skills and Their Trading By Understanding How To Analyze The Market Using Multiple Timeframes and Understanding The Bigger Picture on the ChartS
GBPUSD Technical Analysis and Trade IdeaThe GBPUSD currency pair has faced significant downward pressure in recent times. Currently, it has descended to a crucial support level and appears to be in an overextended state. In our video, we delve into a prospective trading opportunity, grounded in a comprehensive assessment encompassing market structure, price action, the prevailing trend, and other pivotal aspects of technical analysis.
It's important to reiterate that the content presented in the video is intended strictly for educational purposes. It should not be interpreted as financial advice or guidance. Our objective is to provide a detailed breakdown of the market dynamics, equipping viewers with valuable insights to make well-informed trading decisions.

GBP/USD AnalysisAfter the move down from the 4h FVG yesterday I'm expecting GU to continue the momentum to the downside, I highly recommend to wait for a retracement into the inversing FVG and waiting for some confirmations in the lower time frames to take the liquidity at 1.2060 and further more from a long term persepective

GBPUSD | More Than a 1:1 Reward To Risk TradeThis is bearish potential on GBPUSD
12 hour timeframe is bearish. A new high was made on today.
Price can go lower overnight. If it does
we can adjust the take profit.
Stop loss and entry will stay the same.
Stop loss and entry are noted as
Entry: 1.21813
Stop loss: 1.22719
TP: Open but preferably the lower low after price pulls back and beyond.
You can move stop loss higher if you prefer more room for the trade to breathe.
Belief: For God did not give me a spirit of fear, but of power, love, and a sound mind.
Rather this trade wins or losses, I pray God for the opportunity.
Hey! Like the analysis. Much Love. ❤️

GBPUSD Potentially BearishPrice has broken the 1.21300 area, a retest of that same zone and its rejection to confirm continuation will be a good entry point.
Better to let market tell you its flow and you respond to it rather than attempt to predict it.
Disclaimer:
All trade ideas are given for educational purposes and should not be treated as an investment advice, hence do your due diligence. Past results does not guarantee future results

GBPUSD END-WEEK ANALYSIS-UPDATE 24/09/2023GBP/USD: Navigating Forex's Ebb and Flow - A Close Eye on DXY
GBP/USD has been a rollercoaster lately, with our earlier anticipation of a recovery proving accurate. Yet, in the ever-changing forex landscape, we must prepare for the next chapter.
Now, I'm keeping a watchful eye on a potential downturn for GBP/USD, in response to a stronger US dollar. A crucial note: this scenario hinges on the DXY maintaining its price above 105.864. Join me in this forex adventure as we navigate market fluctuations. Stay tuned for the upcoming developments! 📉📈 #GBPUSDAnalysis #MarketDynamics #TradingView

GBPUSD LONGRelated to the chart analysis I posted, I will attach the link in the description, Pound is turning for its highs now, here is an opportunity to take long trades , wait for the market to come to the demand zone. Currently, the market is in liquidity phase (testing its resent higher lows), wait for market to take people stop losses and come to demand zone. Go long from there.
Happy Trading

GBPUSD LONGPound has starting to reverse from its daily Demand Zone, wait for the market to start making higher highs for confirmation of long term, and Now we will look for buys instead of sells.
Happy Trading.

GBP USD BUYGBPUSD BUY Buying idea for the buy deal.
Be sure to observe the 1-minute time confirmations, including flips and chocks.

GBPUSD 4H (pivot price: 1.2200)
GBPUSD
stabilizing above 1.2200 will support rising to touch 1.2233 then 1.2280 then 1.2328
stabilizing under 1.2200 will support falling to touch 1.2152 then 1.2107
pivot price: 1.2200
Resistance prices: 1.2233 & 1.2280 & 1.2328
Support prices: 1.2152 & 1.2107 & 1.2035
timeframe: 4H
