GBPUSD Technical Analysis and Trade IdeaAnalysing the current situation of GBPUSD, it's evident that it overextended on the 1D timeframe while also trading at a crucial support level. I'm looking to get involved short, but not at the current level. In the video, we delve into various aspects such as the prevailing trend, price action, market structure, imbalances, and a potential trade opportunity. As usual, the video provides comprehensive explanations, but it's important to note that these should not be interpreted as financial advice.
Gbpusdtrade

GBPUSDCurrently waiting for a trend change confirmation on lower TF, but so far have been successful and would expect the incoming news to send it higher to the next support, or potentially rally up over the next weeks to highs from a few months ago.
Will update this idea as it plays out with what I do and if I enter

GBPUSD Analysis 27Aug2023continuing last week's analysis, where the price could not increase more than the invalid area. the price is back down to continue the bearish trend. the farthest target is still on the red line below.

GBPUSD Bearish patternA head and shoulder pattern is forming on the GBPUSD pair. For confirmation, it should be retesting the neckline and then moving forward towards TP 1 AND 2.

GBPUSDPrice seems to be stuck in a consolidation phase ranging between the 1.27873 and the 1.26639 zones. Although on the higher time frame (weekly) price seems to be making higher highs I would rather wait to see a breakout of the consolidation range before taking any position. Waiting is good trading strategy
Disclaimer:
All trade ideas are given for educational purposes and should not be treated as an investment advice, hence do your due diligence. Past results does not guarantee future results

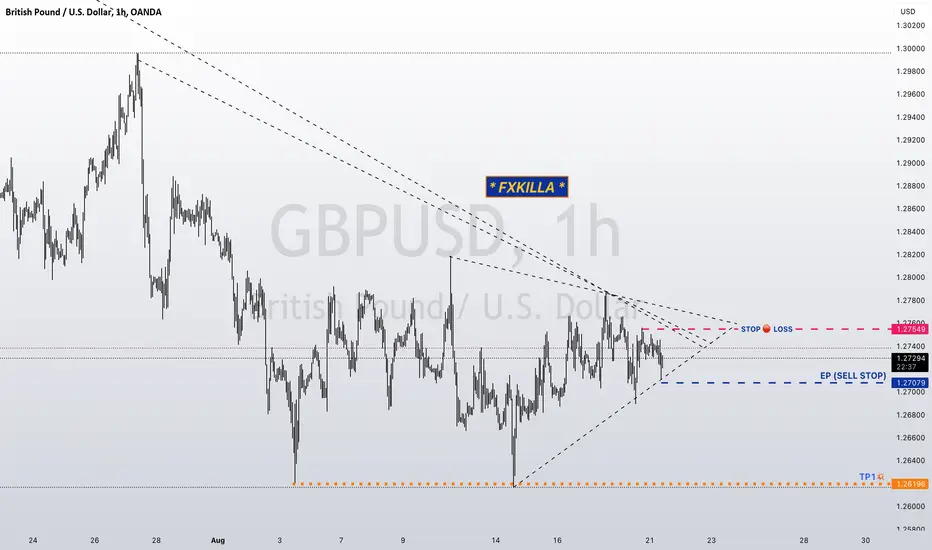
🚨GBPUSD HIGH PROBABILITY SELL SETUP🚨August 21/2023,
🚨GBPUSD HIGH PROBABILITY SELL SETUP🚨
* Here we can see clearly the next potential move for GBPUSD in coming hours or days.
* EP(SELL STOP): 1.27079
* TP1: 1.26196
* SL: 1.27549
* Keep your eyes close on your trading positions.
* Happy pip hunting traders.
* FXKILLA *
GBPUSD Long Term Buying Trading IdeaHello Traders
In This Chart EURJPY HOURLY Forex Forecast By FOREX PLANET
today EURJPY analysis 👆
🟢This Chart includes_ (EURJPY market update)
🟢What is The Next Opportunity on EURJPY Market
🟢how to Enter to the Valid Entry With Assurance Profit
This CHART is For Trader's that Want to Improve Their

GbpUsd- Break of range for 200 pips tradeSince the beginning of August, GbpUsd has been trading in a tight 150 pips range (a narrow range for a pair like GbpUsd).
Yesterday's price action left a nice bullish Pin Bar on our chart which could indicate gains going further. However, for this we need confirmation and this comes with a break above 1.28. In such an instance, the pair could test the important 1.3 figure.
On the other hand, a break under 1.26 would expose 1.24.
I usually don't write analyses like this: "if it breaks resistance is going up, if it breaks support is going down". I made one in the GbpUsd case because, after one month of consolidation, the break of the range could set the direction for the next period and this pair is, for sure, one to keep a close eye on at this moment.


🔻 GBPUSD 🔻 SHORT - Globally, targeting 1.2231-day Chart - GBPUSD FX:GBPUSD OANDA:GBPUSD SAXO:GBPUSD FOREXCOM:GBPUSD
We observed a highly impulsive downward movement upon reaching a key FTA.
I anticipate a trend reversal in the near future towards the minimum targets of 1.223.
P.S. If you liked the idea, hit the "Rocket" 🚀 (👇) – it would greatly motivate me. This will provide me with additional encouragement to continue sharing my market insights.
Subscribe ↗️ to stay updated on new ideas.

GBPUSD I Positioned to move higher Welcome back! Let me know your thoughts in the comments!
** GBPUSD Analysis - Listen to video!
We recommend that you keep this pair on your watchlist and enter when the entry criteria of your strategy is met.
Please support this idea with a LIKE and COMMENT if you find it useful and Click "Follow" on our profile if you'd like these trade ideas delivered straight to your email in the future.
Thanks for your continued support!

GBPUSD Local Bullish Bias!GBP-USD was making a
Bearish correction after
The breakout of the falling
Resistance which is a
Support now and we are
Already seeing a bullish
Rebound from the level so
I think that we will see
A further move up !

GBPUSD LONG TERM Selling IDEAHello Traders
In This Chart GBPUSD HOURLY Forex Forecast By FOREX PLANET
today GBPUSD analysis 👆
🟢This Chart includes_ (GBPUSD market update)
🟢What is The Next Opportunity on GBPUSD Market
🟢how to Enter to the Valid Entry With Assurance Profit
This CHART is For Trader's that Want to Improve Their Technical Analysis Skills and Their Trading By Understanding How To Analyze The Market Using Multiple Timeframes and Understanding The Bigger Picture on the ChartS

GBPUSD Top-down analysis Hello traders, this is a complete multiple timeframe analysis of this pair. We see could find significant trading opportunities as per analysis upon price action confirmation we may take this trade. Smash the like button if you find value in this analysis and drop a comment if you have any questions or let me know which pair to cover in my next analysis.

GBPUSD I Forecast & price predictionsWelcome back! Let me know your thoughts in the comments!
** GBPUSD Analysis - Listen to video!
We recommend that you keep this pair on your watchlist and enter when the entry criteria of your strategy is met.
Please support this idea with a LIKE and COMMENT if you find it useful and Click "Follow" on our profile if you'd like these trade ideas delivered straight to your email in the future.
Thanks for your continued support!

GBPUSD Analysis 17Aug2023There is a high possibility that the price will be bearish. This can be seen in the price response when responding positively to the trendline area, where the trendline is an opposition that is strong enough. Below is seen a liquidity area. Usually, the liquidity area will be responded to positively, and the price drops deeper than that area.

gbp usd buy opportunity with retesthello, according to my analysis of gbpusd pair. There is a very good buying opportunity as the price has broken the bullish channel. It also broke the strong resistance at 1.6200. The price returned to the same area, but could not penetrate it. With the formation of a very positive candle on the daily time frame, and another confirmatory candle, which is green, indicating the strength of the buyers. good luck for everbody

GBPUSD Technical Analysis and Trade IdeaThis video provides a detailed analysis of the GBPUSD. The currency pair has been experiencing a notable downward trend marked by considerable momentum. Throughout the video, we discuss the trend, support and resistance levels, price action, market structure, and a potential trade opportunity. It's important to emphasize that this content is strictly intended for educational purposes and should not be interpreted as financial advice.

GBPUSD Bearish Breakout and Retesting doneGBPUSD Bearish Breakout & Retesting done as you can see in chart H1. Take sell accordingly.

GBPUSD Analysis H4Here is my analysis for GBPUSD on H4 using Order Block. The price could go bearish, you can put a pending order on the Order block or find an entry on LTF within OB Zone. Trade Safe!

GBPUSD and EURUSD Top-down analysis Hello traders, this is a complete multiple timeframe analysis of this pair. We see could find significant trading opportunities as per analysis upon price action confirmation we may take this trade. Smash the like button if you find value in this analysis and drop a comment if you have any questions or let me know which pair to cover in my next analysis

GBP/USD 30M Support and ResistanceJourney into the dynamic realm of forex trading with us as we dissect the GBP/USD 30-minute chart. This exploration unveils critical technical levels, shedding light on significant support and resistance areas that can steer your trading decisions.
Support Levels:
1.26818: The initial bastion of support. A potential bounce from this level could signal a shift in price direction.
1.26192: A deeper layer of support. Keep a keen eye here for possible trend reversals.
Resistance Levels:
1.28100: The first line of resistance. A breakthrough here could pave the way for further upward movement.
1.28400: An intriguing resistance point. Crossing this threshold might indicate strengthening bullish sentiment.
1.28900: A notable challenge. Pushing beyond this level could signify a potential trend continuation.
Bear in mind that markets are in constant flux. These levels serve as guideposts, not absolutes. Pair them with a comprehensive trading strategy and consider broader market dynamics. Adaptability is key. Happy trading!

GBPUSD trigger for sellthis is my trigger and positions with two different stop loss and two different take profit. One of them is for 15 min time frame and the other is for 1H time frame.
please check the main analysis from GBP. there are all information about this analysis.
