GBPUSD Analysis – Bearish Setup Into Key ResistanceGBP/USD is trading into a key multi-week resistance zone between 1.3360 and 1.3413. The pair has failed to break this area multiple times, and current price action shows signs of compression and hesitation. With elevated UK inflation limiting BoE easing flexibility and renewed USD support following bond yield spikes, this setup offers a compelling bearish opportunity. Clean downside targets lie at 1.3177, 1.3016, and potentially 1.2890. The trade remains valid unless price breaks and holds above 1.3413.
🔍 Technical Analysis
Structure:
Price is testing a significant resistance zone (1.3360–1.3413) that’s held since early April.
Bearish trendline from May highs remains intact.
A descending structure is forming with lower highs and failed breakouts.
Support Levels to Watch:
1.3177 – Previous structure low
1.3016 – Strong horizontal support
1.2890 – March swing low and fib extension target
Confluence:
EUR/USD overlay shows rejection at similar highs, reinforcing risk-off dollar strength
Price failing to hold above fib retracement levels from prior swings
🌍 Fundamental Context
🇬🇧 British Pound (GBP):
UK inflation is climbing again (expected 3.0% CPI for April), delaying BoE's ability to cut further.
BoE’s Pill has pushed back on rapid easing, citing persistent service inflation.
UK-EU trade agreement provides medium-term support, but short-term upside appears priced in.
🇺🇸 U.S. Dollar (USD):
Despite Moody’s downgrade, U.S. yields are rising, supporting USD demand.
Trump’s tariff threats have injected global risk-off tones, lifting the dollar as a safe haven.
Fed remains cautious — no rate cuts expected soon.
🎯 Trade Setup
Bias: Bearish
Entry Zone: Near 1.3360–1.3413 resistance (wait for rejection candle confirmation)
Targets:
First: 1.3177
Second: 1.3016
Third: 1.2890
Invalidation: A daily close above 1.3413 would invalidate the bearish thesis
⚠️ Risk & Management Tips
Don’t short blindly into resistance — wait for strong wick or bearish engulfing candle.
Watch upcoming UK inflation data or Fed commentary for macro triggers.
Avoid over-leveraging: false breakouts near highs are common.
🧭 Conclusion
GBP/USD is coiling near a powerful resistance area. A confirmed rejection opens the door for a multi-leg downside move into 1.30 and below. As long as price holds beneath 1.3413, the risk-reward profile favors sellers. Patience and precision are key at this stage.
Gbpusdtrade

GBPUSD and GBPJPY Analysis todayHello traders, this is a complete multiple timeframe analysis of this pair. We see could find significant trading opportunities as per analysis upon price action confirmation we may take this trade. Smash the like button if you find value in this analysis and drop a comment if you have any questions or let me know which pair to cover in my next analysis.

GBPUSD pullbackOANDA:GBPUSD
As shown in our pinned analysis, this level was previously considered for a short trade. But after being broken, according to our plan, it has now turned into a buy zone.
We are ready to enter a long position,
but if the price drops below and holds, this level will lose its validity and the analysis will be invalid.
Follow us for more trades analysis!
For detailed entry points, trade management, and high-probability setups, follow the channel:
ForexCSP

Cup & Handle - Bullish Continuation PatternFX:GBPUSD continues its bullish trend, printing higher highs and higher lows. Currently price has formed a Cup & Handle pattern signalling potential bullish continuation!
Following the analysis, buys should only be triggered once neckline / resistance has been broken!

GBPUSD inverted head and shoulder?Hello traders, this is a complete multiple timeframe analysis of this pair. We see could find significant trading opportunities as per analysis upon price action confirmation we may take this trade. Smash the like button if you find value in this analysis and drop a comment if you have any questions or let me know which pair to cover in my next analysis.

DON'T MISS OUT ON GBPUSD SHORTS IN W21 OF Q2 Y25GBPUSD SHORT FORECAST Q2 W21 Y25
DON'T MISS OUT ON GBPUSD SHORTS IN W21 OF Q2 Y25
Professional Risk Managers👋
Welcome back to another FRGNT chart update📈
Diving into some Forex setups using predominantly higher time frame order blocks alongside confirmation breaks of structure.
Let’s see what price action is telling us today!
💡Here are some trade confluences📝
✅Weekly order block rejection
✅Daily order block rejection
✅Intraday 15' order blocks
✅Tokyo ranges to be filled
🔑 Remember, to participate in trading comes always with a degree of risk, therefore as professional risk managers it remains vital that we stick to our risk management plan as well as our trading strategies.
📈The rest, we leave to the balance of probabilities.
💡Fail to plan. Plan to fail.
🏆It has always been that simple.
❤️Good luck with your trading journey, I shall see you at the very top.
🎯Trade consistent, FRGNT X

GBP/USD Short Trade Setup – Targeting 1.31580 from 1.34281Entry Point: 1.34281
Stop Loss: 1.34554 (about 27 pips above entry)
Target Points:
Target One: 1.32698
Final Target (EA Target Point): 1.31580 (approx. 270 pips from entry)
Risk/Reward Ratio: Favorable, given the tight stop and wider target.
📈 Chart Features
Highlighted Zones:
Resistance Zone (top purple area): A strong supply zone, where price reversed multiple times.
Support Zone (bottom purple area): Historical demand zone, previous price reactions.
Orange Circles: Represent key swing highs and lows (likely used to confirm the zones or a double/triple top/bottom pattern).
Moving Averages:
Red Line: Likely a shorter-period MA (e.g., 20 EMA).
Blue Line: Likely a longer-period MA (e.g., 50 or 200 EMA), often used for trend confirmation.
🧠 Interpretation
Price Action: The chart suggests the price recently hit a resistance zone and is expected to reverse.
Trade Bias: Bearish – expecting the market to drop from the resistance.
Indicators Support:
Price has rejected multiple times at the top.
Entry is slightly below resistance, confirming a potential reversal.
Targets align with support and past consolidation zones.

GBPUSD SHORT FORECAST Q2 W20 D16 Y25GBPUSD SHORT FORECAST Q2 W20 D16 Y25
Professional Risk Managers👋
Welcome back to another FRGNT chart update📈
Diving into some Forex setups using predominantly higher time frame order blocks alongside confirmation breaks of structure.
Let’s see what price action is telling us today!
💡Here are some trade confluences📝
✅Weekly order block rejection
✅Daily order block rejection
✅Intraday 15' order blocks
✅Tokyo ranges to be filled
🔑 Remember, to participate in trading comes always with a degree of risk, therefore as professional risk managers it remains vital that we stick to our risk management plan as well as our trading strategies.
📈The rest, we leave to the balance of probabilities.
💡Fail to plan. Plan to fail.
🏆It has always been that simple.
❤️Good luck with your trading journey, I shall see you at the very top.
🎯Trade consistent, FRGNT X

GBPUSD TRIPPLE TOP BEARISH PATTERNGBPUSD TRIPPLE TOP BEARISH PATTERN
Market Finds the Specific Adjustment where it can get possible values
This market moves towards bearish trend making a Tripple Top bearish pattern.
GBPUSD market want to reach some targets, resistance and support level.
1st Target Zone 1.31400
Final Target Zone 1.30000
Resistance level. 1.34300
Support level. 1.27600

#GBPUSD: Risk Entry Vs Safe Entry, Which One Would You Chose? The GBPUSD currency pair presents two promising opportunities for entry, potentially generating gains exceeding 500 pips. However, entering these markets carries a substantial risk of stop-loss hunting during the commencement of the week. Conversely, adopting a safe entry strategy offers a favourable chance for a bullish position.
We encourage you to share your thoughts and feedback on our ideas. ❤️🚀
Team Setupsfx_

GBPUSD Analysis🔁 GBPUSD update!
As our followers know,
we previously took a great profit from this level (see pinned idea below).💸
Now, that level is broken and we are patiently waiting for a pullback to enter a short trade.🔻
***If the price breaks above, we may switch to a buy setup — let’s wait for a clear signal!🕵️
For detailed entry points, trade management, and high-probability setups, follow the channel:
ForexCSP

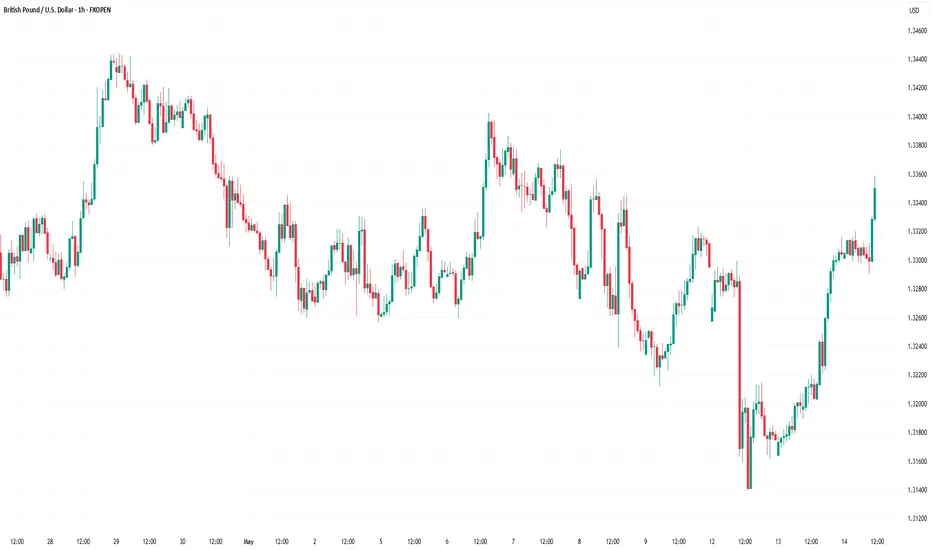
Market Analysis: GBP/USD Edges HigherMarket Analysis: GBP/USD Edges Higher
GBP/USD is attempting a fresh increase above the 1.3270 resistance.
Important Takeaways for GBP/USD Analysis Today
- The British Pound is attempting a fresh increase above 1.3250.
- There was a break above a key bearish trend line with resistance at 1.3270 on the hourly chart of GBP/USD at FXOpen.
GBP/USD Technical Analysis
On the hourly chart of GBP/USD at FXOpen, the pair declined after it failed to clear the 1.3440 resistance. As mentioned in the previous analysis, the British Pound traded below the 1.3200 support against the US Dollar.
Finally, the pair tested the 1.3140 zone and is currently attempting a fresh increase. The bulls were able to push the pair above the 50-hour simple moving average and 1.3215.
There was a break above a key bearish trend line with resistance at 1.3270. The pair surpassed the 50% Fib retracement level of the downward move from the 1.3402 swing high to the 1.3139 low. It is now showing positive signs above 1.3300.
On the upside, the GBP/USD chart indicates that the pair is facing resistance near 1.3340 and the 76.4% Fib retracement level of the downward move from the 1.3402 swing high to the 1.3139 low.
The next major resistance is near 1.3400. A close above the 1.3400 resistance zone could open the doors for a move toward 1.3440. Any more gains might send GBP/USD toward 1.3500.
On the downside, immediate support is near 1.3270. If there is a downside break below 1.3270, the pair could accelerate lower. The first major support is near the 1.3215 level and the 50-hour simple moving average.
The next key support is seen near 1.3140, below which the pair could test 1.3080. Any more losses could lead the pair toward the 1.3000 support.
This article represents the opinion of the Companies operating under the FXOpen brand only. It is not to be construed as an offer, solicitation, or recommendation with respect to products and services provided by the Companies operating under the FXOpen brand, nor is it to be considered financial advice.
GBPUSD SHORT FORECAST Q2 W20 D14 Y25GBPUSD SHORT FORECAST Q2 W20 D14 Y25
Professional Risk Managers👋
Welcome back to another FRGNT chart update📈
Diving into some Forex setups using predominantly higher time frame order blocks alongside confirmation breaks of structure.
Let’s see what price action is telling us today!
💡Here are some trade confluences📝
✅Weekly order block rejection
✅Daily order block rejection
✅Intraday 15' order blocks
✅Tokyo ranges to be filled
🔑 Remember, to participate in trading comes always with a degree of risk, therefore as professional risk managers it remains vital that we stick to our risk management plan as well as our trading strategies.
📈The rest, we leave to the balance of probabilities.
💡Fail to plan. Plan to fail.
🏆It has always been that simple.
❤️Good luck with your trading journey, I shall see you at the very top.
🎯Trade consistent, FRGNT X

GBPUSD: Strong Sell Momentum Built Up! What is next?GBPUSD is building strong sell momentum, increasing sell volume. At the same time, DXY is in correction mode, so keep that in mind. If DXY plummets again, it may invalidate our first entry. However, there’s a second entry that could be a safer zone for those looking for a stable entry.
There are three take profit targets that can be set according to your trading plan. This analysis doesn’t guarantee that the price will move as described.
Good luck and trade safely!
Thank you for your unwavering support! 😊
If you’d like to contribute, here are a few ways you can help us:
- Like our ideas
- Comment on our ideas
- Share our ideas
Team Setupsfx_
❤️🚀

GBPUSD INVERSE CUP AND HANDLE PATTERNTechnical Overview
Resistance Level: 1.34400
Support Level: 1.27500
Bearish Targets: 1.30200 and 1.28800
The resistance at 1.34400 represents the peak before the formation of the inverted cup, serving as a critical level where selling pressure may intensify. The support at 1.27500 aligns with the neckline of the pattern; a decisive break below this level would confirm the bearish breakout, potentially leading to the projected targets.
📉 Trading Strategy
Consider entering a short position upon a confirmed break below the 1.27500 support level, accompanied by increased trading volume to validate the breakout.
Place a stop-loss order above the handle's peak, near 1.34400, to protect against false breakouts and limit potential losses.

GBPUSD SHORT FORECAST Q2 W20 D12 Y25GBPUSD SHORT FORECAST Q2 W20 D12 Y25
Professional Risk Managers👋
Welcome back to another FRGNT chart update📈
Diving into some Forex setups using predominantly higher time frame order blocks alongside confirmation breaks of structure.
Let’s see what price action is telling us today!
💡Here are some trade confluences📝
✅Weekly order block rejection
✅Daily order block rejection
✅Intraday 15' order blocks
✅Tokyo ranges to be filled
🔑 Remember, to participate in trading comes always with a degree of risk, therefore as professional risk managers it remains vital that we stick to our risk management plan as well as our trading strategies.
📈The rest, we leave to the balance of probabilities.
💡Fail to plan. Plan to fail.
🏆It has always been that simple.
❤️Good luck with your trading journey, I shall see you at the very top.
🎯Trade consistent, FRGNT X

GBPUSD SHORT FORECAST Q2 W19 D9 Y25GBPUSD SHORT FORECAST Q2 W19 D9 Y25
Professional Risk Managers👋
Welcome back to another FRGNT chart update📈
Diving into some Forex setups using predominantly higher time frame order blocks alongside confirmation breaks of structure.
Let’s see what price action is telling us today!
💡Here are some trade confluences📝
✅Weekly order block rejection
✅Daily order block rejection
✅Intraday 15' order blocks
✅Tokyo ranges to be filled
🔑 Remember, to participate in trading comes always with a degree of risk, therefore as professional risk managers it remains vital that we stick to our risk management plan as well as our trading strategies.
📈The rest, we leave to the balance of probabilities.
💡Fail to plan. Plan to fail.
🏆It has always been that simple.
❤️Good luck with your trading journey, I shall see you at the very top.
🎯Trade consistent, FRGNT X

GBPUSD STRONG DOWNTRND PATTERNTechnical Analysis
1. Trend Overview:
The GBP/USD pair is in a strong bearish trend, confirmed by:
Price consistently forming lower highs and lower lows
Breakdown of key support zones(1.3200), turning them into new resistance (especially 1.34400)
Momentum oscillators and moving averages showing sustained downward pressure

GBPUSD SHORT FORECAST Q2 W19 D8 Y25GBPUSD SHORT FORECAST Q2 W19 D8 Y25
Professional Risk Managers👋
Welcome back to another FRGNT chart update📈
Diving into some Forex setups using predominantly higher time frame order blocks alongside confirmation breaks of structure.
Let’s see what price action is telling us today!
💡Here are some trade confluences📝
✅Weekly order block rejection
✅Daily order block rejection
✅Intraday 15' order blocks
✅Tokyo ranges to be filled
🔑 Remember, to participate in trading comes always with a degree of risk, therefore as professional risk managers it remains vital that we stick to our risk management plan as well as our trading strategies.
📈The rest, we leave to the balance of probabilities.
💡Fail to plan. Plan to fail.
🏆It has always been that simple.
❤️Good luck with your trading journey, I shall see you at the very top.
🎯Trade consistent, FRGNT X

GBPUSD SHORT FORECAST Q2 W19 D7 Y25GBPUSD SHORT FORECAST Q2 W19 D7 Y25
Professional Risk Managers👋
Welcome back to another FRGNT chart update📈
Diving into some Forex setups using predominantly higher time frame order blocks alongside confirmation breaks of structure.
Let’s see what price action is telling us today!
💡Here are some trade confluences📝
✅Weekly order block rejection
✅Daily order block rejection
✅Intraday 15' order blocks
✅Tokyo ranges to be filled
🔑 Remember, to participate in trading comes always with a degree of risk, therefore as professional risk managers it remains vital that we stick to our risk management plan as well as our trading strategies.
📈The rest, we leave to the balance of probabilities.
💡Fail to plan. Plan to fail.
🏆It has always been that simple.
❤️Good luck with your trading journey, I shall see you at the very top.
🎯Trade consistent, FRGNT X

GBP/USD Short Trade Setup: Reversal from 1.34370 with Target at Entry Point:
Marked at 1.34370, where the analyst anticipates a reversal or price rejection.
Stop Loss:
Positioned above at 1.34975, covering a 2.62% risk margin. This is a protective level in case the price moves against the trade.
Target (Take Profit):
Set at 1.31015, just above a strong support zone around 1.30818. This is where the analyst expects the price to eventually fall.
Resistance Point:
Noted around 1.33007 – 1.32859, acting as an intermediate level of interest and possible price reaction zone.

GBP/USD "The Cable" Forex Bank Heist Plan (Scalping / Day Trade)🌟Hi! Hola! Ola! Bonjour! Hallo! Marhaba!🌟
Dear Money Makers & Robbers, 🤑💰✈️
Based on 🔥Thief Trading style technical and fundamental analysis🔥, here is our master plan to heist the GBP/USD "The Cable" Forex Bank. Please adhere to the strategy I've outlined in the chart, which emphasizes short entry. Our aim is the high-risk Green Zone. Risky level, oversold market, consolidation, trend reversal, trap at the level where traders and bullish robbers are stronger. 🏆💸Book Profits Be wealthy and safe trade.💪🏆🎉
Entry 📈 : "The heist is on! Wait for the breakout (1.28877) then make your move - Bearish profits await!"
however I advise placing Sell Stop Orders below the breakout MA or Place Sell limit orders within a 15 or 30 minute timeframe. Entry from the most recent or closest low or high level should be in retest. I Highly recommended you to put alert in your chart.
📌I strongly advise you to set an "alert (Alarm)" on your chart so you can see when the breakout entry occurs.
Stop Loss 🛑: Thief SL placed at 1.29600 (swing / Day Trade Basis) Using the 2H period, the recent / swing high or low level.
SL is based on your risk of the trade, lot size and how many multiple orders you have to take.
Target 🎯: 1.27800 (or) Escape Before the Target
🧲Scalpers, take note 👀 : only scalp on the Short side. If you have a lot of money, you can go straight away; if not, you can join swing traders and carry out the robbery plan. Use trailing SL to safeguard your money 💰.
GBP/USD "The Cable" Forex Bank Heist Plan (Scalping / Day Trade) is currently experiencing a bearishness,., driven by several key factors.
📰🗞️Get & Read the Fundamental, Macro, COT Report, Quantitative Analysis, Sentimental Outlook, Intermarket Analysis, Future trend targets.. go ahead to check 👉👉👉
⚠️Trading Alert : News Releases and Position Management 📰 🗞️ 🚫🚏
As a reminder, news releases can have a significant impact on market prices and volatility. To minimize potential losses and protect your running positions,
we recommend the following:
Avoid taking new trades during news releases
Use trailing stop-loss orders to protect your running positions and lock in profits
💖Supporting our robbery plan 💥Hit the Boost Button💥 will enable us to effortlessly make and steal money 💰💵. Boost the strength of our robbery team. Every day in this market make money with ease by using the Thief Trading Style.🏆💪🤝❤️🎉🚀
I'll see you soon with another heist plan, so stay tuned 🤑🐱👤🤗🤩

GBP/USD Buy from 2hr demand zone?This week, my analysis for GU focuses on a potential buy opportunity from the 2H demand zone. Although this zone is still quite a distance from current price action, I’m patiently waiting to see which side of liquidity gets taken first — that will help highlight a more immediate area of interest.
Given the recent bearish movement, I’m anticipating a possible break of structure to the downside, targeting the underlying Asia lows. This move could create a new supply zone, which may present a more valid setup in the short term.
However, if price maintains its current trajectory, I’m also eyeing the 13H supply zone, which would offer a strong POI for future sell opportunities after a bullish correction.
Confluences for GU Buys:
- Price is approaching a 2H demand zone.
- Market has been bearish, suggesting a correction may be due.
- DXY analysis aligns with a potential GU recovery.
- Liquidity buildup points toward a possible retracement to the 13H supply zone.
P.S. If the week starts with a bullish move, that could offer a better setup for shorts later on as price approaches the higher supply zone. Stay alert and flexible with your setups — wishing everyone a strong and disciplined trading week!
