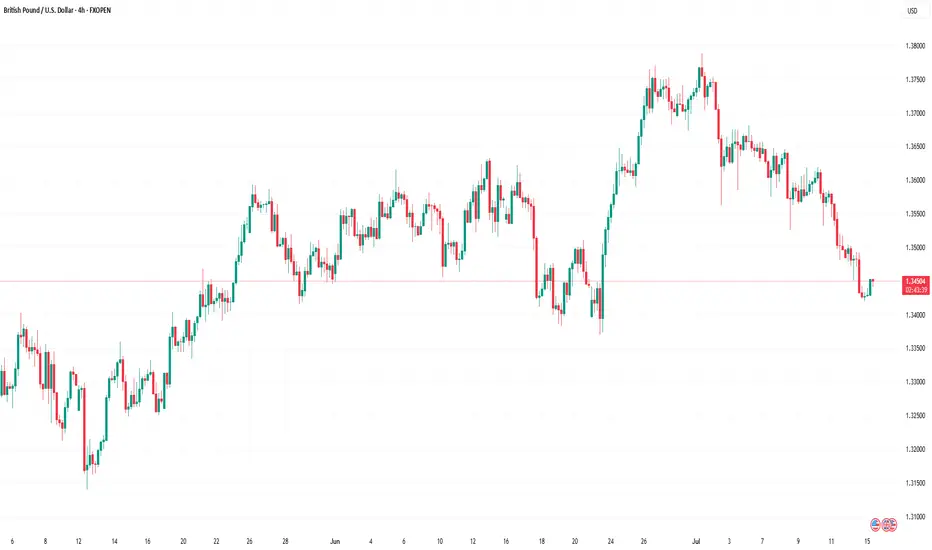
GBP/USD 4H Bearish Reversal Setup. GBP/USD 4H Chart Analysis (July 24, 2025):
Price is rejecting resistance near 1.35709, forming a bearish setup. A short position is highlighted with entry around 1.35067, stop loss above resistance, and target near the 1.33786 support zone. Bears aim for continuation toward 1.33745.
Gbpusdupdate

Market Analysis: GBP/USD Dips FurtherMarket Analysis: GBP/USD Dips Further
GBP/USD started a downside correction from the 1.3620 zone.
Important Takeaways for GBP/USD Analysis Today
- The British Pound started a fresh decline and settled below the 1.3500 zone.
- There is a connecting bullish trend line forming with support at 1.3415 on the hourly chart of GBP/USD at FXOpen.
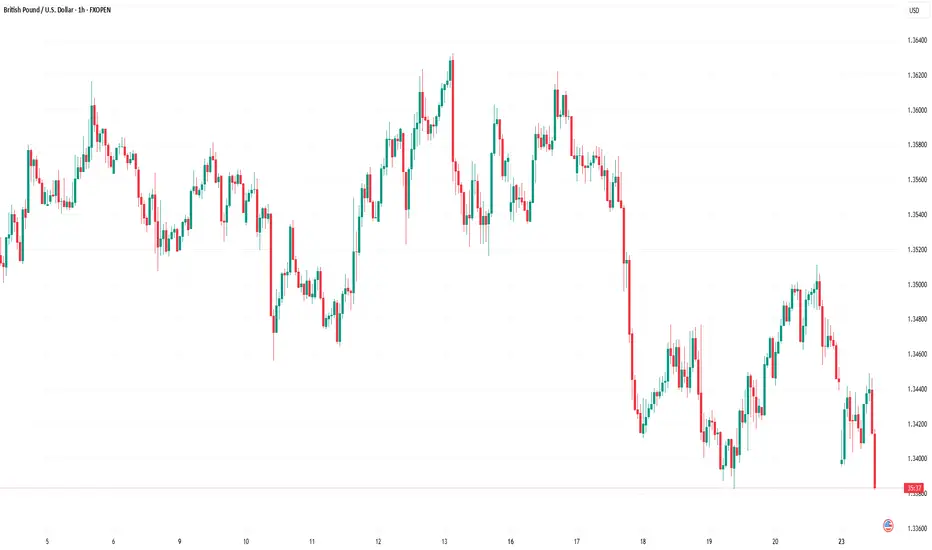
GBP/USD Technical Analysis
On the hourly chart of GBP/USD at FXOpen, the pair struggled above the 1.3600 zone. The British Pound started a fresh decline below the 1.3550 pivot level against the US Dollar, as discussed in the previous analysis.
The pair dipped below the 1.3500 and 1.3450 levels. A low was formed at 1.3364 and the pair is now consolidating losses. On the upside, it is facing resistance near the 1.3475 level. The next key resistance is near 1.3490 and the 50% Fib retracement level of the downward move from the 1.3619 swing high to the 1.3364 low.
An upside break above the 1.3490 zone could send the pair toward 1.3520 and the 61.8% Fib retracement level.
More gains might open the doors for a test of 1.3620. If there is another decline, the pair could find support near the 1.3415 level and a connecting bullish trend line. The first major support sits near the 1.3365 zone.
The next major support is 1.3350. If there is a break below 1.3350, the pair could extend the decline. The next key support is near the 1.3320 level. Any more losses might call for a test of 1.3250.
This article represents the opinion of the Companies operating under the FXOpen brand only. It is not to be construed as an offer, solicitation, or recommendation with respect to products and services provided by the Companies operating under the FXOpen brand, nor is it to be considered financial advice.

GBP/USD Bullish Setup: Targeting 1.35633 and 1.36667This 5-hour chart for GBP/USD shows a bullish trend within an ascending channel. The chart highlights two target zones: the first at 1.35633 and the second at 1.36667. A buy signal is indicated near the 1.34080 support zone, suggesting potential upward movement toward the marked resistance targets.

GBP/USD Rate Falls to Key Support LevelGBP/USD Rate Falls to Key Support Level
As of today, the GBP/USD chart indicates that the British pound has declined by more than 2% against the US dollar since the beginning of July. Notably, the pace of the decline accelerated on Friday and continued into Monday.
According to Reuters, the pound is under pressure due to market concerns over a potential economic slowdown amid an escalating trade war. Last week’s data confirmed a contraction in UK GDP, which could have far-reaching implications. In this context, criticism of the UK government’s failure to reduce public spending is becoming more pronounced.
What’s next for GBP/USD?
Technical Analysis of the GBP/USD Chart
From a bullish perspective, it is worth noting that the pair has fallen to a significant support level around 1.3425. This level previously acted as resistance in the spring, but after a breakout, it has now turned into support (as indicated by arrows on the chart). Additionally, the RSI indicator shows strong oversold conditions, which suggests a potential short-term rebound.
From a bearish standpoint, it is concerning that the sharp rally from point A to point B has been entirely erased by the July decline. This indicates that despite significant gains by the bulls, they failed to hold them—casting doubt on GBP/USD's ability to sustain growth in the medium term.
Ongoing pressure may lead to an attempt by bears to push GBP/USD below the June low at point A. However, it is also possible that bearish momentum will weaken thereafter, potentially leading to a recovery within the developing downward channel (marked in red).
This article represents the opinion of the Companies operating under the FXOpen brand only. It is not to be construed as an offer, solicitation, or recommendation with respect to products and services provided by the Companies operating under the FXOpen brand, nor is it to be considered financial advice.
GBP/USD Outlook: Can Buyers Step Back In?Hi everyone,
GBP/USD continues to consolidate below the 1.36200 level, with multiple failed attempts to break higher confirming this area as firm resistance for now. Following the rejection, price moved lower into the 1.35300–1.34600 demand zone, where we’re watching closely for signs of renewed buying interest.
This area has previously acted as a support base, and a reaction here could set the stage for another push higher. However, if buyers fail to step in, there is scope for a deeper retracement before the next attempt to reclaim resistance. We’ll be monitoring the price action closely to see which scenario plays out.
A drop into this area was highlighted as the more probable short‑term path, and we’re now looking for GBP/USD to find support in this region; and more importantly, to hold above the 1.33800 level to form the base for another push higher.
As previously noted, a decisive break above 1.37500 would renew our expectation for further upside, with the next key target around 1.38400. We'll be monitoring price action closely to see how it unfolds.
We’ll continue to provide updates on the projected path for GBP/USD as price approaches this target.
The longer-term outlook remains bullish, and we expect the rally to continue extending further from the 1.20991 January low towards 1.40000 and 1.417000.
We’ll be keeping you updated throughout the week with how we’re managing our active ideas. Thanks again for all the likes/boosts, comments and follows — we appreciate the support!
All the best for the week ahead. Trade safe.
BluetonaFX

Intraday Drop into Support Zone — Can GBP/USD Bounce?Hi everyone,
GBP/USD continues to consolidate below the 1.36850 level. Price failed to break above and moved lower into the 1.35300–1.34600 zone, providing us with a clean intraday trade setup.
A drop into this area was highlighted as the more probable short‑term path, and we’re now looking for GBP/USD to find support in this region; and more importantly, to hold above the 1.33800 level to form the base for another push higher.
As previously noted, a decisive break above 1.37500 would renew our expectation for further upside, with the next key target around 1.38400. We'll be monitoring price action closely to see how it unfolds.
We’ll continue to provide updates on the projected path for GBP/USD as price approaches this target.
The longer-term outlook remains bullish, and we expect the rally to continue extending further from the 1.20991 January low towards 1.40000 and 1.417000.
We’ll be keeping you updated throughout the week with how we’re managing our active ideas. Thanks again for all the likes/boosts, comments and follows — we appreciate the support!
All the best for the week ahead. Trade safe.
BluetonaFX

Market Analysis: GBP/USD DipsMarket Analysis: GBP/USD Dips
GBP/USD failed to climb above 1.3800 and corrected some gains.
Important Takeaways for GBP/USD Analysis Today
- The British Pound is showing bearish signs below the 1.3700 support against the US dollar.
- There is a key bearish trend line forming with resistance near 1.3650 on the hourly chart of GBP/USD at FXOpen.
GBP/USD Technical Analysis
On the hourly chart of GBP/USD at FXOpen, the pair failed to stay above the 1.3750 pivot level. As a result, the British Pound started a fresh decline below 1.3720 against the US Dollar.
There was a clear move below 1.3700 and the 50-hour simple moving average. The bears pushed the pair below 1.3650. Finally, there was a spike below the 1.3600 support zone. A low was formed near 1.3562 and the pair is now consolidating losses.
There was a minor move above the 1.3615 level. On the upside, the GBP/USD chart indicates that the pair is facing resistance near the 1.3650 level. There is also a key bearish trend line forming with resistance near 1.3650.
The next major resistance is near the 50% Fib retracement level of the downward move from the 1.3788 swing high to the 1.3562 low at 1.3675. A close above the 1.3670 resistance zone could open the doors for a move toward the 1.3700 zone. The 61.8% Fib retracement level is at 1.3700. Any more gains might send GBP/USD toward 1.3790.
On the downside, there is a key support forming near 1.3615. If there is a downside break below the 1.3615 support, the pair could accelerate lower. The next major support is near the 1.3560 zone, below which the pair could test 1.3500. Any more losses could lead the pair toward the 1.3440 support.
This article represents the opinion of the Companies operating under the FXOpen brand only. It is not to be construed as an offer, solicitation, or recommendation with respect to products and services provided by the Companies operating under the FXOpen brand, nor is it to be considered financial advice.

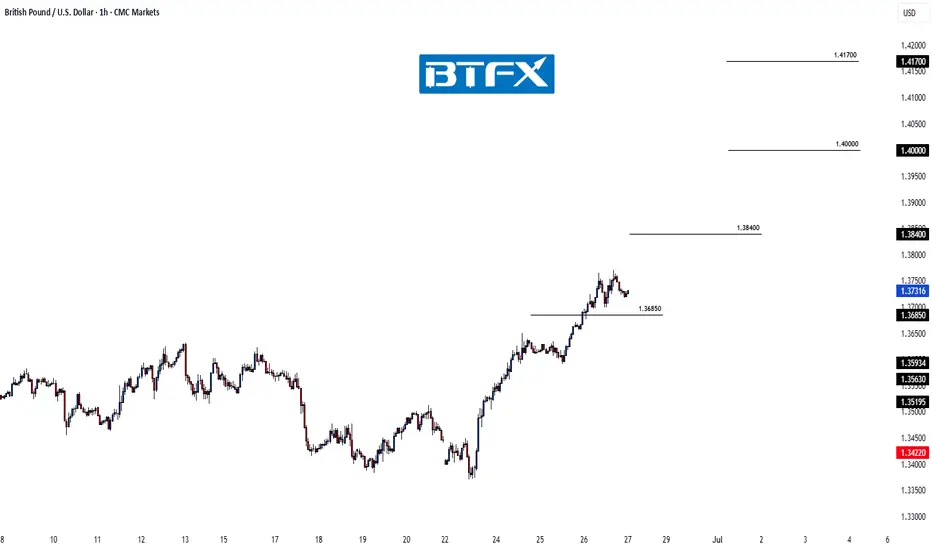
GBP/USD Pulls Back After Rejection – Buyers Eye Lower LevelsHi everyone,
GBP/USD failed to break above the 1.37500 level and saw a rejection from that resistance, dropping further below the 1.36850 support. Since then, price has consolidated and ranged beneath this level.
Looking ahead, if price remains within this range, we anticipate a move lower to find buying interest between the 1.35300 and 1.34600 levels, which could set the stage for another push higher.
As previously noted, a decisive break above 1.37500 would renew our expectation for further upside, with the next key target around 1.38400. We'll be monitoring price action closely to see how it unfolds.
We’ll continue to provide updates on the projected path for GBP/USD as price approaches this target.
The longer-term outlook remains bullish, and we expect the rally to continue extending further from the 1.20991 January low towards 1.40000 and 1.417000.
We’ll be keeping you updated throughout the week with how we’re managing our active ideas. Thanks again for all the likes/boosts, comments and follows — we appreciate the support!
All the best for the week ahead. Trade safe.
BluetonaFX

GBP/USD Made A Double Top Pattern , Short After Breakout ? Here is my opinion on GBP/USD 4H Chart , we have a reversal pattern ( Double Top ) but until now we have not a closure below neckline ,so i`m waiting for 4H Closure below it to confirm the pattern and hen we can sell it , if we have not a closure below then this idea will not be valid .

GBP/USD Rally in Full Swing – Bullish Targets AheadHi everyone,
Price achieved the 1.36850 having found support near the 1.33800 level.
As previously noted, the clearance of these levels strengthens our expectation for further upside, with the next key level of interest around 1.38400. We'll be watching to see how price action develops from here.
We’ll continue to provide updates on the projected path for GBP/USD as price approaches this target.
The longer-term outlook remains bullish, and we expect the rally to continue extending further from the 1.20991 January low towards 1.40000 and 1.417000.
We’ll be keeping you updated throughout the week with how we’re managing our active ideas. Thanks again for all the likes/boosts, comments and follows — we appreciate the support!
All the best for the week ahead. Trade safe.
BluetonaFX
GBP/USD Breakout Done , Best Place To Get 150 Pips Clear !Here is my opinion on GBP/USD On 2H T.F , We have a very good breakout now clear not as the old one and we have a very good bearish price action , so i think it will be a good entry if the price go back to retest my res with the news today and give us a good touch and go to downside , and also we might see a random move and fake wicks to take all stop losses before going down or even back to upside so be careful today and use a good risk , i`m waiting the price to back to retest the broken support and new res and then i will enter a sell trade with a very small lot size .

Market Analysis: GBP/USD Dips Below SupportMarket Analysis: GBP/USD Dips Below Support
GBP/USD started a fresh decline below the 1.3620 zone.
Important Takeaways for GBP/USD Analysis Today
- The British Pound started another decline from the 1.3620 resistance zone.
- There was a break below a connecting bullish trend line with support at 1.3460 on the hourly chart of GBP/USD at FXOpen.
GBP/USD Technical Analysis
On the hourly chart of GBP/USD at FXOpen, the pair struggled to continue higher above the 1.3620 resistance zone. The British Pound started a fresh decline and traded below the 1.3550 support zone against the US Dollar, as discussed in the previous analysis.
The pair even traded below 1.3500 and the 50-hour simple moving average. Finally, the bulls appeared near the 1.3380 level. There was a recovery wave above the 1.3450 level and the 23.6% Fib retracement level of the downward move from the 1.3622 swing high to the 1.3382 low.
However, the bears were active near the 1.3500 zone and the 50% Fib retracement level. As a result, there was a fresh bearish reaction below a connecting bullish trend line with support at 1.3460.
Initial support on the GBP/USD chart sits at 1.3380. The next major support is at 1.3350, below which there is a risk of another sharp decline. In the stated case, the pair could drop toward 1.3200.
Immediate resistance on the upside is near 1.3440. The first major resistance is near the 1.3500 zone. The main hurdle sits at 1.3530. A close above the 1.3530 resistance might spark a steady upward move. The next major resistance is near the 1.3565 zone. Any more gains could lead the pair toward the 1.3620 resistance in the near term.
This article represents the opinion of the Companies operating under the FXOpen brand only. It is not to be construed as an offer, solicitation, or recommendation with respect to products and services provided by the Companies operating under the FXOpen brand, nor is it to be considered financial advice.
GBP/USD Hits June LowGBP/USD Hits June Low
As the GBP/USD chart shows, the pair dropped sharply last night, falling below the 1.34170 level. This move marked the lowest point for the pound against the dollar since the beginning of June.
One of the main drivers behind this decline is the strengthening of the US dollar, which is attracting market participants amid heightened geopolitical tensions and a potential escalation of military conflict between Iran and Israel, involving US armed forces. According to the latest reports, Donald Trump has warned Tehran that US patience is wearing thin.
Today, however, the pound has seen a slight rebound, supported by the release of the UK Consumer Price Index (CPI). While the data confirmed that inflation is easing, the pace of decline is slower than expected. This may reduce the likelihood of interest rate cuts by the Bank of England – which in turn has boosted the pound’s value.
What could happen next?
Technical Analysis of the GBP/USD Chart
Since the end of May, price fluctuations have formed an ascending channel (shown in blue), with bulls making several attempts to break the resistance level at 1.3600 – so far, without much success.
The sharp decline from point A to B suggests that the bears have seized the initiative, with the pair rebounding from the lower boundary of the blue channel.
GBP/USD traders may:
→ interpret the bounce from the lower blue boundary as an upward correction following a sharp fall;
→ use Fibonacci retracement levels to estimate potential upside. In such cases, particular attention is typically given to the 0.5–0.618 zone (highlighted in orange). Here, it aligns with the 1.3526 level, which acted as support on 12–13 June, but may now serve as resistance after being breached.
This article represents the opinion of the Companies operating under the FXOpen brand only. It is not to be construed as an offer, solicitation, or recommendation with respect to products and services provided by the Companies operating under the FXOpen brand, nor is it to be considered financial advice.

GBPUSD Edges HigherGBPUSD Edges Higher
GBP/USD is attempting a fresh increase above the 1.3500 resistance.
Important Takeaways for GBP/USD Analysis Today
- The British Pound is attempting a fresh increase above 1.3515.
- There was a break above a key bearish trend line with resistance at 1.3535 on the hourly chart of GBP/USD at FXOpen.
GBP/USD Technical Analysis
On the hourly chart of GBP/USD at FXOpen, the pair declined after it failed to clear the 1.3615 resistance. The British Pound even traded below the 1.3575 support against the US Dollar.
Finally, the pair tested the 1.3500 zone and is currently attempting a fresh increase. The bulls were able to push the pair above the 50-hour simple moving average and 1.3540. There was a break above a key bearish trend line with resistance at 1.3535.
The pair tested the 50% Fib retracement level of the downward move from the 1.3616 swing high to the 1.3507 low. It is now showing positive signs above 1.3540.
On the upside, the GBP/USD chart indicates that the pair is facing resistance near 1.3575 and the 61.8% Fib retracement level of the downward move from the 1.3616 swing high to the 1.3507 low.
The next major resistance is near 1.3590. A close above the 1.3590 resistance zone could open the doors for a move toward 1.3615. Any more gains might send GBP/USD toward 1.3650.
On the downside, immediate support is near the 1.3515. If there is a downside break below 1.3515, the pair could accelerate lower. The first major support is near the 1.3500 level. The next key support is seen near 1.3450, below which the pair could test 1.3420. Any more losses could lead the pair toward the 1.3350 support.
This article represents the opinion of the Companies operating under the FXOpen brand only. It is not to be construed as an offer, solicitation, or recommendation with respect to products and services provided by the Companies operating under the FXOpen brand, nor is it to be considered financial advice.

GBP/USD Analysis: Price Searching for SupportGBP/USD Analysis: Price Searching for Support
In the second half of May, the British pound showed notable strength: from its 12 May low, GBP/USD climbed to a peak on 26 May — marking its highest level in over three years.
Demand for the pound has been driven by several factors:
→ A surge in inflation. CPI data released last Wednesday came in above expectations. As a result, market participants interpreted this as a reason for the Bank of England to remain cautious about cutting interest rates. Holding rates at elevated levels is generally considered bullish for the pound.
→ The pound’s relative resilience amid trade tensions, particularly following a newly signed agreement with the US, as well as strengthening trade ties between the UK and the EU.
Can the pound continue to rise? The GBP/USD chart offers reasons for doubt.
Technical Analysis of the GBP/USD Chart
Recent price movements have formed an ascending channel (outlined in blue), and earlier this week, demand was so strong that the pair briefly moved above the upper boundary. But what happened next?
That strong buying momentum appears to have faded — resulting in a sequence of lower highs (A→B→C→D), suggesting that the market may be searching for a foothold. Today’s bounce (highlighted by the arrow) hints that such a foothold may have been found. But how reliable is it? And can the uptrend be resumed?
→ From a bullish perspective: Support may be provided by the lower boundary of the channel, reinforced by the 1.345 level.
→ From a bearish perspective: The 1.352 level is acting as resistance, further strengthened by the median line.
It is possible that the area marked by lower highs (A→B→C→D) could ultimately prove to be an insurmountable barrier for the developing uptrend on the GBP/USD chart.
This article represents the opinion of the Companies operating under the FXOpen brand only. It is not to be construed as an offer, solicitation, or recommendation with respect to products and services provided by the Companies operating under the FXOpen brand, nor is it to be considered financial advice.

Market Analysis: GBP/USD RalliesMarket Analysis: GBP/USD Rallies
GBP/USD started a fresh increase above the 1.3520 zone.
Important Takeaways for GBP/USD Analysis Today
- The British Pound is eyeing more gains above the 1.3600 resistance.
- There is a key bullish trend line forming with support at 1.3540 on the hourly chart of GBP/USD at FXOpen.
GBP/USD Technical Analysis
On the hourly chart of GBP/USD at FXOpen, the pair formed a base above the 1.3350 level. The British Pound started a steady increase above the 1.3450 resistance zone against the US Dollar, as discussed in the previous analysis.
The pair gained strength above the 1.3500 level. The bulls even pushed the pair above the 1.3550 level and the 50-hour simple moving average. The pair tested the 1.3585 zone and is currently consolidating gains.
GBP/USD is stable above the 23.6% Fib retracement level of the upward move from the 1.3390 swing low to the 1.3586 high. There is also a key bullish trend line forming with support at 1.3540.
It seems like the bulls might aim for more gains. The RSI moved above the 60 level on the GBP/USD chart and the pair is now approaching a major hurdle at 1.3600.
An upside break above the 1.3600 zone could send the pair toward 1.3650. Any more gains might open the doors for a test of 1.3720. If there is a downside correction, immediate support is near the 1.3540 level and the trend line.
The first major support sits near the 50% Fib retracement level of the upward move from the 1.3390 swing low to the 1.3586 high at 1.3485. The next major support is 1.3450. If there is a break below 1.3450, the pair could extend the decline. The next key support is near the 1.3390 level. Any more losses might call for a test of the 1.3345 support.
This article represents the opinion of the Companies operating under the FXOpen brand only. It is not to be construed as an offer, solicitation, or recommendation with respect to products and services provided by the Companies operating under the FXOpen brand, nor is it to be considered financial advice.

Market Analysis: GBP/USD Edges HigherMarket Analysis: GBP/USD Edges Higher
GBP/USD is attempting a fresh increase above the 1.3270 resistance.
Important Takeaways for GBP/USD Analysis Today
- The British Pound is attempting a fresh increase above 1.3250.
- There was a break above a key bearish trend line with resistance at 1.3270 on the hourly chart of GBP/USD at FXOpen.
GBP/USD Technical Analysis
On the hourly chart of GBP/USD at FXOpen, the pair declined after it failed to clear the 1.3440 resistance. As mentioned in the previous analysis, the British Pound traded below the 1.3200 support against the US Dollar.
Finally, the pair tested the 1.3140 zone and is currently attempting a fresh increase. The bulls were able to push the pair above the 50-hour simple moving average and 1.3215.
There was a break above a key bearish trend line with resistance at 1.3270. The pair surpassed the 50% Fib retracement level of the downward move from the 1.3402 swing high to the 1.3139 low. It is now showing positive signs above 1.3300.
On the upside, the GBP/USD chart indicates that the pair is facing resistance near 1.3340 and the 76.4% Fib retracement level of the downward move from the 1.3402 swing high to the 1.3139 low.
The next major resistance is near 1.3400. A close above the 1.3400 resistance zone could open the doors for a move toward 1.3440. Any more gains might send GBP/USD toward 1.3500.
On the downside, immediate support is near 1.3270. If there is a downside break below 1.3270, the pair could accelerate lower. The first major support is near the 1.3215 level and the 50-hour simple moving average.
The next key support is seen near 1.3140, below which the pair could test 1.3080. Any more losses could lead the pair toward the 1.3000 support.
This article represents the opinion of the Companies operating under the FXOpen brand only. It is not to be construed as an offer, solicitation, or recommendation with respect to products and services provided by the Companies operating under the FXOpen brand, nor is it to be considered financial advice.
GBP/USD "The Cable" Forex Bank Heist Plan (Scalping / Day Trade)🌟Hi! Hola! Ola! Bonjour! Hallo! Marhaba!🌟
Dear Money Makers & Robbers, 🤑💰✈️
Based on 🔥Thief Trading style technical and fundamental analysis🔥, here is our master plan to heist the GBP/USD "The Cable" Forex Bank. Please adhere to the strategy I've outlined in the chart, which emphasizes short entry. Our aim is the high-risk Green Zone. Risky level, oversold market, consolidation, trend reversal, trap at the level where traders and bullish robbers are stronger. 🏆💸Book Profits Be wealthy and safe trade.💪🏆🎉
Entry 📈 : "The heist is on! Wait for the breakout (1.28877) then make your move - Bearish profits await!"
however I advise placing Sell Stop Orders below the breakout MA or Place Sell limit orders within a 15 or 30 minute timeframe. Entry from the most recent or closest low or high level should be in retest. I Highly recommended you to put alert in your chart.
📌I strongly advise you to set an "alert (Alarm)" on your chart so you can see when the breakout entry occurs.
Stop Loss 🛑: Thief SL placed at 1.29600 (swing / Day Trade Basis) Using the 2H period, the recent / swing high or low level.
SL is based on your risk of the trade, lot size and how many multiple orders you have to take.
Target 🎯: 1.27800 (or) Escape Before the Target
🧲Scalpers, take note 👀 : only scalp on the Short side. If you have a lot of money, you can go straight away; if not, you can join swing traders and carry out the robbery plan. Use trailing SL to safeguard your money 💰.
GBP/USD "The Cable" Forex Bank Heist Plan (Scalping / Day Trade) is currently experiencing a bearishness,., driven by several key factors.
📰🗞️Get & Read the Fundamental, Macro, COT Report, Quantitative Analysis, Sentimental Outlook, Intermarket Analysis, Future trend targets.. go ahead to check 👉👉👉
⚠️Trading Alert : News Releases and Position Management 📰 🗞️ 🚫🚏
As a reminder, news releases can have a significant impact on market prices and volatility. To minimize potential losses and protect your running positions,
we recommend the following:
Avoid taking new trades during news releases
Use trailing stop-loss orders to protect your running positions and lock in profits
💖Supporting our robbery plan 💥Hit the Boost Button💥 will enable us to effortlessly make and steal money 💰💵. Boost the strength of our robbery team. Every day in this market make money with ease by using the Thief Trading Style.🏆💪🤝❤️🎉🚀
I'll see you soon with another heist plan, so stay tuned 🤑🐱👤🤗🤩

Market Analysis: GBP/USD Corrects GainsMarket Analysis: GBP/USD Corrects Gains
GBP/USD started a downside correction from the 1.3450 zone.
Important Takeaways for GBP/USD Analysis Today
- The British Pound rallied above 1.3200 and 1.3320 before the bears appeared.
- There is a key bearish trend line forming with resistance at 1.3375 on the hourly chart of GBP/USD at FXOpen.
GBP/USD Technical Analysis
On the hourly chart of GBP/USD at FXOpen, the pair formed a base above the 1.3200 level. The British Pound started a steady increase above the 1.3320 resistance zone against the US Dollar, as discussed in the previous analysis.
The pair even cleared 1.3400 before the bears appeared. A high was formed at 1.3443 before there was a downside correction. There was a move below the 1.3400 and 1.3350 levels.
A low was formed at 1.3301 and the pair is now consolidating losses. On the upside, the pair is facing resistance near the 1.3335 level and the 23.6% Fib retracement level of the downward move from the 1.3443 swing high to the 1.3301 low.
The next key resistance near the 1.3375 level. There is also a key bearish trend line forming with resistance at 1.3375. The trend line is near the 50% Fib retracement level of the downward move from the 1.3443 swing high to the 1.3301 low.
An upside break above the 1.3375 zone could send the pair toward 1.3410. Any more gains might open the doors for a test of 1.3445.
If there is another decline, the pair could find support near the 1.3300 level. The first major support sits near the 1.3245 zone. The next major support is 1.3200. If there is a break below 1.3200, the pair could extend the decline. The next key support is near the 1.3150 level. Any more losses might call for a test of the 1.3080 support.
This article represents the opinion of the Companies operating under the FXOpen brand only. It is not to be construed as an offer, solicitation, or recommendation with respect to products and services provided by the Companies operating under the FXOpen brand, nor is it to be considered financial advice.

Market Analysis: GBP/USD Rockets HigherMarket Analysis: GBP/USD Rockets Higher
GBP/USD is gaining pace above the 1.3220 resistance.
Important Takeaways for GBP/USD Analysis Today
- The British Pound is attempting a fresh increase above 1.3220.
- There is a key bullish trend line forming with support near 1.3245 on the hourly chart of GBP/USD at FXOpen.
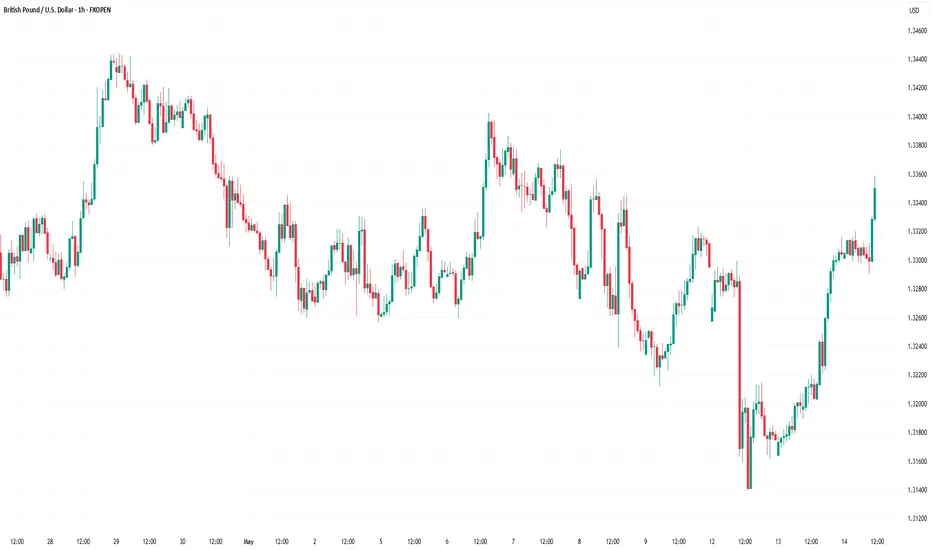
GBP/USD Technical Analysis
On the hourly chart of GBP/USD at FXOpen, the pair remained well-bid above the 1.2850 level. The British Pound started a decent increase above the 1.3000 zone against the US Dollar.
The bulls were able to push the pair above the 50-hour simple moving average and 1.3150. The pair even climbed above 1.3200 and traded as high as 1.3263. It is now consolidating gains and trading well above the 23.6% Fib retracement level of the upward move from the 1.3030 swing low to the 1.3263 high.
On the upside, the GBP/USD chart indicates that the pair is facing resistance near 1.3260. The next major resistance is near 1.3320. A close above the 1.3320 resistance zone could open the doors for a move toward 1.3450.
Any more gains might send GBP/USD toward 1.3500. On the downside, there is a key support forming near a bullish trend line at 1.3245.
If there is a downside break below 1.3245, the pair could accelerate lower. The next major support is at 1.3145. It is close to the 50% Fib retracement level of the upward move from the 1.3030 swing low to the 1.3263 high.
The next key support is seen near 1.3030, below which the pair could test 1.2860. Any more losses could lead the pair toward the 1.2745 support.
This article represents the opinion of the Companies operating under the FXOpen brand only. It is not to be construed as an offer, solicitation, or recommendation with respect to products and services provided by the Companies operating under the FXOpen brand, nor is it to be considered financial advice.

GBP/USD At Interesting Area To Sell , Should We Sell Now ?Here is my Opinion About GBP/USD , I Have an old res and the price respect it 100% and gave us a very good bearish P.A , So i think we have 2 places to sell it , first one if the price back to retest my res level 1.31750 and if the price give us a good bearish price action we can enter and targeting 200 pips . if the price didn`t back to retest the res level we can wait he price to close below support with 4h candle and then we can enter a sell trade with the same target .

WHY GBPUSD BULLISH ?? DETAILED TECHNICAL AND FUNDAMENTALSThe GBP/USD currency pair is currently trading around 1.2950, exhibiting a bullish pennant pattern—a continuation signal that often precedes further upward movement. This pattern forms after a strong price surge, followed by a consolidation phase marked by converging trendlines. A breakout above the pennant's upper boundary could propel the pair toward the target price of 1.3100, indicating a potential gain of 150 pips.
Fundamentally, the British pound has demonstrated resilience, bolstered by the UK's robust economic performance and the Bank of England's measured approach to interest rate adjustments. Recent data indicates that the UK economy has maintained steady growth, with inflation rates aligning closely with the central bank's targets. Conversely, the US dollar has experienced fluctuations due to mixed economic indicators and evolving monetary policy expectations from the Federal Reserve. These dynamics contribute to the supportive environment for the pound against the dollar.
Technical analysis reinforces the bullish outlook for GBP/USD. The pair has been trading above key moving averages, with oscillators indicating strong upward momentum. The formation of the bullish pennant suggests a continuation of the prevailing uptrend. Key resistance levels to monitor include 1.3000 and 1.3040, with a sustained break above these points potentially paving the way toward the 1.3100 target. Additionally, the Relative Strength Index (RSI) remains in bullish territory, suggesting that the current uptrend has room to continue.
Traders should monitor key resistance levels closely, as a confirmed breakout could present a lucrative opportunity to capitalize on the anticipated movement. Implementing robust risk management strategies, such as setting appropriate stop-loss orders, is essential to navigate potential market volatility. Staying informed about upcoming economic data releases and central bank communications will also be crucial in effectively capitalizing on this trading opportunity.

WHY AUDUSD IS BEARISH ?? DETAILED ANALYSIS AUD/USD is currently trading at approximately 0.6290 and is forming a bearish flag pattern—a technical indicator suggesting potential continuation of the prevailing downtrend. This pattern typically emerges after a sharp decline, followed by a brief consolidation phase resembling an upward-sloping channel or flag. A decisive break below the flag's support often signals the resumption of bearish momentum, potentially leading to a significant price drop.
Fundamental factors are reinforcing this bearish outlook. Australia's employment data for February 2025 revealed an unexpected decline of 53,000 jobs, contrary to forecasts predicting an increase of 30,000 positions. Despite this, the unemployment rate remained steady at 4.1%. This unexpected contraction in employment could prompt the Reserve Bank of Australia (RBA) to consider interest rate cuts in upcoming meetings to stimulate economic activity.
Additionally, escalating global trade tensions, particularly due to increased U.S. tariffs under the new administration, are contributing to economic uncertainty. These developments have led to downgraded growth forecasts by organizations like the OECD and Fitch Ratings, further weighing on the Australian dollar.
Given these technical and fundamental factors, the AUD/USD pair appears poised for a bearish breakout from the flag pattern. Traders should monitor key support levels, such as the March low of 0.6186 and the 2025 trough at 0.6087. A sustained break below these levels could pave the way toward the psychologically significant 0.6000 mark, aligning with the anticipated 200-pip decline.
In this context, adopting a short position on AUD/USD may be advantageous. However, it's crucial to implement robust risk management strategies, including setting appropriate stop-loss orders, to mitigate potential market volatility.
