OBYTE bullish@Obyte (#gbyte) very bullish.
Take profit from Fibonacci.
Playing above support(last resistance).
Gbyte
Big bounce OBYTEStill im waiting Gbyte big bounce. Strong weekly support is at level 21.08$ and daily trendline holds. In the end we can see big bounce up if we get hit from support or we break out from trendline and we get candle close above this line.
Right now i dont belive that we break weekly support and going more down.
Eyes on this chart.
Obyte about to explodeChecking weekly, bi-weekly and monthly charts. Obyte-USD is in compression for 1078 days, which is just under 3y.
I reckon that December will be explosive for this market pair and Obyte-USD will be trading between $200 and $300.
Unbreakable bull trendThe BITTREX:GBYTEUSD known a violent price correction today. The target @ 34$US is still there. The bearish resistance is futile.
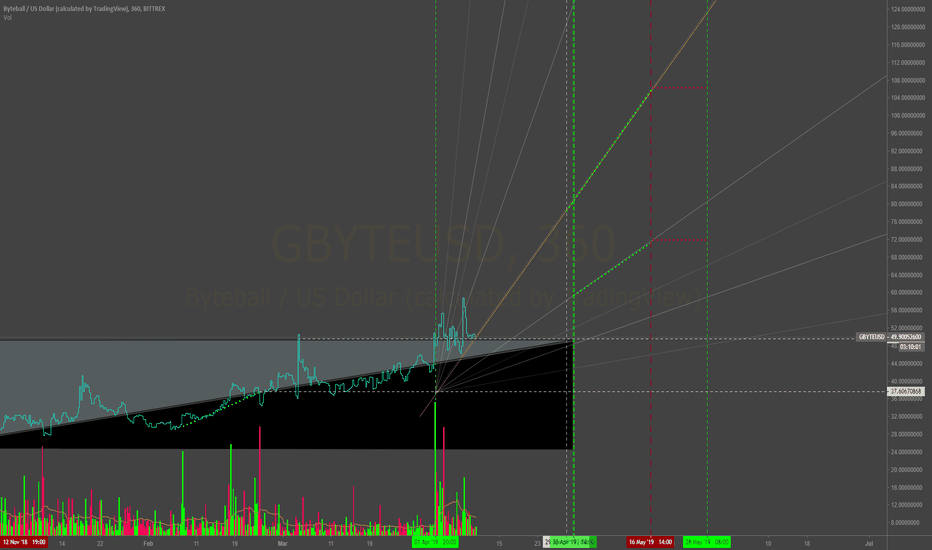
OByte Gbyte ByteBall Triangulation - Weighted Volume Method Gann, volume, and some magic. I might just be a little biased, really starting to like the fundamentals on this coin so take this with a Shill Pill.
$OBYTE $GBYTE
$OBYTE supply demand Obyte was hit hard by speculation during the last bull run, and with only 600,000 coins in circulation its no surprise it fell like a ton of bricks with the market. The good news is, the sharp decline also brought the MAs down quick so a sharp move up is possible. Obyte has made a lot of progress in the meantime from a dev perspective and is set to launch on BITZ anytime now... Therefore when the time comes, OBYTE will be able to have a nice cross up. Everything hinges on BTC and its price action so watch closely. Obyte is the same tech as IOTA but with smart contracts like ETH. Lots of potential here.
OBYTE GBYTE rebranded to OBYTE is fundamentally a really unique coin. Its yet to be discovered but it's gaining some ground as its being added to other exchanges and built upon. There's an opportunity for OBYTE to make a nice move up in the near future but keep in mind this is a lower volume, low supply coin that is directly linked to BTC's performance and volume.
OBYTE Gann Fans short term trends Marked some points of interest and paths of least resistance. Please follow the trend lines as OBYTE moves and as the price aligns with the fans and intersections. Pretty easy- If it's on a trend line, respecting it as support, its heading that way because its a path of least resistance. If the price breaks the trend line, it should respect the the next support/resistance trend line up or down. When the price comes to a crossing of 2 lines, acting as a wedge , watch closely for a break up or down based on market conditions, BTC price, volume, AND/OR you're own indicators etc. This is a low volume, low supply coin with great potential but it's gains are directly linked to a BTC and a short history.
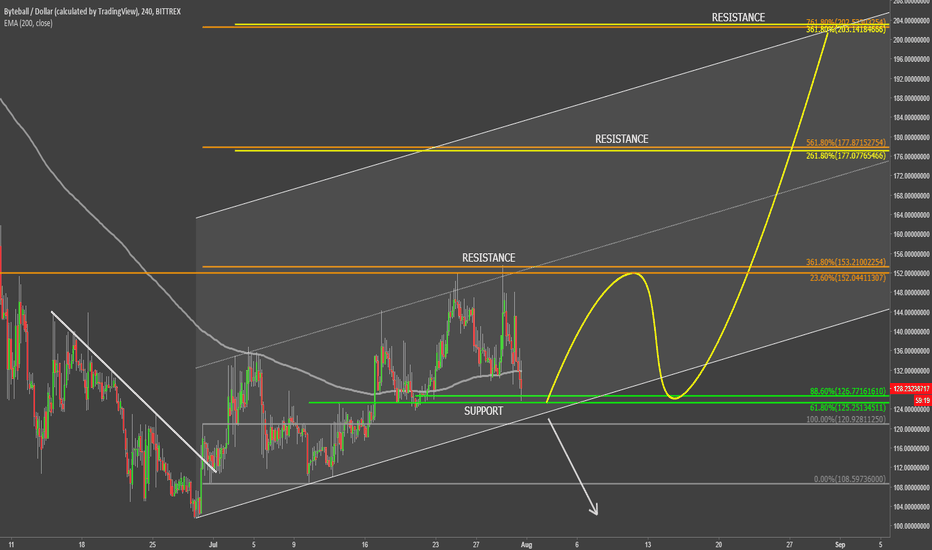
ByteBall at the Support - Uptrend Might ContinueAt the end of June Byteball has tested the low at $100, which is a strong psychological support. After bounce, price went up and broke above the downtrend trendline, corrected down, and went up again, this time breaking above the 200 Moving Average.
GBYTE/USD then bounced off strong resistance area at $150 and went down sharply. Currently it is trading at the $125 support, which could be the starting point for the uptrend continuation. It is worth mentioning that the 200 Moving Average is also acting as the support, as price still failed to break below with confidence.
If GBYTE stays above the $125 level, the uptrend is likely to continue, towards one of the Fibonacci resistance levels. First is at $177, and second is at $200 area, which is the next strong psychological resistance.
All-in-all, trend is bullish, but if the current support is broken, Byteball might once again move down towards the $100 area.
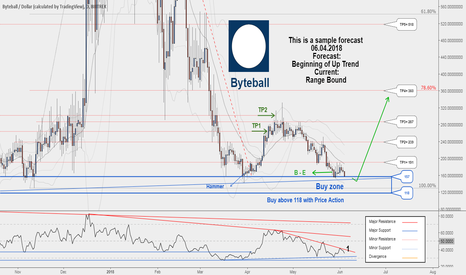
There is possibility for the beginning of uptrend in GBYTEUSD Technical analysis:
. BYTEBALL/DOLLAR is in a range bound and the beginning of uptrend is expected.
. The price is below the 21-Day WEMA which acts as a dynamic resistance.
. The RSI is at 43.
Trading suggestion:
. There is a possibility of temporary retracement to suggested support zone (114.00 to 95.00). if so, traders can set orders based on Price Action and expect to reach short-term targets.
Beginning of entry zone (114.00)
Ending of entry zone (95.00)
Entry signal:
Signal to enter the market occurs when the price comes to "Buy zone" then forms one of the reversal patterns, whether "Bullish Engulfing" , "Hammer" or "Valley" in other words,
NO entry signal when the price comes to the zone BUT after any of reversal patterns is formed in the zone.
To learn more about "Entry signal" and the special version of our "Price Action" strategy FOLLOW our lessons:
Take Profits:
TP1= @ 137
TP2= @ 157
TP3= @ 191
TP4= @ 239
TP5= @ 287
TP6= @ 360
TP7= @ 518
TP8= @ 643
TP9= @ 777
TP10= @ 895
TP11= @ 1210
TP12= Free
$gbyte longSolid af fundamentals & decent range for spot accumulation. If you think trex is going to be a vol-dead graveyard forever, you're only kidding yourself.
A trading opportunity to buy in Byteball is near...Technical analysis:
. BYTEBALL/DOLLAR is in a range bound and Beginning of uptrend is expected.
. The price is below the 21-Day WEMA which acts as a dynamic resistance.
. The RSI is at 36.
. While the RSI downtrend #1 is not broken, bearish wave in price would continue.
Trading suggestion:
. The price is in a range bound, but we forecast the uptrend would begin.
. There is a possibility of temporary retracement to suggested support zone (157 to 118). if so, traders can set orders based on Price Action and expect to reach short-term targets.
Beginning of entry zone (157)
Ending of entry zone (118)
Entry signal:
Signal to enter the market occurs when the price comes to "Buy zone" then forms one of the reversal patterns, whether "Bullish Engulfing" , "Hammer" or "Valley" , in other words,
NO entry signal when the price comes to the zone BUT after any of reversal patterns is formed in the zone.
To learn more about "Entry signal" and special version of our "Price Action" strategy FOLLOW our lessons:
Take Profits:
TP1= @ 191
TP2= @ 239
TP3= @ 287
TP4= @ 360
TP5= @ 518
TP6= @ 643
TP7= @ 777
TP8= @ 895
TP9= @ 955
TP10= @ 1210
TP11= Free
A trading opportunity to buy in Byteball is near...Technical analysis:
. BYTEBALL/DOLLAR is in a range bound and Beginning of uptrend is expected.
. The price is below the 21-Day WEMA which acts as a dynamic resistance.
. The RSI is at 35.
. While the RSI downtrend #1 is not broken, bearish wave in price would continue.
Trading suggestion:
. The price is in a range bound, but we forecast the uptrend would begin.
. There is a possibility of temporary retracement to suggested support zone (157 to 118). if so, traders can set orders based on Price Action and expect to reach short-term targets.
Beginning of entry zone (157)
Ending of entry zone (118)
Entry signal:
Signal to enter the market occurs when the price comes to "Buy zone" then forms one of the reversal patterns, whether "Bullish Engulfing" , "Hammer" or "Valley" , in other words,
NO entry signal when the price comes to the zone BUT after any of reversal patterns is formed in the zone.
To learn more about "Entry signal" and special version of our "Price Action" strategy FOLLOW our lessons:
Take Profits:
TP1= @ 191
TP2= @ 239
TP3= @ 287
TP4= @ 360
TP5= @ 518
TP6= @ 643
TP7= @ 777
TP8= @ 895
TP9= @ 955
TP10= @ 1210
TP11= Free


