Close out the Week STRONGLooks like price has found its bottom and is ready to push from here. We are looking for a strong forceful break out from this zone so we can go for the higher levels. Everything looks right from here and value keeps shifting up. I know we should get a solid entry but waiting for it to line up with time.
GC

WE GOT THE SWEEP ON GOLD!!!!THIS is the move I was waiting for! we got the full sweep on levels. looking for price to flip back to bullish pressure from here. Now we just wait for the entry to show as we move into the Asian Killzone.

GOLD - GC Weekly Recap & Outlook | 27.07.2025🧾 Weekly Recap:
• Price tapped into the 1H Demand Zone (red box) and ran the 4H swing liquidity before bouncing to clear internal range liquidity.
• This move was followed by a retracement which led to a break of the bullish trendline.
This may signal the beginning of a broader accumulation phase. Expect choppy price action targeting internal liquidity both above and below, before a clear trend resumes.
📌 Technical Analysis:
Price has closed below the bullish trendline, leading to two possible scenarios:
1. Bullish scenario (black path):
– Price runs the W C DOL (3313$) →
– Finds rejection →
– Retests broken trendline →
– Breaks above the trendline →
– Continues toward 3444$ and potentially 3474$
2. Bearish scenario (orange path):
– Price runs W C DOL (3313$) →
– Rejects from the broken trendline →
– Fails to reclaim it →
– Continues downward to target M C DOL (3256$)
📈 Setup Trigger:
Wait for clear 1H–4H supply/demand zone creation and structure shift before initiating a trade.
🎯 Trade Management:
• Stoploss: Above/below relevant supply-demand zone
• Targets:
– Bullish: 3444$, 3474$
– Bearish: 3256$
🟡 If you liked the idea, feel free to drop a like & comment — and don’t forget to follow for more weekly updates.

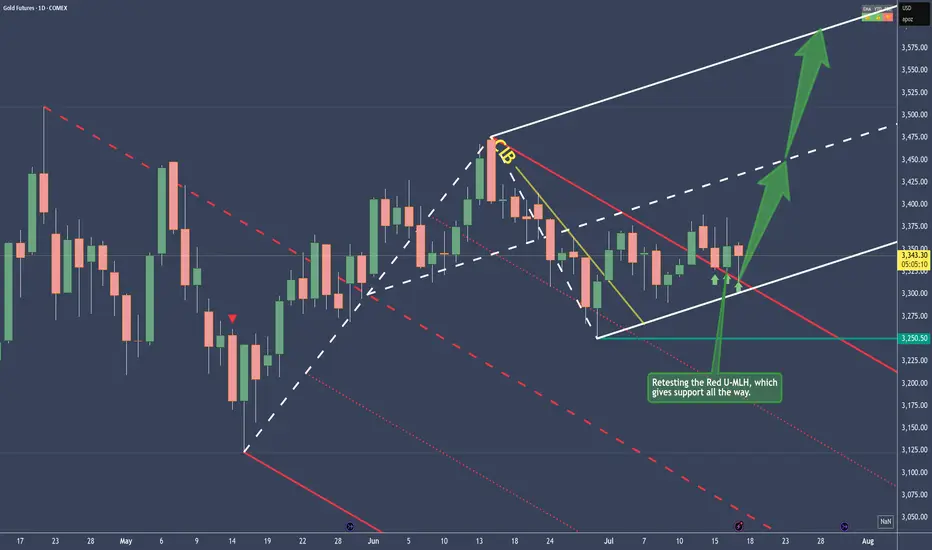
Gold - Bullish and here's whyPrice traveled within the Red Fork, until it broke the CIB Line, which is indicating a Change In Behavior.
From there on, sideways action, until the break of the Red U-MLH happened.
After the close above the Red U-MLH, price has tested it the 3rd time now. At the time of writing, the Bar looks like a PinBar. So it has good sepparation from the bottom, or a long Down-Wick. That's indicates good strenght.
To me this looks like a good long trade, but as everytime, play it save and don't let greed eat your brain ;-)
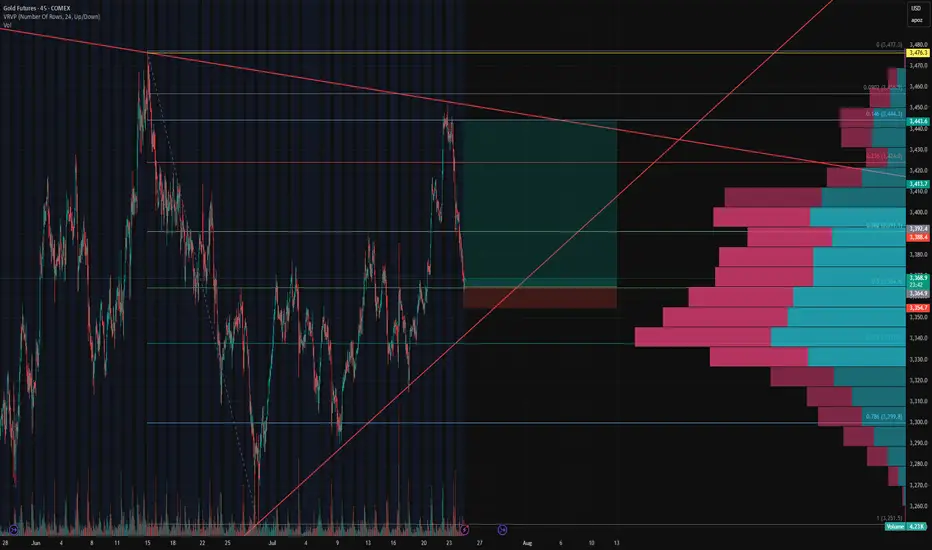
Gold Futures (GC1!) Long Setup – 0.5 Fib Bounce🟡 Gold Futures (GC1!) Long Setup – 0.5 Fib Bounce
After nailing the long from the bottom and perfectly shorting the top, we’re stepping back in for another calculated move.
📉 Price pulled back to the 0.5 Fibonacci retracement, aligning perfectly with the upward trendline support and a key HVN on the Volume Profile.
📈 Entered long at 3,365 with a tight stop below 3,354 (0.3% risk), targeting the descending trendline near 3,444 for a clean 7.7R setup.
🧠 Context:
Price reacted hard at resistance, but volume support and structure still lean bullish.
Clear invalidation if we break trend and lose 3,350 support cluster.
Let’s see if this bounce gets legs. 🚀
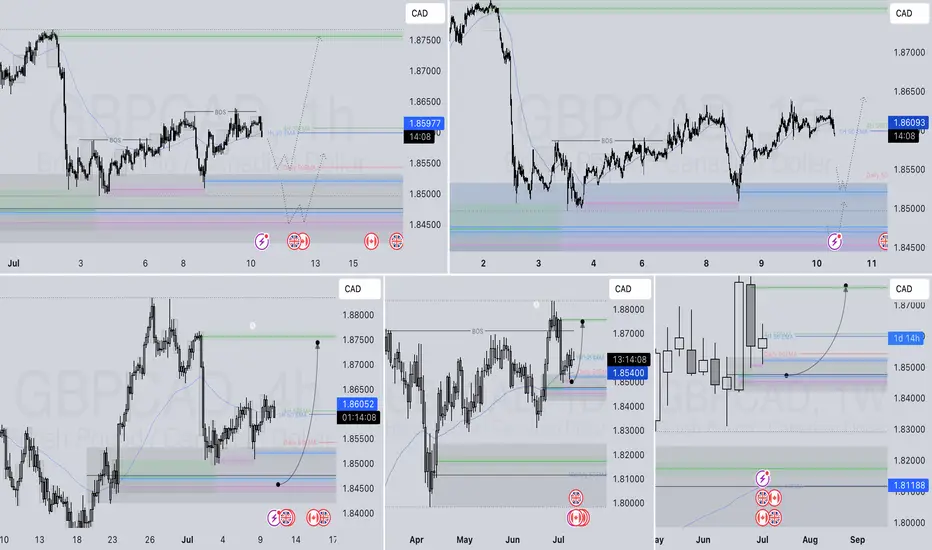
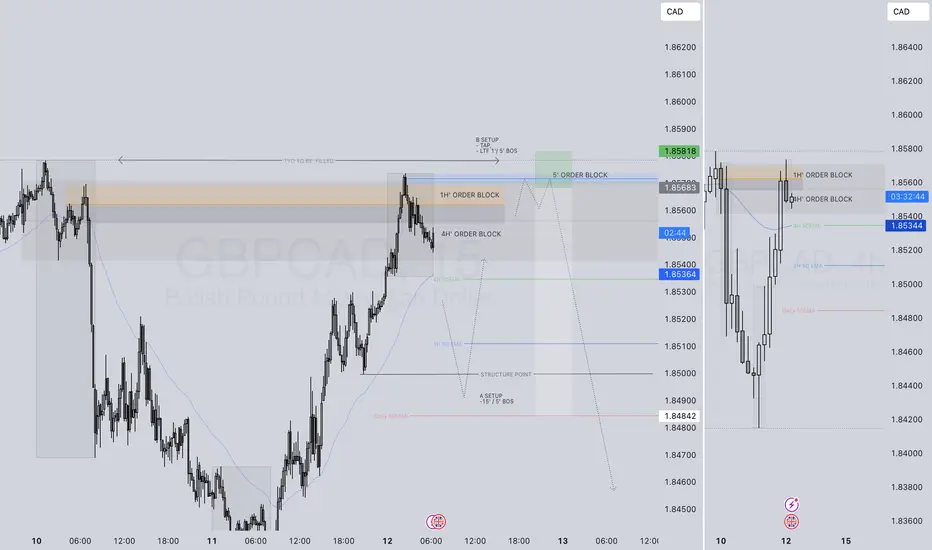
GBPCAD Q3 | D24 | W30 | Y25📊GBPCAD Q3 | D24 | W30 | Y25
Daily Forecast🔍📅
Here’s a short diagnosis of the current chart setup 🧠📈
Higher time frame order blocks have been identified — these are our patient points of interest 🎯🧭.
It’s crucial to wait for a confirmed break of structure 🧱✅ before forming a directional bias.
This keeps us disciplined and aligned with what price action is truly telling us.
📈 Risk Management Protocols
🔑 Core principles:
Max 1% risk per trade
Only execute at pre-identified levels
Use alerts, not emotion
Stick to your RR plan — minimum 1:2
🧠 You’re not paid for how many trades you take, you’re paid for how well you manage risk.
🧠 Weekly FRGNT Insight
"Trade what the market gives, not what your ego wants."
Stay mechanical. Stay focused. Let the probabilities work.
FRGNT

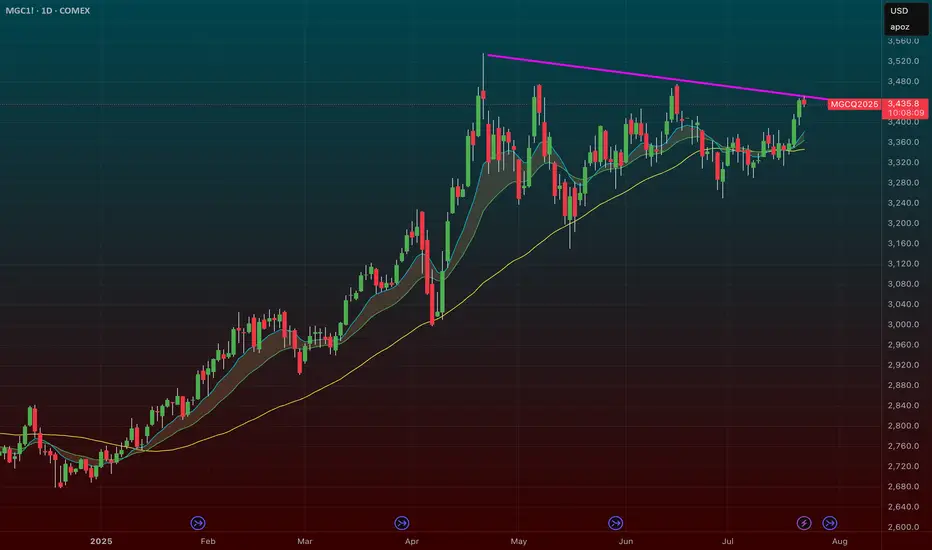
$GLD / $GC – Gold Poised for Breakout as Hard Assets FlexAMEX:GLD / SET:GC – Gold Poised for Breakout as Hard Assets Flex
Gold is setting up for a major breakout, and the broader market is finally catching on to the hard asset trade. Whether it’s inflation ticking up or the never-ending government deficit spending, the market is starting to signal something big.
🔹 Macro Tailwinds:
Inflation pressures + record deficit = a perfect storm for gold.
The dollar is under pressure — metals ( AMEX:GLD , AMEX:SLV , SET:GC ) are responding.
This theme isn’t going away anytime soon.
🔹 Technical Setup:
AMEX:GLD and SET:GC (Gold Futures) are coiled tightly just under breakout levels.
Volume is steady, and momentum is building under the surface.
A move through current resistance could send this entire trade into overdrive.
🔹 My Positioning:
1️⃣ Options: Long AMEX:GLD calls with 1-month expiration — slow mover, but clean structure.
2️⃣ Futures: Trading SET:GC contracts on the breakout side.
3️⃣ Silver Exposure: Still holding partials in AMEX:SLV — it’s following gold’s lead but with more juice.
Why I’m Focused Here:
This is not a one-day theme — hard assets are becoming a rotation trade.
If this confirms, we could see multi-week upside in precious metals.
It’s rare to get clean technicals that align this well with macro.
GOLD: Pre-market PrepSo for gold today, I see a lot of confluence around the prior week's high, prior day's high, and the prior value area high. We also had a poor high last Friday that we've clearly broken through.
Right now, we're in balance up above these key levels. My immediate plan is to continue going long up to the prior month's value area high. If we get a pullback to the confluence area, I want to take it up from there.
If the market opens and we accept back into the previous area, I'll be looking to go short from that area and take it down. That's my main analysis for gold today. Let’s trade smart, peace!

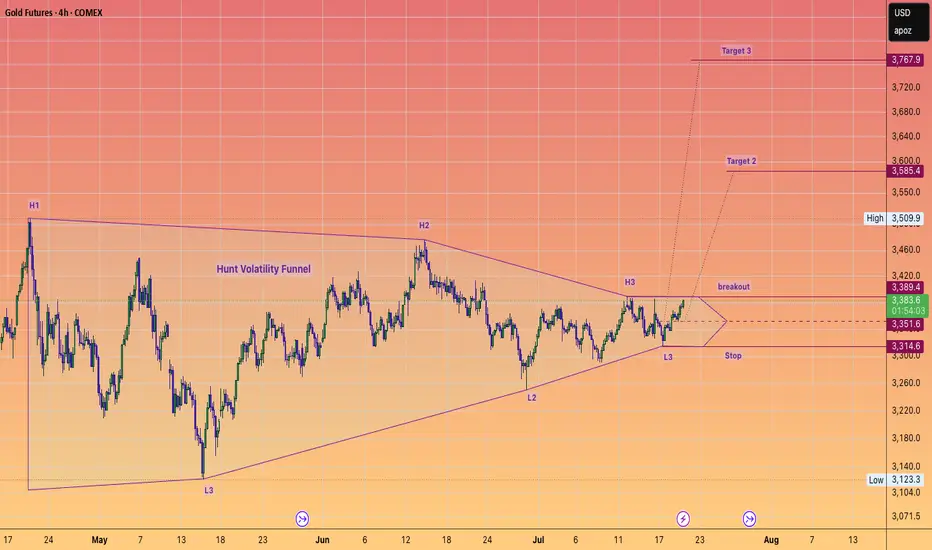
Trade Alert! GOLD to $3800 SOON.#HuntVolatilityFunnel setup which is about to trigger to the upside.
This setup should take gold to or very close to $4K IMHO
#GC
#GOLD
#SILVER
#METALS
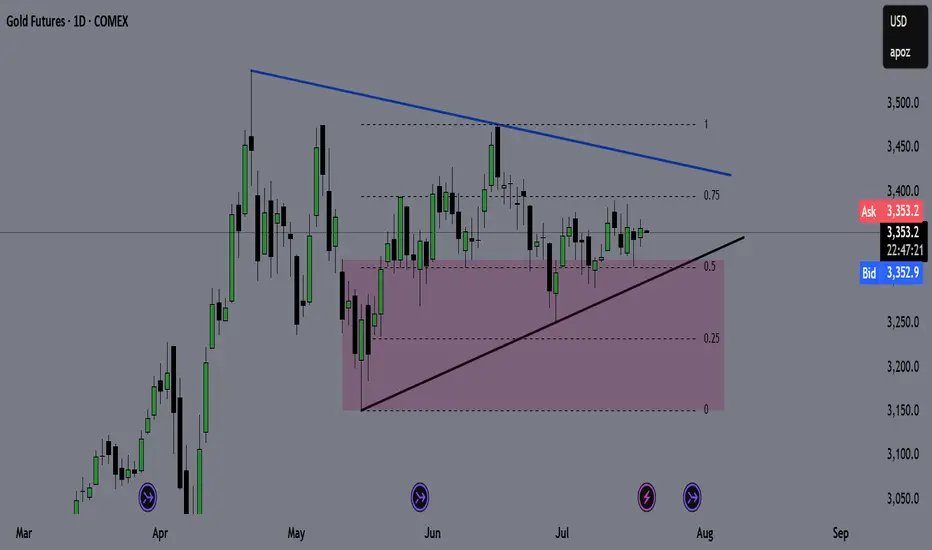
GOLD (GC) Weekly Recap & Game Plan 20/07/2025🪙 GOLD (GC) Weekly Recap & Game Plan
📊 Market Context:
Price is currently forming an accumulation pattern.
The purple zone marks a key weekly demand zone, and I expect a potential bounce from that level.
I'm closely watching for trendline deviations to determine the directional bias.
🎯 Game Plan:
If price drops below the trendline and bounces from the weekly demand, I’ll look for longs targeting the bearish trendline.
If price taps the bearish trendline and shows clear rejection, I’ll look for shorts targeting the bullish trendline.
I'll wait for LTF confirmations before entering any position.
✅ Follow for weekly recaps & actionable game plans.
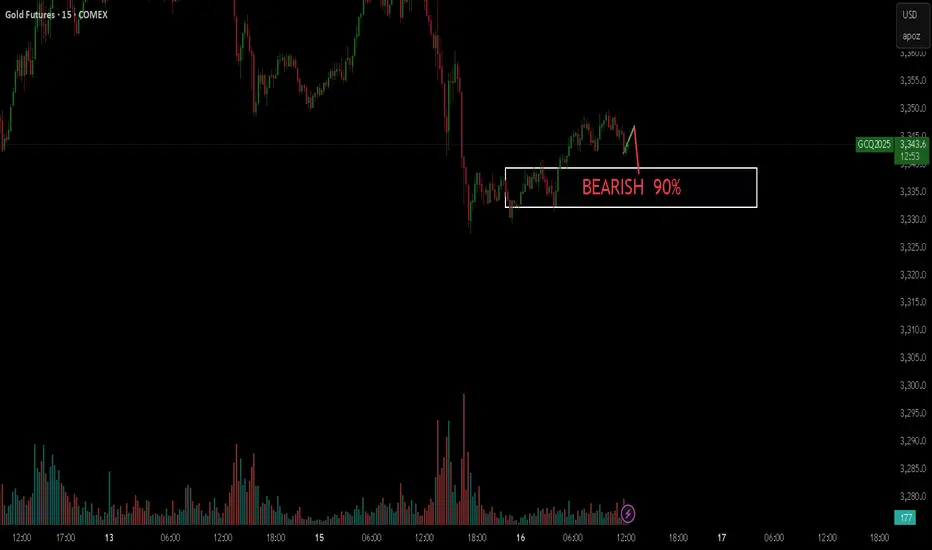
GOLD BEARISH 90%Hello,
I see a very high probability that the gold market will fall in the short term.
GOLD - GC | Weekly Recap & Plan 13.07.2025🟡 GOLD (GC) Weekly Recap & Outlook
Symbol: GC1!
Date: Week of July 8–12, 2025
Timeframes Used: 4H, Daily, Weekly, HTF structure
🔍 What Happened Last Week?
Gold saw a strong rejection from a confluence of two HTF trendlines, signaling resistance.
But that move was absorbed by:
🟦 Daily Demand (blue zone)
🔵 Daily Swing Liquidity (blue line)
This builds a bullish structure on the daily chart.
🧭 Scenarios I'm Watching
Scenario 1 — Minor Pullback:
🔹 Price may revisit the Daily Gap (pink line) and find support for continuation.
Scenario 2 — Deeper Pullback:
🟣 Price could retrace into the HTF bullish trendline (purple) before resuming upside.
🗞️ Bonus Macro Scenario: Powell Resignation?
There are growing rumors that Fed Chair Powell might resign this week.
📈 If that happens, I expect strong bullish momentum in Gold —
→ very limited retracement, and
→ potential straight breakout into new highs.
🎯 Targets for the Week:
✅ 1st Target:
W C DOL (purple line) → acts as a primary take profit area.
✅ 2nd Target (Expansion):
EQHs / DOL (extended purple levels)
Game Plan:
Watch for LTF confirmation on both retracement zones.
Maintain bullish bias unless Daily Demand fails.
If Powell resigns, be ready for breakout setups.

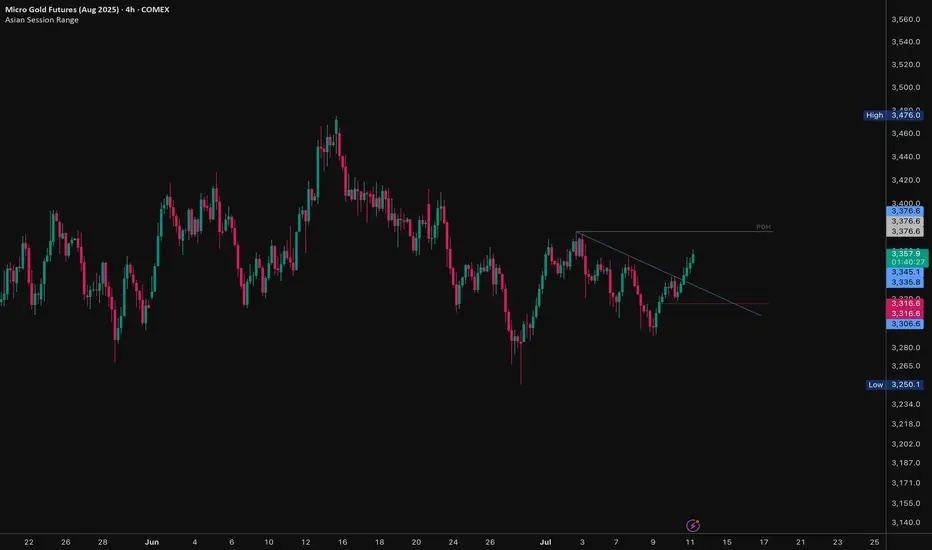
Gold - Watching for Trendline Retest Gold has shown a significant breakout from a recent downtrend resistance line on the 4-hour chart. The price action suggests a shift in momentum, but a potential retest of the broken trendline offers a high-probability entry point.
Technical Analysis:
Trendline Breakout Confirmed: The provided chart clearly shows XAUUSD breaking above a descending trendline that has defined the recent short-term consolidation/downtrend. This breakout indicates a potential resumption of bullish momentum or the end of the consolidation phase.
Immediate Resistance: The price has encountered resistance near the area of the previous daily high (PDH) or a local swing high around 3,376.6. This level will be the immediate target for buyers if the breakout holds.
Potential Retest Zone: A common occurrence after a trendline breakout is a "retest" of the broken resistance level, which now acts as support. The trendline itself and the immediate support levels identified on the chart (e.g., 3,335.8 to 3,316.6) form a potential retest zone.
Trade Idea & Strategy:
The primary trade idea is to wait for a technical confirmation of the breakout by observing a retest of the broken trendline.
Entry Strategy (Bullish Confirmation):
Wait for the price to pull back towards the broken trendline (approximately 3,330 to 3,345 area, depending on the exact slope).
Look for bullish reversal signals (e.g., candlestick patterns like hammers, engulfing patterns, or significant buying volume) at the trendline support.
Enter a long position upon confirmation of support at the retest zone.
Potential Target 1: The recent swing high/PDH area around 3,376.6.
Potential Target 2: If Target 1 is cleared, the high of 3,476.0 (or previous major resistance levels).
Stop Loss: Place a stop loss below the low of the retest candle or below the significant support area (e.g., below 3,300), invalidating the bullish setup.
Alternative Scenario (Bearish Rejection):
If the price fails to hold the trendline support during the retest and decisively breaks back below it, the breakout may be considered a false breakout. In this scenario, the market could revert to the previous downtrend structure.
Disclaimer: This is an analysis for educational purposes and is not financial advice. Always perform your own research and risk analysis before trading.
GBPCAD LONG FORECAST Q3 D10 W28 Y25GBPCAD LONG FORECAST Q3 D10 W28 Y25
Professional Risk Managers👋
Welcome back to another FRGNT chart update📈
Diving into some Forex setups using predominantly higher time frame order blocks alongside confirmation breaks of structure.
Let’s see what price action is telling us today! 👀
💡Here are some trade confluences📝
✅Daily Order block identified
✅4H Order Block identified
✅1H Order Block identified
🔑 Remember, to participate in trading comes always with a degree of risk, therefore as professional risk managers it remains vital that we stick to our risk management plan as well as our trading strategies.
📈The rest, we leave to the balance of probabilities.
💡Fail to plan. Plan to fail.
🏆It has always been that simple.
❤️Good luck with your trading journey, I shall see you at the very top.
🎯Trade consistent, FRGNT X
GBPCAD LONG FORECAST Q3 D8 W28 Y25GBPCAD LONG FORECAST Q3 D8 W28 Y25
Professional Risk Managers👋
Welcome back to another FRGNT chart update📈
Diving into some Forex setups using predominantly higher time frame order blocks alongside confirmation breaks of structure.
Let’s see what price action is telling us today! 👀
💡Here are some trade confluences📝
✅Daily Order block identified
✅4H Order Block identified
✅1H Order Block identified
🔑 Remember, to participate in trading comes always with a degree of risk, therefore as professional risk managers it remains vital that we stick to our risk management plan as well as our trading strategies.
📈The rest, we leave to the balance of probabilities.
💡Fail to plan. Plan to fail.
🏆It has always been that simple.
❤️Good luck with your trading journey, I shall see you at the very top.
🎯Trade consistent, FRGNT X

GBPCAD LONG FORECAST Q3 W28 Y25GBPCAD LONG FORECAST Q3 W28 Y25
Professional Risk Managers👋
Welcome back to another FRGNT chart update📈
Diving into some Forex setups using predominantly higher time frame order blocks alongside confirmation breaks of structure.
Let’s see what price action is telling us today! 👀
💡Here are some trade confluences📝
✅Daily Order block identified
✅4H Order Block identified
✅1H Order Block identified
🔑 Remember, to participate in trading comes always with a degree of risk, therefore as professional risk managers it remains vital that we stick to our risk management plan as well as our trading strategies.
📈The rest, we leave to the balance of probabilities.
💡Fail to plan. Plan to fail.
🏆It has always been that simple.
❤️Good luck with your trading journey, I shall see you at the very top.
🎯Trade consistent, FRGNT X

WHAT IS THE EXPECTED RETURN and DURATION of this GOLD Bull Run?Well, when measured against the DXY index, a clear trend becomes apparent.
A Golden Bull typically lasts about 40 quarters, which is essentially 1 decade (give or take a quarter).
Similar to #Bitcoin and its cyclical bull markets within a larger secular bull, the returns tend to decrease over time.
However, it seems that a triple-digit Gold price relative to the DXY is on the horizon at the very least.
What would that look like if the DXY were to hit a new low around 69? This would suggest a Gold price of $6900 at a ratio of 100:1.
A Gold price of $12K with a DXY of 80 only requires a ratio of 150...
Thus, a five-digit Gold price is certainly within the realm of possibility.
I have forecasts that extend as high as $12K.

Futures Watchlist for week ending 6/27/2025Come join as i go through the future tickers that im watching this week and where i see them going. With war talks filling up on social media this will add to our volatility and we will look at key levels to capitalize off of it! Let me know your thoughts on these tickers. Also let me know if there is another symbol futures or stocks that you want me to breakdown for you!

GOLD poised for breakout GLD & /gcAfter going on a huge run to 317 we have spent a significant time now basing out and consolidating we’ve come down into that 300 range and tested and built up quite a bit of support
With the Iranian intentions we could kickstart the next move in gold 317 is the breakout. I am looking to play this breakout on an intra day pull back with some calls one month out for a swing Trey looking at the 320 or 325 strike price

GBPCAD SHORT FORECAST Q2 W24 D12 Y25GBPCAD SHORT FORECAST Q2 W24 D12 Y25
Professional Risk Managers👋
Welcome back to another FRGNT chart update📈
Diving into some Forex setups using predominantly higher time frame order blocks alongside intraday confirmation breaks of structure.
💡Here are some trade confluences📝
✅Weekly highs POI
✅1H order block rejection
✅4H order block rejection
✅15’ order block identification
🔑 Remember, to participate in trading comes always with a degree of risk, therefore as professional risk managers it remains vital that we stick to our risk management plan as well as our trading strategies.
📈The rest, we leave to the balance of probabilities.
💡Fail to plan. Plan to fail.
🏆It has always been that simple.
❤️Good luck with your trading journey, I shall see you at the very top.
🎯Trade consistent, FRGNT X
GOLD SqueezeLooking at the 4-hour timeframe. Price is failing to make LL or HH, with pressure getting tighter and tighter. Personally, I'm not really interested in trading a market like this till price breaks out.

Gold's Correction May Not be Over Yet - Here's WhyHere is my 2-minute technical take on why gold could be looking at a break below 3200 as part of a deeper correction, before it even considers resuming its almighty bullish rally.
Matt Simpson, Market Analyst at City Index and Forex.com

Trade Plan – MGC (Micro Gold Futures) | Sunday, May 4Trend Bias (Multi-Timeframe Analysis):
• 1W: Bullish – Strong macro uptrend with pullback off all-time highs.
• 1D: Bearish – Lower highs and lower lows forming after topping out at $3,509.
• 4H: Bearish – Clean downtrend continuation forming.
• 1H: Bearish – Price rejected lower highs, now curling down again.
• 15M: Bullish – Short-term bounce from $3,210 low, but corrective in nature.
Trade Setup:
• Direction: Short
• Entry Zone: $3,250 – $3,260
• Price has retraced to a lower-high zone under supply; aligns with hourly resistance.
• Stop Loss: $3,270
• Just above 1H structure and 15M failed high.
• Take Profit: $3,210
• Prior swing low and liquidity zone.
