Weekly Market Forecast: BUY Stock Indices & Oil! Sell Gold! In this Weekly Market Forecast, we will analyze the S&P 500, NASDAQ, DOW JONES, Gold and Silver futures, for the week of June 9 - 13th.
Stock Indices are looking more bullish. Valid buys only!
Gold is weak. Sells only until there is a market structure shift upwards.
Oil prices have room to go higher. Buy it.
Silver is a wait and see. Should start to pull back this week, as it closed last week stronger than Gold.
CPI Wednesday. After the news is announced, the market should be very tradeable for the rest of the week.
Enjoy!
May profits be upon you.
Leave any questions or comments in the comment section.
I appreciate any feedback from my viewers!
Like and/or subscribe if you want more accurate analysis.
Thank you so much!
Disclaimer:
I do not provide personal investment advice and I am not a qualified licensed investment advisor.
All information found here, including any ideas, opinions, views, predictions, forecasts, commentaries, suggestions, expressed or implied herein, are for informational, entertainment or educational purposes only and should not be construed as personal investment advice. While the information provided is believed to be accurate, it may include errors or inaccuracies.
I will not and cannot be held liable for any actions you take as a result of anything you read here.
Conduct your own due diligence, or consult a licensed financial advisor or broker before making any and all investment decisions. Any investments, trades, speculations, or decisions made on the basis of any information found on this channel, expressed or implied herein, are committed at your own risk, financial or otherwise.
GC1! (Gold Futures)

Natural Gas | Oil | Dollar | Silver | Gold Price Forecast.Natural Gas | Oil | Dollar | Silver | Gold Price Forecast.
OANDA:XAGUSD COMEX:SI1! NYMEX:NG1! COMEX:GC1!

Emini Nasdaq 100 Weekly Outlook and Walkthrough. Outlined the orderflow and my thought process on Daily profiles and expansion days. Marked out my thought process. And how I would execute in that very specific moment. One of my best examples. Go ahead check it out.

GOLD MARKET ANALYSIS AND COMMENTARY - [Jun 09 - Jun 13]OANDA:XAUUSD fell more than 1% on Friday (June 6) due to the unexpected US non-farm payrolls data for May. Spot gold closed at $3,309.84/oz, up 0.8% on the week.
Although gold failed to break above the $3,400/oz resistance and may fluctuate in the $3,300-$3,400/oz range in the short term, the market's resilience and long-term uptrend remain solid.
Meanwhile, silver and platinum outperformed, hitting 13-year and 3-year highs, respectively, on investment demand and expectations of supply shortages.
Gold prices rose significantly on Monday last week and hovered at highs ahead of the release of non-farm payrolls data from Tuesday to Friday, reaching $3,403.48 an ounce on Thursday.
The latest data showed that the US added 139,000 non-farm payrolls in May, beating market expectations of 130,000, the unemployment rate held steady at 4.2% and wage growth beat expectations.
This reduced the likelihood of the Federal Reserve cutting interest rates in the near future, pushing the US dollar and US bond yields higher and putting pressure on gold prices.
OANDA:XAUUSD received initial support above 3,300 USD/ounce, indicating that the market still has buying support, but the resistance level of 3,400 USD/ounce is difficult to overcome in the short term and 3,200 USD/ounce is the main support level, more detailed technical analysis will be sent to readers in the following part of the article. However, since the raw price points are still related to fundamental analysis, I personally think that the price declines can be seen as an opportunity for gold to hold at lower prices, the long-term uptrend is fundamentally unchanged and central bank gold buying and a weaker dollar will continue to support gold prices.
Despite the rise in risk assets such as stocks, gold has shown resilience. Central bank demand for diversified reserves and market risk appetite will continue to support gold prices, underscoring its appeal as a safe-haven asset.
Market Background and Outlook
The labor market is slowing steadily and the Federal Reserve is likely to continue to wait and see, with the likelihood of a near-term rate cut low. The May CPI data next Wednesday (June 11) will be in focus. If CPI rises, it will push the US Dollar higher and further depress gold prices. If CPI is weak, it could help push gold prices higher.
Geopolitical and trade factors: Trump's call with Xi Jinping on Thursday did not bring any clear progress on trade. If the tariff news worsens, this could boost demand for gold as a safe haven.
On the other hand, the outlook for the Middle East-US, Ukraine-Russia talks is also not getting any better, any negative signs on the geopolitical front next week will also boost gold prices to recover.
Economic data and events next week
Wednesday: US Consumer Price Index (CPI)
Thursday: US Producer Price Index (PPI), Weekly Jobless Claims
Friday: University of Michigan Consumer Sentiment Index
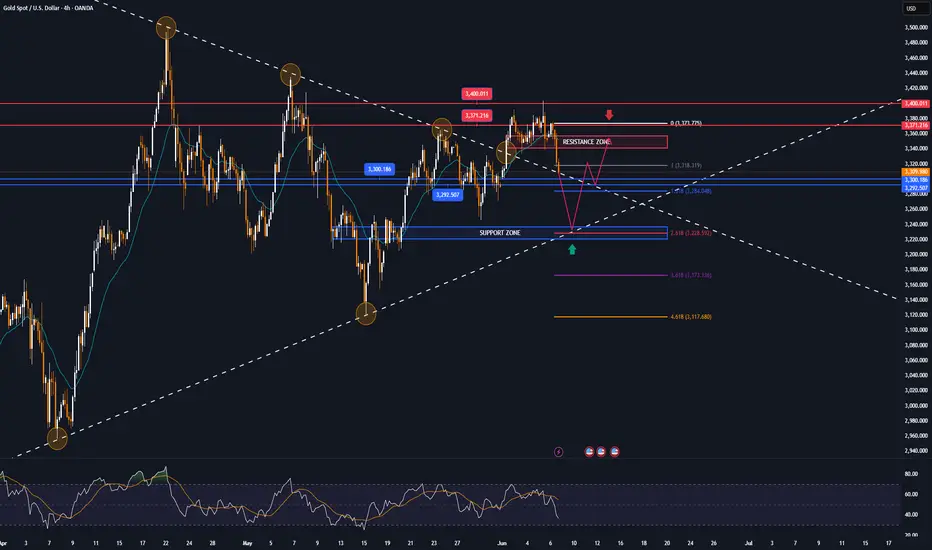
📌Gold prices fell sharply on Friday as it retested the $3,371 target level, which is the 0.236% Fibonacci retracement level, but failed to break it. The bearish momentum took gold towards an area where there are several important supports such as the $3,300 price point and the confluence of the 0.382% Fibonacci retracement level with the 21-day EMA.
Although gold has fallen, its current position still has enough conditions for bullish expectations in the near term. And in terms of momentum, the Relative Strength Index (RSI) is still above 50, and in this case, 50 is considered the nearest momentum support.
As long as gold remains in/above the price channel, its main long-term trend is still bullish, in the short term if gold remains above the base price of 3,300 USD, it still has an upside target at 3,371 USD followed by the base price of 3,400 USD.
Notable technical levels are listed below.
Support: 3,300 – 3,292USD
Resistance: 3,350 – 3,371 – 3,400USD
SELL XAUUSD PRICE 3345 - 3343⚡️
↠↠ Stop Loss 3449
BUY XAUUSD PRICE 3227 - 3229⚡️
↠↠ Stop Loss 3223
Crude. Daily Internal to External Range Liquidity. 06.06.25Covering the crude expansion from daily internal towards the first external range liquidity

Gold NFP delivery. Thursday High Of The Week Market ProfileCovering Gold orderflow on thursday and NFP friday with proper reasoning.

GOLD recovers to $3,371, biggest data day of the weekOANDA:XAUUSD maintained its intraday recovery trend and the current gold price is around 3,371 USD/ounce, retesting the initial target increase sent to readers in the weekly publication. In this trading day, investors will focus on the US non-farm payroll data, which is expected to trigger major market movements.
Today (Friday), the US Bureau of Labor Statistics will release the highly anticipated non-farm payroll data for May. The market expects 130,000 new jobs and the unemployment rate to remain unchanged at 4.2%.
On Wednesday, the ADP jobs report, also known as the “mini-non-farm,” showed the smallest number of jobs created by the U.S. private sector in two years. The report could be a precursor to a negative non-farm payrolls report.
Payroll processor ADP reported on Wednesday that private sector payrolls increased by just 37,000 in May, down from a revised 60,000 in April and below the Dow Jones forecast of 110,000. It was the smallest monthly job gain since March 2023, according to ADP.
The U.S. Department of Labor reported on Thursday that initial jobless claims unexpectedly rose last week as concerns about the labor market mounted. The data showed initial jobless claims hit 247,000 in the week ended May 31, up 8,000 from the previous week and above the 236,000 expected in a Dow Jones survey.
If non-farm payrolls data released today is much worse than expected, it could weigh on the U.S. dollar and send gold prices soaring.
Technical Outlook Analysis OANDA:XAUUSD
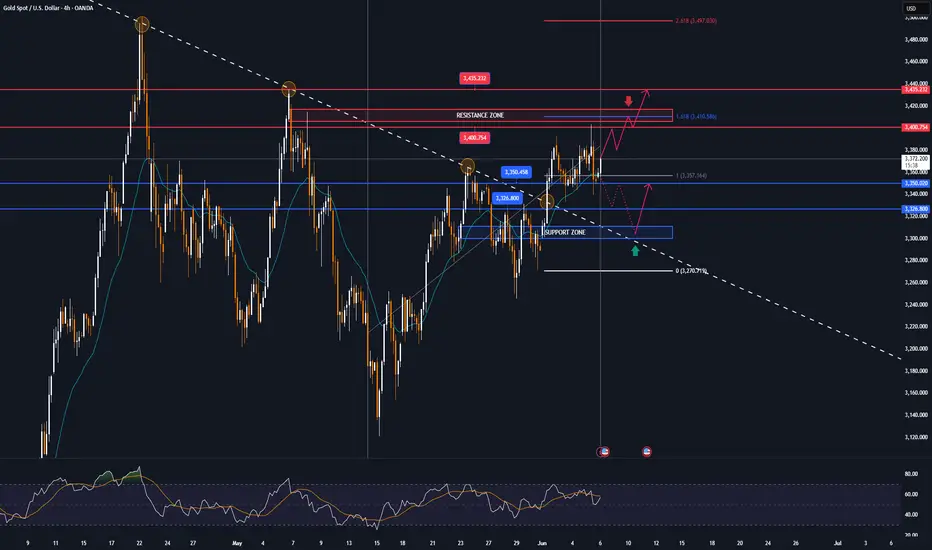
On the daily chart, after making a fresh weekly high and correcting lower yesterday, gold has recovered to reach its initial target at $3,371, the price point of the 0.236% Fibonacci retracement.
Following the uptrend, gold is likely to head towards the full price point of $3,400 in the short term, rather than $3,435.
Currently, the technical structure has not changed much with the uptrend completely dominating the technical chart. And the notable price points will also be listed as follows.
Support: 3,350 – 3,326 – 3,300USD
Resistance: 3,400 – 3,435USD
SELL XAUUSD PRICE 3412 - 3410⚡️
↠↠ Stop Loss 3416
→Take Profit 1 3404
↨
→Take Profit 2 3398
BUY XAUUSD PRICE 3301 - 3303⚡️
↠↠ Stop Loss 3297
→Take Profit 1 3309
↨
→Take Profit 2 3315
GOLD 05.06,2025, Thursday. Day before NFPCovering my all star model. The criteria the setup the thought process and the narrative behind this model.

GOLD trades around target of 3,371 USD, positive outlookOANDA:XAUUSD rose significantly, retesting the $3,371 target as weak US economic data and a weaker dollar were the main reasons for the rise in gold prices.
The market is also struggling to cope with growing political and economic uncertainties.
OANDA:XAUUSD recovered from yesterday's session low of $3,343/oz after ISM and ADP reports confirmed a slowdown in the US economy. Meanwhile, US President Donald Trump signed an executive order to increase tariffs on steel and aluminum from 25% to 50%, effective from June 4, escalating trade tensions.
Federal Reserve officials remain cautious on easing policy; markets await initial jobless claims and nonfarm payrolls data for further policy clues.
The first major data release on Wednesday, the ADP jobs report, dubbed the “mini-nonfarm,” showed the number of private jobs created in the United States was the lowest in two years.
Payroll processor ADP reported on Wednesday that private-sector job creation nearly stalled in May, hitting its lowest level in more than two years amid signs of labor market weakness.
Jobs increased by just 37,000 in the month, down from a revised 60,000 in April and below Dow Jones' forecast of 110,000.
This was the lowest monthly job gain since March 2023, according to ADP statistics. Following the ADP private sector jobs report, US President Trump immediately urged Federal Reserve Chairman Powell to cut interest rates in a furious manner.
Trump posted on Truth Social: "ADP data is out!!! Powell, who is 'too late', must cut interest rates now."
Trump's order to double tariffs on steel and aluminum imports has taken effect, and the White House has confirmed rumors that it has asked trading partners to submit their "best offer" by Wednesday to avoid higher tariffs.
Gold is considered a safe haven from political and economic uncertainty and typically performs well in low-interest-rate environments.
This Friday, the US Bureau of Labor Statistics will release its highly anticipated non-farm payrolls data, with markets expecting 125,000 new jobs and the unemployment rate to remain unchanged at 4.2%.
Technical Outlook Analysis OANDA:XAUUSD
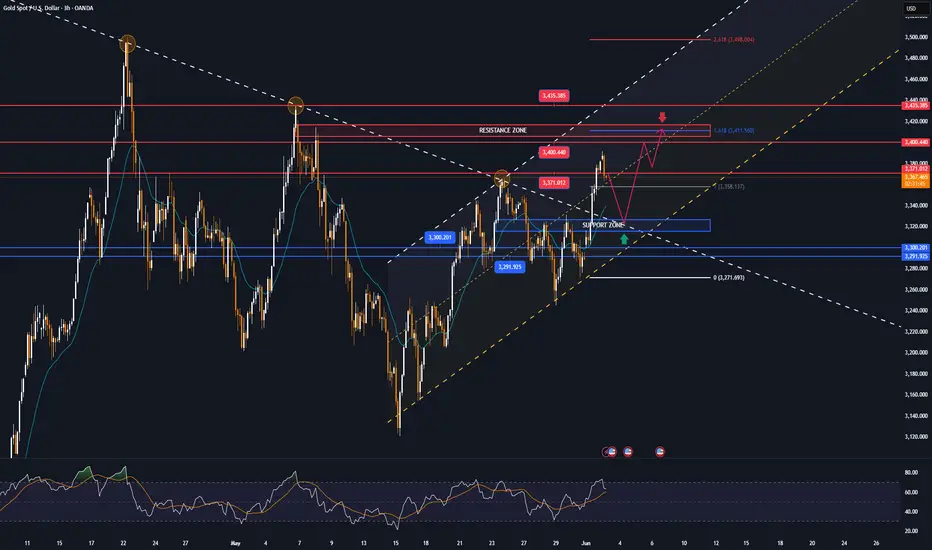
Gold continues to hit the first bullish target of note to readers in the past 2 weeks at $3,371, the price point of the 0.236% Fibonacci retracement.
Currently, gold is also trading around this level, with price action above $3,371 opening the door for a new bullish outlook and the next target around $3,400 in the short term.
In terms of momentum, gold still has a lot of room to rise as the RSI is operating above 50 pointing upwards but still far from overbought territory, which should be considered a bullish signal in the coming trading session.
There are no technical factors that suggest the possibility of a decline becoming a specific trend, the declines as long as gold remains within/above the price channel should only be considered as a short-term correction or a buying opportunity. Meanwhile, the nearest support is the confluence of the EMA21 with the 0.382% Fibonacci retracement and the short-term trend is highlighted by the price channel.
Finally, the bullish outlook for gold prices during the day will be highlighted by the following positions.
Support: 3,350 – 3,326 USD
Resistance: 3,400 – 3,435 USD
SELL XAUUSD PRICE 3412 - 3410⚡️
↠↠ Stop Loss 3416
→Take Profit 1 3404
↨
→Take Profit 2 3398
BUY XAUUSD PRICE 3299 - 3301⚡️
↠↠ Stop Loss 3295
→Take Profit 1 3307
↨
→Take Profit 2 3313

GOLD falls then recovers slightly, markets eye jobs dataMainly due to the strengthening of the TVC:DXY , OANDA:XAUUSD have fallen sharply from a near four-week high, with a one-day drop of nearly $30 on Tuesday and a slight recovery in today's Asian trading session on Wednesday, June 4.
DXY rebounded from its lowest level in more than a month hit earlier in the session on Tuesday and ended the day up 0.6%, which put some minor pressure on gold in yesterday's session. The U.S. Bureau of Labor Statistics' Employment and Labor Turnover Survey (JOLTS) released on Tuesday showed that total job vacancies in the United States reached 7.39 million in April, up from 7.2 million in March. Economists had expected job vacancies in the United States to be 7.1 million in April.
OANDA:XAUUSD fell on Tuesday as a surprise rise in U.S. job vacancies boosted risk appetite and helped the dollar strengthen, according to Bloomberg. The rise in job vacancies encouraged investors to believe that the U.S. economy remains resilient despite the threat of U.S. President Trump’s tariff agenda.
Looking ahead, U.S. employment data, including Friday’s May nonfarm payrolls report, could help guide the Federal Reserve’s monetary policy, Bloomberg said. Lower interest rates are generally good for non-interest-bearing gold.
Gold traders will be looking ahead to key employment data, including the ADP and nonfarm payrolls reports, to determine the Fed’s policy path.
In terms of technical structure, there are no changes to the chart or previous analysis so readers can review it in the previous publication.
SELL XAUUSD PRICE 3412 - 3410⚡️
↠↠ Stop Loss 3416
→Take Profit 1 3404
↨
→Take Profit 2 3398
BUY XAUUSD PRICE 3299 - 3301⚡️
↠↠ Stop Loss 3295
→Take Profit 1 3307
↨
→Take Profit 2 3313

XAUUSD: Bouncing off a former Resistance now turned Support.Gold is marginally bullish on its 1D technical outlook (RSI = 56.013, MACD = 32.440, ADX = 32.924) as it made a much needed pullback to test the former LH trendline. This is a Resistance turned Support trendline and as the 4H MA50 holds, we expect the breakout to extend to +7.39% from the bottom. TP = 3,485.
## If you like our free content follow our profile to get more daily ideas. ##
## Comments and likes are greatly appreciated. ##

GOLD surges to hit $3,371 target, continues to aim for $3,400OANDA:XAUUSD rose nearly 3% as US President Trump's tariff threats ratcheted up trade tensions, spurring investor demand for safe-haven assets and sending the dollar sharply lower.
US President Trump said on Friday he would raise tariffs on steel and aluminium imports from the US to 50% from the current 25% starting June 4. This has once again disrupted international trade, Reuters reported.
A European Commission spokesperson expressed deep regret over the US announcement that it would raise tariffs and said the EU was ready to take countermeasures.
Gold prices surged on Monday to a more than four-week high and continued to rise early this morning (Tuesday, June 3) as geopolitical risks from the conflict between Russia and Ukraine escalated as US President Donald Trump continued to threaten tariffs. Trump doubled tariffs on steel and aluminum imports to 50%, effective June 4, adding to jitters in global markets.
Ukraine launched its biggest drone attack since the war against Ukraine on Sunday, targeting a wide swath of Russian air bases on the eve of a second round of direct talks between the two countries. The drones, hidden in trucks, penetrated deep into Russia and hit strategic airfields as far away as eastern Siberia. At the same time, Moscow launched one of its longest drone and missile strikes on Kiev.
In key US data on Monday, the ISM Manufacturing Purchasing Managers’ Index (PMI) for May showed a contraction in business activity. The ISM Manufacturing Purchasing Managers’ Index for May came in at 48.5, down from 48.7 in April, the lowest reading since November.
Investors will also be closely watching comments from Federal Reserve policymakers this week for clues on the path of U.S. interest rates. Gold tends to benefit in low-interest-rate environments and times of geopolitical tension.
Technical Outlook Analysis OANDA:XAUUSD
After reaching the target increase at 3,371 USD, gold temporarily decreased slightly but overall it has enough conditions to continue to increase in price towards the next target at 3,400 USD in the coming time.
In the short term, gold also formed an upward price channel, which is noted by the price channel, describing the short-term technical trend. Meanwhile, in terms of momentum, RSI is operating above 50, still quite far from the overbought area, showing that there is still a lot of room for growth ahead.
For the day, the main outlook for gold is bullish, any pullbacks that fail to break below the confluence of the EMA21 with the 0.382% Fibonacci retracement should be considered only as a short-term correction, or a fresh buying opportunity.
Finally, the short-term bullish trend for gold will be focused again on the following positions.
Support: 3,326 – 3,300 – 3,292 USD
Resistance: 3,371 – 3,400 – 3,435 USD
SELL XAUUSD PRICE 3412 - 3410⚡️
↠↠ Stop Loss 3416
→Take Profit 1 3404
↨
→Take Profit 2 3398
BUY XAUUSD PRICE 3324 - 3326⚡️
↠↠ Stop Loss 3320
→Take Profit 1 3332
↨
→Take Profit 2 3338
Weekly Market Forecast: Monday UPDATES!How accurate were the forecasts for S&P 500, NASDAQ, DOW JONES, Gold and Silver futures given in the Weekly Market Forecast for this week?
BULLSEYE!
Enjoy!
May profits be upon you.
Leave any questions or comments in the comment section.
I appreciate any feedback from my viewers!
Like and/or subscribe if you want more accurate analysis.
Thank you so much!
Disclaimer:
I do not provide personal investment advice and I am not a qualified licensed investment advisor.
All information found here, including any ideas, opinions, views, predictions, forecasts, commentaries, suggestions, expressed or implied herein, are for informational, entertainment or educational purposes only and should not be construed as personal investment advice. While the information provided is believed to be accurate, it may include errors or inaccuracies.
I will not and cannot be held liable for any actions you take as a result of anything you read here.
Conduct your own due diligence, or consult a licensed financial advisor or broker before making any and all investment decisions. Any investments, trades, speculations, or decisions made on the basis of any information found on this channel, expressed or implied herein, are committed at your own risk, financial or otherwise.

XAUUSD Critical Lower Highs break-out just happened.Gold (XAUUSD) broke above the Lower Highs trend-line that originated from the April 22 All Time High (ATH) and has basically re-established the long-term bullish trend and confirmed the bullish break-out.
The extension can go as high as 3700, which represents a +18.37% rise from the 1D MA50 (red trend-line) bottom. That is how much the last 1D MA50 (near) test increased (April 07). A Higher Lows trend-line (dashed) may potentially support this uptrend all the way before the next correction.
-------------------------------------------------------------------------------
** Please LIKE 👍, FOLLOW ✅, SHARE 🙌 and COMMENT ✍ if you enjoy this idea! Also share your ideas and charts in the comments section below! This is best way to keep it relevant, support us, keep the content here free and allow the idea to reach as many people as possible. **
-------------------------------------------------------------------------------
Disclosure: I am part of Trade Nation's Influencer program and receive a monthly fee for using their TradingView charts in my analysis.
💸💸💸💸💸💸
👇 👇 👇 👇 👇 👇

GOLD expected to rebound, key trends, jobs data This week, we have the facts that Trump has stirred up the market, Powell has not changed his stance. With the biggest data of the week, the US Non-Farm Payrolls, to be released, the price of OANDA:XAUUSD is expected to rise again after a week of consolidation.
Last Week in News
After weeks of tariff-easing talks that sent U.S. stocks soaring, Wall Street has once again been caught up in the constant flux surrounding Trump’s trade regime. This week, a U.S. court also questioned the legality of the White House’s tariffs on global trading partners as the Trump administration ramps up its policy plans.
Market sentiment took a turn for the worse on Friday following news about tariffs. US media reported that the White House plans to impose broader sanctions on some foreign technology industries. In addition, Trump said that starting next week, tariffs on imported steel will increase from 25% to 50%.
In addition to the tariff headlines, traders also had to contend with weakening US economic data. US consumer spending slowed after recording its strongest month of growth since early 2023 in April.
Here are the events markets will focus on in the new week
• Next week, Federal Reserve Chairman Powell and several members of the board and voting members will speak.
• Trump met with Powell for the first time in his second term, and Powell continued to emphasize the independence of monetary policy.
The US core PCE inflation rate was 2.1% year-on-year in April, slightly below the expected 2.2%. While that bolsters the case for a rate cut, Fed officials have reiterated their patient stance.
Minutes from the May FOMC meeting confirmed that policymakers considered the current economic situation sufficient to delay policy action. Despite the weakening sentiment, traders are still betting on a September rate cut from the Federal Reserve.
Key Data: Non-farm data in focus this week
The focus of next week’s data will be non-farm payrolls on Friday. The pace of hiring in the US is likely to have slowed in May as households became more cautious, businesses reconsidered investment plans amid shifting trade policies and employers focused on controlling costs.
Economists are forecasting a gain of 125,000 in May, according to the median in a Bloomberg survey, after job gains beat expectations in March and April. That would keep the average gain over the past three months at a solid 162,000. The unemployment rate remains at 4.2%. Fed officials are also waiting for clarity on how trade and tax policies will affect the economy and inflation, so they are likely to be cautious about the labor market report.
Technical Outlook Analysis OANDA:XAUUSD
On the daily chart, gold has been mostly sideways despite the volatility over the past week. The sharpest drop saw gold test the $3,250 support level before recovering to close the week around the confluence of the EMA21 and the 0.382% Fibonacci retracement.
On the big picture, gold is still technically bullish with the channel as the main trend, while the near-term supports are the $3,250 level followed by the 0.50% Fibonacci retracement. A sustained move above $3,300 would be viewed as a positive factor going forward.
On the momentum front, the Relative Strength Index (RSI) remains above 50, which in this case acts as momentum support and is still well away from overbought territory so there is still room for upside. The weekly target is the 0.236% Fibonacci retracement level in the short term, rather than the raw price point of $3,400.
As long as gold remains within the channel, its main technical trend is bullish, and any declines that do not take gold below the channel should be considered short-term corrections rather than a specific trend.
Next week, the technical bullish outlook for gold will be focused again on the following positions.
Support: $3,250 – $3,228
Resistance: $3,371
SELL XAUUSD PRICE 3337 - 3335⚡️
↠↠ Stop Loss 3341
→Take Profit 1 3329
↨
→Take Profit 2 3323
BUY XAUUSD PRICE 3246 - 3248⚡️
↠↠ Stop Loss 3242
→Take Profit 1 3254
↨
→Take Profit 2 3260

Weekly Market Forecast: Stocks, Gold, Silver & Crude OilIn this Weekly Market Forecast, we will analyze the S&P 500, NASDAQ, DOW JONES, Gold and Silver futures, for the week of June 2 - 6th.
Stock Indices are looking more bullish than bearish. Valid buys only!
Gold is moving sideways. Wait for confirmation before a buy/sell signal.
Oil prices may tick lower. Trade carefully.
Enjoy!
May profits be upon you.
Leave any questions or comments in the comment section.
I appreciate any feedback from my viewers!
Like and/or subscribe if you want more accurate analysis.
Thank you so much!
Disclaimer:
I do not provide personal investment advice and I am not a qualified licensed investment advisor.
All information found here, including any ideas, opinions, views, predictions, forecasts, commentaries, suggestions, expressed or implied herein, are for informational, entertainment or educational purposes only and should not be construed as personal investment advice. While the information provided is believed to be accurate, it may include errors or inaccuracies.
I will not and cannot be held liable for any actions you take as a result of anything you read here.
Conduct your own due diligence, or consult a licensed financial advisor or broker before making any and all investment decisions. Any investments, trades, speculations, or decisions made on the basis of any information found on this channel, expressed or implied herein, are committed at your own risk, financial or otherwise.

Natural Gas | Oil | Dollar | Silver | Gold Price ForecastNatural Gas | Oil | Dollar | Silver | Gold Price Forecast
NYMEX:NG1! NYMEX:CL1! COMEX:GC1! COMEX:SI1!

Gold 01.06.2025, SundayExpecting bullish price delivery on gold to make a All Time Highs. Before the meltdown on the quarterly Fair Value Gap

GOLD MARKET ANALYSIS AND COMMENTARY - [Jun 02 - Jun 06]During the week, OANDA:XAUUSD fluctuated in the range of 3,245 - 3,331 USD/oz and closed the week at 3,289 USD/oz. The reason for the sideways gold price was due to the lack of strong information. The US Court of International Trade's ruling on blocking the Trump administration's tariff policy was postponed, while the US PCE index in April increased by only 2.5%, down from the previous month, not enough to influence the FED's policy in the context of prolonged trade instability.
If the Court continues to block the tariffs, President Trump can still use several laws to maintain the tariffs:
🔹Section 122 - Trade Act of 1974: Allows for a 15% across-the-board tariff for 150 days; then requires congressional approval to extend.
🔹Section 338 - Trade Act of 1930: Allows for tariffs of up to 50% on goods from countries deemed to discriminate against the United States.
🔹Section 232 - Trade Expansion Act of 1962: Allows for the expansion of tariffs from items such as aluminum, steel, and automobiles to other industries on national security grounds.
US Treasury Secretary Scott Bessent said that US-China trade negotiations are still at a standstill due to many complicated issues, requiring direct intervention from the leaders of the two countries. Although the tariff war is still complicated, the most tense phase has passed. Therefore, in the short term, gold prices are unlikely to exceed the $3,500/oz mark and will likely continue to adjust and accumulate in the $3,100-$3,400/oz range.
Although gold prices are currently stuck in a range, the US economic data released next week, especially the May non-farm payrolls (NFP) report on Friday, could cause a sharp move. The NFP is forecast to come in at 130,000 jobs, down from 177,000 in April. If true, this could reinforce expectations that the Fed will cut interest rates to support the labor market, thereby supporting gold prices. Conversely, if the NFP is stronger than expected, especially higher than last month, the Fed could keep interest rates unchanged, putting downward pressure on gold prices.
📌Technically, on the H4 chart, gold prices are almost moving sideways in a narrowing range, the resistance level is established around 3325 while the support level is around 3245. Next week, gold prices are likely to increase slightly if economic and geopolitical factors continue to support, corresponding to the H1 technical chart, gold prices will increase to 3365-3415 if the price breaks through the Downtrend line and breaks the resistance zone of 3325. In case the gold price falls below the support zone of 3245, the gold price will reverse and decrease.
Notable technical levels are listed below.
Support: 3,250 – 3,228USD
Resistance: 3,300 – 3,371USD
SELL XAUUSD PRICE 3327 - 3325⚡️
↠↠ Stop Loss 3431
BUY XAUUSD PRICE 3203 - 3205⚡️
↠↠ Stop Loss 3199

GOLD Consolidation not over but long term still bullish.Gold / XAUUSD hasn't changed it's long term trend, which remains bullish inside a Channel Up since October 2023.
However, it is more likely than not, to extend the consolidation it is having since April 21st, which is no different than the 3 previous consolidation phases this Channel Up had.
After they got completed, strong rallies followed, the less strong of which was +18.51%.
Stay bullish, target 3700.
Follow us, like the idea and leave a comment below!!

GOLD eases, fundamental support and technical momentumOANDA:XAUUSD fell in early Asian trading on May 30 after Thursday's gains, although it still had room to rise as weak US initial jobless claims data weighed on the US dollar and Trump's tariffs faced more uncertainty.
Gold recovered from a weekly low of $3,245 an ounce on Thursday to break above the $3,300 an ounce mark as weak US initial jobless claims data weighed on the US dollar.
As of press time, gold had fallen below the full price of $3,300, down $23 on the day and around 0.69% .
The number of Americans filing new claims for unemployment benefits rose more than expected last week, adding to pressure on the Federal Reserve to consider cutting interest rates.
Data released on Thursday showed the number of Americans filing new claims for unemployment benefits rose last week, exceeding market expectations. The data showed initial jobless claims in the United States rose by 14,000 to 240,000 in the week ended May 24, compared with estimates of 230,000.
According to the minutes of the Federal Reserve's May 6-7 meeting, policymakers acknowledged that they could face "difficult trade-offs" in the coming months, as both inflation and unemployment rise, raising the risk of a recession. Since gold does not yield interest, it typically performs well in low-interest-rate environments.
Trump Tariff Ruling Overturned
A U.S. trade court ruled on Wednesday that the president lacked the authority to impose tariffs, blocking most of Trump's tariffs, but on Thursday a federal appeals court agreed to the Trump administration's request to suspend the court's ruling.
The U.S. government's request for an immediate administrative stay was granted, and the rulings and permanent injunctions issued by the U.S. Court of International Trade in these cases will be temporarily suspended until further notice while the court reviews the relevant motion documents, the Court of Appeals for the Federal Circuit said in its ruling.
Investors will focus on the US personal consumption expenditure (PCE) price index, the Federal Reserve's preferred inflation gauge, on Friday. Gold is seen as a hedge against inflation during times of economic uncertainty, and higher-than-expected PCE data would benefit the US dollar and reduce the appeal of gold, leading to a possible decline in prices. The opposite effect would be seen if PCE data were lower than expected, which would increase the likelihood of an early rate cut by the Fed, leading to a depreciation of the dollar and gold benefiting from expectations of a low-interest rate environment.
Technical outlook for OANDA:XAUUSD
On the daily chart, gold is down but currently the downside momentum has been limited by the initial support area which is the confluence of EMA21 with Fibonacci retracement 0.382%, this support area has been noted by readers in the publications since the beginning of this trading week.
Temporarily, gold does not have enough technical conditions to be able to increase in price in the short term, because it is still under pressure from the price channel. However, in terms of the overall and long-term trend, gold still has a main trend of increasing price, a trend noted by the price channel.
In terms of momentum, the Relative Strength Index (RSI) is still holding above 50, with the current RSI position at 50 being considered as the nearest support in terms of momentum.
A sustained price action above the 3,300ISD price point would be considered a positive signal, while a break above the channel would qualify the bulls for a short-term target of 3,371USD.
For the day, the technical outlook for gold is bullish and the key points to watch are listed below.
Support: 3,292USD – 3,250USD
Resistance: 3,371USD
SELL XAUUSD PRICE 3342 - 3340⚡️
↠↠ Stop Loss 3346
→Take Profit 1 3334
↨
→Take Profit 2 3328
BUY XAUUSD PRICE 3203 - 3205⚡️
↠↠ Stop Loss 3199
→Take Profit 1 3211
↨
→Take Profit 2 3217

XAUUSD: The LH trendline is the difference maker.Gold is neutral on its 1D technical outlook (RSI = 54.327, MACD = 32.010, ADX = 35.582), staying under the high impact LH trendline that has been keeping the medium term trend bearish since the April 22nd High. As long as the price is under it, we are short, aiming for the S1 level (TP = 3,246) and not below it as the 1D MA50 offers long term support. If the price closes a 1D candle over the LH trendline, we will turn long and aim for a +7.39% rise from the bottom (TP = 3,485), which has already taken place twice in the past 30 days.
## If you like our free content follow our profile to get more daily ideas. ##
## Comments and likes are greatly appreciated. ##

Gold: Primarily HigherIn our primary scenario, we expect gold to set a new all-time high as part of the ongoing beige wave I. To achieve this, the price should soon generate more upward momentum during the subordinate light green wave 5 and surpass the current all-time high from April 22. Once the wave I cycle has concluded at higher levels, we anticipate the start of a new bearish phase. However, there remains a 40% chance that the precious metal has already completed the beige wave alt.I and is now entering a fresh downward cycle. Under this alternative scenario, the price would break directly below the supports at $3,123 and $2,970.
📈 Over 190 precise analyses, clear entry points, and defined Target Zones - that's what we do.
