GOLD is supported short, trend is bearishThe bargain-hunting wave has supported OANDA:XAUUSD in the short term. In addition, weaker-than-expected US CPI in April, cooling expectations for a Fed rate cut, a fall in the US Dollar Index from a one-month high, and geopolitical concerns have all provided bullish momentum for gold. Spot gold was trading in a narrow range in early trading on Wednesday (May 14), currently trading around $3,245/ounce.
Inflation data
Data from the US Labor Department, a key indicator of Federal Reserve policy, released on Tuesday showed that the CPI rose just 0.2% month-on-month in April, below the expected 0.3%.
This mild inflation report is like a tonic, injecting new life into gold prices. This data will not hinder the Fed's interest rate cut, and the market generally expects the Fed to cut interest rates again in September.
It is worth noting that while inflationary pressures are not high now, inflation could pick up again in the coming months as the impact of tariffs becomes clear. Such expectations are prompting many investors to turn to gold as an inflation hedge.
On the same day on Tuesday, Do Nam Trung once again called on the Federal Reserve to cut interest rates
On Tuesday, Trump reiterated his call for the Federal Reserve to cut interest rates, saying that the prices of gasoline, groceries and “almost everything else” are falling.
Geopolitics: “Safe Haven Fire”
In addition to economic factors, continued tensions in the global geopolitical situation also provide strong support for gold. The possible face-to-face talks between Ukrainian President Zelensky and Russian President Putin are fraught with uncertainty, and despite a temporary ceasefire in the India-Pakistan conflict, the underlying tensions between the two sides have not changed. These uncertainties mean that gold still has the potential to rise in price once market risks suddenly occur.
Looking Ahead: Gold’s Challenges
Looking ahead, gold faces three key variables:
• First, the further progress of the Sino-US trade talks. Although the two sides have reached a 90-day truce, the comprehensive tariff policy remains in effect.
• Second, the Federal Reserve's monetary policy direction. A soft performance in inflation data could pave the way for a rate cut.
• Finally, global geopolitical risks, especially the developments in the Russia-Ukraine peace talks and the India-Pakistan conflict.
There is relatively little economic data on the trading day. US Secretary of State Rubio will attend the informal meeting of NATO foreign ministers from May 14 to 16 to discuss NATO security priorities, including increased defense spending and ending the Russia-Ukraine war. In addition, several Federal Reserve officials will speak, which investors should pay attention to.
Technical Outlook Analysis OANDA:XAUUSD
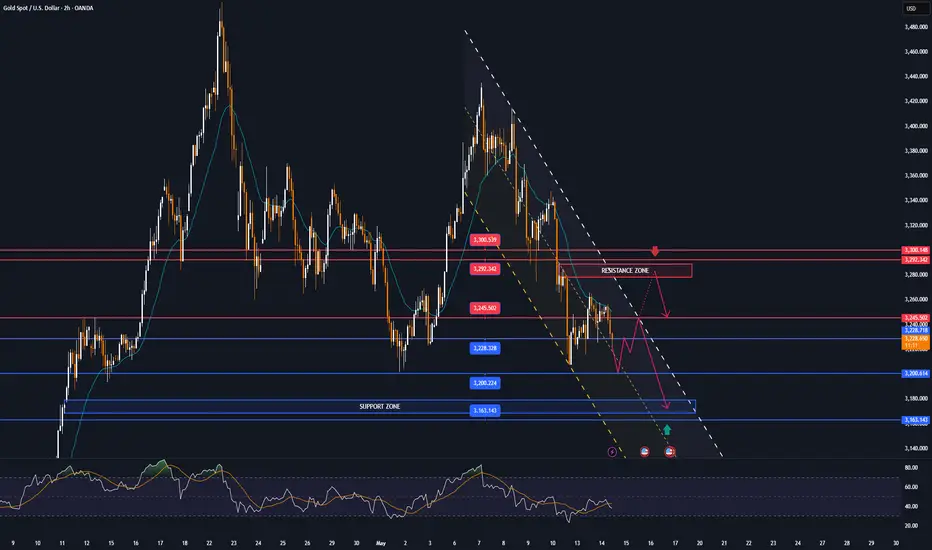
On the daily chart, gold is still trading in a narrow range with short-term conditions leaning towards the downside with the main pressure from the EMA21.
However, the downside momentum is currently limited by the 0.50% Fibonacci retracement level, which is also the nearest support. If gold is sold below $3,228, it will have the prospect of continuing to decline with the next target around $3,163 in the short term.
For gold to resume its uptrend, the necessary condition is that the price action needs to be pushed above the EMA21 and break above the raw price level of 3,300 USD.
Although the main trend from the price channel has not been broken yet, the short-term outlook for gold is bearish, and the notable positions will also be listed as follows.
Support: 3,228 – 3,200 – 3,163 USD
Resistance: 3,245 – 3,292 – 3,300 USD
SELL XAUUSD PRICE 3284 - 3282⚡️
↠↠ Stop Loss 3288
→Take Profit 1 3276
↨
→Take Profit 2 3370
BUY XAUUSD PRICE 3165 - 3167⚡️
↠↠ Stop Loss 3161
→Take Profit 1 3173
↨
→Take Profit 2 3179
GC1! (Gold Futures)
Markets turn their attention to US CPISafe-haven OANDA:XAUUSD fell nearly 3% on Monday (May 12) and continued to decline slightly in early trading on Tuesday (May 13), mainly due to the easing of market risk sentiment after the United States and China announced a temporary “ceasefire” in their trade war.
According to a joint statement released by the United States and China on Monday, the United States will reduce the tariffs imposed on Chinese goods in April this year from 145% to 30%, and China will reduce the tariffs imposed on American goods from 125% to 10%. The new measures will take effect in 90 days.
Gold prices fell more than 3% on Monday as risk sentiment improved after the US and China agreed to roll back tariffs for 90 days during talks over the weekend. This sent the US dollar soaring to its highest level in more than a month and global stocks rebounding strongly after the US and China reached an interim tariff deal. Meanwhile, gold sold off sharply as market sentiment began to shift back to risk assets, making the yellow metal less attractive.
China and the United States announced in Geneva, Switzerland, that they have reached an important economic and trade agreement. Both sides will also further reduce tariffs on each other's goods, with the total reduction exceeding 100%. The breakthrough marks a major turning point in the years-long tariff war between China and the United States. After implementing the measures, the two sides will establish a mechanism to continue negotiations on economic and trade relations, Xinhua News Agency reported.
Investors' attention turns to the US Consumer Price Index (CPI) report due out on Tuesday for a gauge of the Federal Reserve's policy direction. Other key US data this week include the Producer Price Index (PPI) and retail sales. Economists expect the US CPI to have risen by 2.4% year-on-year in April. Excluding volatile items, the core CPI growth rate is expected to have been unchanged at 2.8% year-on-year.
While the underlying market is under pressure from positive factors from trade to geopolitics, we (individual investors in the short term) still need to pay special attention to the erratic behavior of Do Nam Trung. A status line that brings tariff risks will push gold to increase strongly again.
Technical Outlook Analysis OANDA:XAUUSD
On the daily chart, a drop below the 0.50% Fibonacci retracement level would be a bullish signal for further downside with a target of around $3,163 in the short term, which is where the 0.618% Fibonacci retracement level is located.
In terms of momentum, gold is showing bearish signals as the RSI falls below 50 and the next target is the overbought zone, with the current RSI position, gold still has a lot of room to fall.
The most important condition for gold to be able to be assessed to increase in price again is that it needs to bring the price activity above the base price of 3,300 USD, then the target could be 3,371 USD. Otherwise, with the current market position and context, the short-term downtrend is dominant.
During the day, the possibility of a decline in gold prices will be noticed by the following technical positions.
Support: 3,228 - 3,200 - 3,163 USD
Resistance: 3,245 - 3,267 - 3,292 USD
SELL XAUUSD PRICE 3283 - 3281⚡️
↠↠ Stop Loss 3287
→Take Profit 1 3275
↨
→Take Profit 2 3369
BUY XAUUSD PRICE 3220 - 3222⚡️
↠↠ Stop Loss 3216
→Take Profit 1 3228
↨
→Take Profit 2 3234

XAUUSD first time to hit the 4H MA200 in a month.Gold (XAUUSD) hit its 4H MA200 (orange trend-line) today for the first time since April 08. That was a Higher Low at the bottom of the Bullish Megaphone pattern and produced its Aril 22 All Time High (ATH).
Since then, the market has been correcting under a Lower Highs trend-line, due to the de-escalation of the Trade War and today's 4H MA200 is so far a Double Bottom on a potential Descending Triangle.
Its last Bullish Leg peaked on the 0.786 Fibonacci retracement level, so we are now turning bullish targeting 3375 (current 0.786 Fib).
-------------------------------------------------------------------------------
** Please LIKE 👍, FOLLOW ✅, SHARE 🙌 and COMMENT ✍ if you enjoy this idea! Also share your ideas and charts in the comments section below! This is best way to keep it relevant, support us, keep the content here free and allow the idea to reach as many people as possible. **
-------------------------------------------------------------------------------
Disclosure: I am part of Trade Nation's Influencer program and receive a monthly fee for using their TradingView charts in my analysis.
💸💸💸💸💸💸
👇 👇 👇 👇 👇 👇

GOLD MARKET ANALYSIS AND COMMENTARY - [May 12 - May 16]This week, the international OANDA:XAUUSD increased from 3,210 USD/oz to 3,434 USD/oz, but immediately after that, the gold price dropped sharply to 3,274 USD/oz and closed this week at 3,325 USD/oz.
The reason why the gold price was sold off at the end of the week was because the FED said it would not rush to cut interest rates, because inflation is potentially at risk of increasing due to the impact of tariffs from the Trump administration, while the US economy, especially the labor market, is also at risk of decline. This risks pushing the US economy into a state of stagflation.
In addition, after the US and UK reached a trade agreement, the US side said that there will be more trade agreements with major economies in the near future. Notably, this weekend, the US and China also entered the first round of trade negotiations under President Trump in his second term in Switzerland. This has made many investors concerned that the cooling of the trade war will reduce the role of gold as a safe haven.
Factors affecting gold prices next week:
Federal Reserve (Fed) policy: The Fed currently keeps interest rates at 4.25% - 4.5%, and the market is waiting for new economic data (such as May CPI and employment report). If inflation continues to decline or there are signs that the Fed will cut interest rates in the near future, gold prices may be strongly supported. On the contrary, if the Fed maintains a "hawkish" stance (keeping interest rates high), gold prices may be under downward pressure.
US-China trade negotiations: Optimism about the possibility of a trade agreement between the US and China (expected to be negotiated in Switzerland) is reducing the demand for safe haven gold. If there is positive news (forecast: tax reduction from 145% to 80%), gold prices may adjust down. On the contrary, if negotiations fail or tensions escalate, gold will increase sharply.
Global instability: Geopolitical risks (such as Middle East conflicts, Russia-Ukraine tensions, India-Pakistan tensions) are still the driving force supporting gold prices. If there are unexpected developments, gold demand will increase.
📌Technically, gold prices next week are likely to fluctuate within the range of 3,200 - 3,400 USD/ounce, with the base scenario being sideways or slightly increasing. If gold breaks the trendline and surpasses the resistance level of 3435, the next level is that gold can conquer the old peak or create a new high. Meanwhile, if the support level of 3200 is broken, gold prices are at risk of falling deeply below the threshold of 3,100 USD/oz. However, factors such as US economic data, Fed policy, and developments in US-China negotiations will be the key to determining the trend. Investors need to closely monitor these events and apply flexible trading strategies.
Notable technical levels are listed below.
Support: 3,300 – 3,292 – 3,267USD
Resistance: 3,351 – 3,371USD
SELL XAUUSD PRICE 3402 - 3400⚡️
↠↠ Stop Loss 3406
BUY XAUUSD PRICE 3215 - 3217⚡️
↠↠ Stop Loss 3211

NQ Outlook for CPI week. CME_MINI:NQ1!
Expecting massive meltdown on Indexes. But need more data to confirm. Neutral at this point. Waiting for more prints.
Gun to my head, I want all out meltdown right from Monday after tagging Monthly FVG C.E

Natural Gas | Oil | Dollar | Silver | Gold Price ForecastNatural Gas NYMEX:NG1! | Oil | Dollar | Silver | Gold Price Forecast
OANDA:XAUUSD NYMEX:CL1!

GOLD falls sharply then recovers slightly from key confluenceOANDA:XAUUSD fell sharply and recovered slightly, as expectations of more such deals increased after US President Donald Trump announced a “groundbreaking” trade deal with the UK, undermining the metal’s appeal as a safe-haven asset.
The US and UK have reached a deal and markets are expecting more “tariff-free” avenues
Trump and UK Prime Minister Keir Starmer jointly announce the signing of a trade deal
• The UK will reduce tariffs on US goods from 5.1% to 1.8%;
• The US will maintain a uniform tariff of 10% on UK imports;
• The UK will further ease market access for US goods.
The US and China will continue high-level talks this Saturday
US Treasury Secretary Scott Bessent and Trade Representative Jamieson Greer will meet with top Chinese economic officials in Switzerland on Saturday to discuss the outlook for trade relations.
Gold prices have hit record highs in recent months, largely due to global tensions caused by Trump's tariff policies.
China's central bank allows banks to buy foreign currency to import gold, signaling potential support
The People's Bank of China has approved commercial banks to buy foreign currency in the latest quota to pay for gold imports, supporting the possibility of increased physical gold demand in the market in the future.
With the implementation of the US-UK agreement, the recovery of risk appetite in the market and the approaching US-China negotiations, the safe-haven demand for gold has temporarily eased, and technical downward pressure has also emerged.
In addition, traders need to pay special attention to geopolitical developments with the focus on Russia - Ukraine when Ukraine has taken actions despite Russia's warnings on May 9.
Any escalation of the conflict will immediately support gold's sudden price increase.
Analysis of OANDA:XAUUSD technical outlook
On the daily chart, after a sharp decline from the weekly target of $3,430, gold's decline has paused and recovered slightly from the 0.382% Fibonacci retracement level. The area around $3,292 is also an important support area as it is a confluence of important technical support factors, with the appearance of EMA21 (major support), the lower edge of the price channel which is the short-term trend price channel and the 0.382% Fibonacci retracement level.
As long as gold remains above $3,292, it still has a bullish outlook in the short term, and in case gold falls below this level, it will likely test technical support at $3,267 in the short term, more than $3,245.
For the day, with the current position, gold still has a bullish outlook, and the notable points will be listed as follows.
Support: $3,300 – $3,292 – $3,267
Resistance: $3,351 – $3,371
SELL XAUUSD PRICE 3334 - 3332⚡️
↠↠ Stop Loss 3338
→Take Profit 1 3326
↨
→Take Profit 2 3320
BUY XAUUSD PRICE 3259 - 3261⚡️
↠↠ Stop Loss 3255
→Take Profit 1 3267
↨
→Take Profit 2 3273

Gold's Correction May Not be Over Yet - Here's WhyHere is my 2-minute technical take on why gold could be looking at a break below 3200 as part of a deeper correction, before it even considers resuming its almighty bullish rally.
Matt Simpson, Market Analyst at City Index and Forex.com

Down nearly 2% on Wednesday, GOLD still rebounds quickly on riskOANDA:XAUUSD fell nearly 2% on Wednesday (May 7), mainly due to a stronger US dollar and optimism from upcoming trade talks between the United States and China, while the Federal Reserve's "standstill" also added pressure on gold prices. However, it was supported by escalating geopolitical risks.
On Wednesday, the Federal Open Market Committee (FOMC) left the target range for the federal funds rate unchanged at 4.25%-4.50%, citing increasing uncertainty about the economic outlook and rising risks to both maximum employment and price stability. “Uncertainties about the economic outlook continue to increase,” the FOMC said in its post-meeting statement. “The Committee is concerned about bilateral risks to its dual mandate and sees increasing risks to unemployment and inflation.”
Federal Reserve Chairman Powell maintained a neutral tone, saying the current policy stance was appropriate and the Fed was in no rush to adjust interest rates. He stressed that the Fed was prepared to act “quickly as needed” if circumstances changed, but warned that the Fed’s goals would not be fully achieved if tariffs remained in place.
Powell added that if either side of the dual mandate deviates too much, the Fed will evaluate which policy tool to use to achieve rebalancing.
When asked which mandate, inflation or employment, should receive more attention, he said it was too early to tell.
The market consensus remains that the Fed will not cut rates before July. In a higher interest rate environment, non-interest-bearing gold is often under pressure.
Big news on China-US trade talks
China and the US announced that US Treasury Secretary Besant and US Trade Representative Greer will travel to Switzerland to meet with Chinese Vice Premier He Lifeng.
The talks are the first since US President Donald Trump imposed comprehensive tariffs on China and have raised optimism that the two largest economies can reach a deal.
On Wednesday, a spokesperson for the Chinese Ministry of Commerce answered reporters' questions about the high-level economic and trade negotiations between China and the United States. The spokesperson said China has decided to cooperate with the United States. Vice Premier He Lifeng, as head of the China-US economic and trade negotiation delegation, will hold talks with his US counterpart, US Treasury Secretary Benson, during his visit to Switzerland. - Bloomberg -
India-Pakistan tensions spiral after attack, risk of further escalation fuels demand for safe havens
India's airstrike on Pakistan has stoked tensions, raising fears of a full-blown war between the two nuclear-armed nations.
India launched missiles at nine locations in Pakistan and Pakistan-administered Kashmir early on May 7 in response to a shooting that killed 26 tourists in Pahalgam, Jammu and Kashmir, two weeks ago. The Indian Ministry of Defense said its forces struck facilities used by "terrorist groups" to carry out the Pahalgam attack.
The Indian Air Force has mobilized many modern weapons, including Rafale multi-role fighters carrying SCALP-EG stealth cruise missiles and AASM Hammer extended-range guided bombs and cruise missiles. The target coordinates were provided to the forces participating in the campaign by Indian intelligence agencies.
Images released by the media show the moment the series of missiles crashed into the target, creating large fire circles and violent explosions. Pakistan said at least 26 people were killed in this attack. -According to Vnexpress -
Gold is an asset that often benefits first when market risks appear, and India is also a leading gold-using country in the world.
Technical Outlook Analysis OANDA:XAUUSD
After yesterday's decline, gold continues to receive support from the 0.236% Fibonacci retracement area with horizontal support at $3,350 as noted by readers in yesterday's edition and it is now also aiming for a target of $3,430.
Once gold breaks $3,430 it will be in a position to continue its rally with a target of around (all-time high) in the short term.
Technical factors are completely bullish, from the short-term trend noted by the rising price channel and the long-term trend from the rising price channel. On the other hand, the nearest support is also the EMA21.
The relative strength index RSI is still quite far from the 80 level and the overbought area, indicating that there is still room for growth ahead and gold is likely to continue to increase in terms of momentum in the coming time.
During the day, the main bullish outlook for gold prices in terms of technology will be noted again by the following levels.
Support: 3,371 – 3,350 USD
Resistance: 3,430 – 3,500 USD
SELL XAUUSD PRICE 3440 - 3438⚡️
↠↠ Stop Loss 3444
→Take Profit 1 3432
↨
→Take Profit 2 3426
BUY XAUUSD PRICE 3350 - 3352⚡️
↠↠ Stop Loss 3346
→Take Profit 1 3358
↨
→Take Profit 2 3364

US-China optimism, GOLD falls sharply from target levelIn early morning trading on Wednesday (May 7), spot OANDA:XAUUSD fell sharply by nearly 2%. Bloomberg said that despite the escalation of military conflict between India and Pakistan, signs of progress in trade negotiations between the United States and China have limited demand for safe-haven assets.
Previously, gold prices had surged for two consecutive trading days. Spot gold prices rose nearly 3% on Tuesday.
China and the United States announced that U.S. Treasury Secretary Besant and U.S. Trade Representative Greer will travel to Switzerland to meet with Chinese Vice Premier He Lifeng.
Today (Wednesday), a spokesperson for the Chinese Ministry of Commerce answered reporters' questions about the high-level economic and trade negotiations between China and the United States. The spokesperson said that China has decided to cooperate with the United States.
Vice Premier He Lifeng, as head of the China-US economic and trade negotiation team, will hold talks with his US counterpart, US Treasury Secretary Benson, during a visit to Switzerland. It is the first such meeting since US President Donald Trump imposed sweeping tariffs on China and has raised optimism that the two largest economies could reach a deal.
Gold prices have risen nearly 30% this year as Trump’s aggressive trade and geopolitical policies have caused widespread market turmoil and investors have sought safe havens. Gold hit a record high of $3,500 an ounce in April but has fallen in recent weeks.
The Federal Reserve will announce its interest rate decision later Wednesday, and policymakers are expected to keep rates unchanged despite Trump’s repeated criticism of Fed Chair Powell for not cutting rates.
Fed officials have often stressed the need to wait and see how the trade policies implemented last month will affect the economy. Lower borrowing costs tend to be good for gold.
Technical Outlook Analysis OANDA:XAUUSD
After gold achieved the target increase noted by readers in yesterday's edition at 3,430 USD, it has fallen significantly in the early trading session today (7 May). But the downside momentum is also limited by the 0.236% Fibonacci retracement level, which is noted as the nearest support level and for gold to continue to increase in price, it needs to achieve the condition of recovering and breaking the 3,430 USD level after which traders can think about the 3,500 USD level in the near future.
During the day, in the overall picture, gold still has a bullish outlook with the long-term rising price channel and the short-term rising price channel as the trend and support from the EMA21 moving average.
As long as gold remains above the EMA21 and within/above the aforementioned price channels, the overall outlook remains bullish, but you should also note that in the current market environment, price movements of 2-3%/day are very common, so technical positions need to be firmly established (preferably at confluences where multiple indicators are present).
My notable positions will be listed as follows.
Support: 3,371 – 3,350 USD
Resistance: 3,400 – 3,430 USD
SELL XAUUSD PRICE 3440 - 3438⚡️
↠↠ Stop Loss 3444
→Take Profit 1 3432
↨
→Take Profit 2 3426
BUY XAUUSD PRICE 3337 - 3339⚡️
↠↠ Stop Loss 3333
→Take Profit 1 3345
↨
→Take Profit 2 3351

XAUUSD: Channel Up aiming for 3,750Gold has turned bullish again on its 1D technical outlook (RSI = 65.582, MACD = 62.840, ADX = 38.882) as it crossed above the 4H MA50 again, following a bottom on the HL trendline of the 4H Channel Up. The 4H RSI made a DB and the new bullish wave is already underway. We expect a similar +18% rally to the top of the Channel Up (TP = 3,750).
## If you like our free content follow our profile to get more daily ideas. ##
## Comments and likes are greatly appreciated. ##

GOLD soars, geopolitical risks escalateIn the early morning trading session on Tuesday (May 6), the spot price of OANDA:XAUUSD suddenly jumped more than 50Dollar in the short term. The price of gold just hit 3,387USD/ounce, setting a new intraday high.
Trump's latest tariff announcement has increased risk-off sentiment, thereby pushing the price of gold up sharply.
WASHINGTON (Reuters) - U.S. President Donald Trump said on Sunday he plans to impose a 100% tariff on foreign-made films, extending his restrictive trade policy on U.S. imports to the entertainment industry for the first time, rekindling investor concerns about the potential fallout from a global trade war.
On Monday local time, Trump signed an executive order on biomedical research, hoping to use this opportunity to boost the US pharmaceutical industry. Trump also announced that tariffs on pharmaceutical products will be announced within the next 2 weeks.
Gold is often considered a safe haven in times of uncertainty and performs well in low interest rate environments. Gold prices have soared 26.3% this year and have set new historical records several times.
On the other hand, geopolitical tensions surrounding the conflict between Ukraine and Russia are also escalating as Ukraine actively attacks despite warnings from Russia. On May 9, Russia will solemnly celebrate the 80th anniversary of Victory Day - a significant historical milestone with the participation of many international politicians and military corps from many countries participating in the parade at Red Square.
Geopolitical risks often impact the market very quickly and dramatically, gold prices will increase sharply whenever geopolitical risks appear as dangerous as the current situation in Ukraine - Russia.
Technical analysis of OANDA:XAUUSD prospects
On the daily chart, after gold received support and recovered from the confluence area of EMA21 and 0.50% Fibonacci retracement, gold showed prospects of continuing to recover and entering a new technical bullish cycle, bringing price activity back above $3,300.
At the time of writing, gold has reached the weekly target level sent to readers in the weekly publication at $3,371, which is also the current nearest resistance. Once gold remains stable above the 0.236% Fibonacci retracement level, it will have the prospect of continuing to increase with the next target around $3,400 – $3,430 in the short term.
On the momentum front, the Relative Strength Index (RSI) has turned upward with a significant slope after receiving support from the 50 area, which should be considered a positive signal for further bullish expectations.
Intraday, the technical outlook for gold is bullish with the main support from the EMA21, the notable positions will also be listed as follows.
Support: 3,300 – 3,292 – 3,267USD
Resistance: 3,400 – 3,430USD
SELL XAUUSD PRICE 3409 - 3407⚡️
↠↠ Stop Loss 3413
→Take Profit 1 3401
↨
→Take Profit 2 3395
BUY XAUUSD PRICE 3306 - 3308⚡️
↠↠ Stop Loss 3302
→Take Profit 1 3314
↨
→Take Profit 2 3320

Gold Chart And Factor Of 3Price changes with a factor of 3 and its reaction to support and resistance levels.
3% , 6% , 9% , 12% , 15% , 18% ...

XAUUSD Channel Up intact and targeting the 1D MA50.Gold (XAUUSD) has been trading within a Channel Up since the October 30 2024 High and is currently on its latest technical Bearish Leg. The last pull-back tested the 1D MA50 (blue tend-line) before rebounding again.
As you can see the Low that this pull-back made was also on the 0.618 Fibonacci retracement level. On the current Bearish Leg, the 0.618 Fib is at 3155 and can make contact with the 1D MA50 within 1 week. That is our short-term Target, but depending on the Fed Rate Decision on Wednesday, it may be achieved earlier.
-------------------------------------------------------------------------------
** Please LIKE 👍, FOLLOW ✅, SHARE 🙌 and COMMENT ✍ if you enjoy this idea! Also share your ideas and charts in the comments section below! This is best way to keep it relevant, support us, keep the content here free and allow the idea to reach as many people as possible. **
-------------------------------------------------------------------------------
Disclosure: I am part of Trade Nation's Influencer program and receive a monthly fee for using their TradingView charts in my analysis.
💸💸💸💸💸💸
👇 👇 👇 👇 👇 👇

GOLD MARKET ANALYSIS AND COMMENTARY - [May 05 - May 09]This week, the international OANDA:XAUUSD has dropped sharply from 3,352 USD/oz to 3,201 USD/oz and closed the week at 3,240 USD/oz.
The reason for the sharp drop in gold prices is that US President Donald Trump said that the US is about to reach a trade agreement with India, Japan, South Korea, and is likely to reach a trade agreement with China, although the two sides have not had any official negotiations.
In addition, an equally important factor is that China is on holiday from May 1 to May 5, so the demand for transactions in the world's largest gold consuming country is almost non-existent. While they have been continuously buying before even though the gold price was high.
The FED meeting on May 6-7 may have a strong impact on gold prices next week. US GDP in the first quarter grew by -0.3%, while the labor market still has potential tariff risks; inflation remains stable at a high level. With these data, it is likely that the FED will maintain interest rates at current levels, but may signal that a rate cut is coming soon. According to many experts, if the FED signals that it will cut interest rates after the meeting next week, it will push gold prices to recover next week. On the contrary, if the FED maintains a wait-and-see attitude, declaring that it is not in a hurry to cut interest rates, then gold prices next week may continue to adjust.
🕹SOME DATA THAT MAY AFFECT GOLD PRICES THIS WEEK:
Next week, all eyes will be on the Federal Reserve’s monetary policy meeting on Wednesday, with an interest rate decision and a press conference from Chairman Jerome Powell following keynote remarks earlier in April.
Fed officials will then continue their participation in the Reykjavik Economic Conference in Iceland on Friday. Fed Governors Michael Barr, Lisa Cook, Philip Jefferson and Christopher Waller will be present at the conference as speakers in panels on topics including artificial intelligence, employment and monetary policy research.
In addition, investors will also watch the ISM services PMI on Monday morning and the weekly jobless claims number on Thursday.
📌Technically, if gold prices fall below $3,200/oz next week, there is a possibility of a further decline to $3,129/oz. A deeper correction could see gold prices fall to $2,980-$3,000/oz next week. If gold prices reverse and break the $3,270/oz barrier, they could continue to rise above $3,350/oz.
Notable technical levels are listed below.
Support: 3,228 – 3,163USD
Resistance: 3,245 – 3,267 – 3,292 – 3,300USD
SELL XAUUSD PRICE 3311 - 3309⚡️
↠↠ Stop Loss 3315
BUY XAUUSD PRICE 3119 - 3121⚡️
↠↠ Stop Loss 3115

GOLD recovers to initial target, confirmation point continuesOANDA:XAUUSD surged in the first half of trading on Monday (May 5), briefly surpassing the $3,270/ounce mark and marking a daily gain of more than $30. as uncertainty over U.S. tariffs spurred safe-haven flows, supporting gold prices. The Federal Reserve’s interest rate cut in June is also boosting the appeal of non-yielding gold.
Bloomberg reported on Monday that US President Donald Trump plans to impose a 100% tariff on all foreign-made films, which is not a huge deal, but it does escalate the trade war. "I am authorizing the Department of Commerce and the United States Trade Representative to immediately begin proceedings to impose a 100% tariff on all foreign-made films imported into the United States," Trump wrote on his Truth Social social media platform. "We want our movies made in the USA again!"
Gold prices have risen nearly 25% this year, hitting a record high above $3,500 an ounce in April, but have retreated in recent weeks. Bloomberg notes that factors driving gold’s recent rally include safe-haven buying fueled by Trump’s destructive trade and geopolitical policies, as well as speculative demand from China and buying by global central banks.
According to CME's "Federal Reserve Watch" on May 5: The probability of the Federal Reserve keeping interest rates unchanged in May is 96.8%, and the probability of cutting interest rates by 25 basis points is 3.2%.
The probability of the Federal Reserve keeping interest rates unchanged until June is 63.3%, the probability of cutting interest rates by 25 basis points is 35.6%, and the probability of cutting interest rates by 50 basis points is 1.1%.
Technical outlook analysis OANDA:XAUUSD
On the daily chart, gold is still bullish as the price action remains above the important support EMA21. At the same time, the price channel that is noted as the main long-term trend channel remains stable.
On the other hand, the Relative Strength Index (RSI) is also showing signs of weakness as it falls to approach the 50 level, which is noted as the closest support in terms of momentum.
Going forward, if gold rebounds above $3,245, it could rebound to the short-term target of $3,267, more than the 0.382% Fibonacci retracement level, and then the full price point of $3,300.
As long as gold remains within the price channel, its long-term trend remains bullish, but the risk of a deeper correction is when the 0.50% Fibonacci retracement level is broken below, once this level is broken below gold is at risk of further selling to $3,163 in the short term. This also means that technically gold is in an ideal support area for bullish expectations, long positions should be protected below the 0.50% Fibonacci retracement level.
In the coming period, gold has technical conditions that favor a bullish recovery, and the notable points will be listed as follows.
Support: 3,245 – 3,228USD
Resistance: 3,267 – 3,270 – 3,292USD
SELL XAUUSD PRICE 3304 - 3302⚡️
↠↠ Stop Loss 3310
→Take Profit 1 3296
↨
→Take Profit 2 3290
BUY XAUUSD PRICE 3173 - 3175⚡️
↠↠ Stop Loss 3169
→Take Profit 1 3181
↨
→Take Profit 2 3187

BUYS For the Markets. Wait for BUYS in Gold and Silver.In this video, we will analyze the S&P 500, NASDAQ, DOW JONES, Gold and Silver futures, for the week of May 5 - 9th.
The Indices are moving higher, and it's buys until they are not. Simple.
Gold is near potential support at 3201. This may present a great buying opportunity once the lows are swept. A weakened USD will help this cause.
Silver has made a bearish market structure shift (MSS), so buys are not yet on the table. If it disrespects a Daily -FVG, then sells are warranted. It is considerably weaker than Gold.
Enjoy!
May profits be upon you.
Leave any questions or comments in the comment section.
I appreciate any feedback from my viewers!
Like and/or subscribe if you want more accurate analysis.
Thank you so much!
Disclaimer:
I do not provide personal investment advice and I am not a qualified licensed investment advisor.
All information found here, including any ideas, opinions, views, predictions, forecasts, commentaries, suggestions, expressed or implied herein, are for informational, entertainment or educational purposes only and should not be construed as personal investment advice. While the information provided is believed to be accurate, it may include errors or inaccuracies.
I will not and cannot be held liable for any actions you take as a result of anything you read here.
Conduct your own due diligence, or consult a licensed financial advisor or broker before making any and all investment decisions. Any investments, trades, speculations, or decisions made on the basis of any information found on this channel, expressed or implied herein, are committed at your own risk, financial or otherwise.

Natural Gas | Oil | Dollar | Silver | Gold Price ForecastPrice action, multi time frame, trend analysis on
NYMEX:NG1! PEPPERSTONE:NATGAS AMEX:UNG | Oil | Dollar | Silver | Gold Price Forecast

GOLD Weekly Outlook 1st week of May 2025 COMEX:GC1!
Expecting another displacement towards the downside on Gold on a weekly fractal. Perfectly lined up with daily and weekly internals

Easing market risks put pressure on GOLDOANDA:XAUUSD fell to a two-week low on Thursday (May 1), mainly due to signs of easing trade tensions and a long holiday in China, the world's largest gold consumer. Investors will be looking ahead to the US non-farm payrolls report due today (Friday), which is expected to cause major market movements.
Easing trade tensions between the US and other countries have kept investors optimistic throughout the week. In addition, easing US-China trade tensions have also added to the pressure on gold as there are no additional risks to stimulate safe-haven demand.
US President Donald Trump has decided to exempt some tariffs on the auto industry and made progress on deals with India, South Korea and Japan. On Wednesday local time, Trump said there was a great chance of reaching a trade deal with China and that there were "potential" trade deals with India, South Korea and Japan, and that he was working to reach agreements with the three countries.
The Trump administration hopes to reach preliminary trade agreements with several trading partners within weeks, U.S. Trade Representative Greer said Wednesday. U.S. Commerce Secretary Mattis Lutnick said at least one trade deal is close to being announced, several others are close to being finalized, and Trump may be waiting for an opportunity to announce them all at once.
Data released on Wednesday showed the US economy contracted in the first quarter and the personal consumption expenditures (PCE) price index was flat in March, turning investors' attention to the non-farm payrolls report due out today (Friday). The US non-farm payrolls report for April will be released on May 2 (8:30 a.m. ET). Expectations for the non-farm report are that traders and economists expect the report to show 133,000 new jobs in the US, average hourly earnings increased 0.3% month-on-month (up 3.9% year-on-year), and the U3 unemployment rate remained unchanged at 4.2%.
Fed policymakers said they would keep interest rates on hold until there are clear signs that inflation is falling toward the 2% target or there is a possibility that the job market is deteriorating.
Technical Outlook Analysis OANDA:XAUUSD
Technically, gold remains in the best position for bullish expectations with support from the EMA21 and the 0.50% Fibonacci retracement. Meanwhile, the Relative Strength Index (RSI) is also reacting to the 50 level, which is considered the closest support in terms of momentum.
In the short term, if gold returns to trade above $3,270, it will be considered the best condition for a bullish recovery to end the broad-based correction.
However, if gold is sold below $3,228 and maintains its price action below this level, it will likely continue to decline with a subsequent target of around $3,163 in the short term.
In the day, considering the current position, gold still has conditions for a bullish outlook technically and the notable price levels will be listed as follows.
Support: $3,228 – $3,163
Resistance: $3,267 – $3,270
SELL XAUUSD PRICE 3270 - 3268⚡️
↠↠ Stop Loss 3275
→Take Profit 1 3262
↨
→Take Profit 2 3256
BUY XAUUSD PRICE 3174 - 3176⚡️
↠↠ Stop Loss 3170
→Take Profit 1 3182
↨
→Take Profit 2 3188

GOLD may enter accumulation when the market lacks impact Spot OANDA:XAUUSD prices were broadly steady in Asian trade on Friday (April 25) after a sharp rise in the previous trading day. The current price of gold is around $3,341/ounce, down from the $3,371 price target that readers noted in yesterday's edition. Spot gold prices jumped on Thursday, snapping a nearly 3% decline the previous day, helped by a weaker US dollar and bargain-hunting as investors kept a close eye on the latest news on tariff negotiations.
Market Highlights
Gold prices rebounded on Thursday after their biggest drop this year as bargain hunters entered the market, Bloomberg reported.
China's official broadcaster CCTV reported Thursday that the Wall Street Journal reported that Trump is considering a plan to impose tiered tariffs on China, and White House press secretary Levitt said Trump's stance on tariffs on China "has not softened."
"This is all fake news. As far as I know, China and the United States have never consulted or negotiated on tariffs, let alone reached an agreement. This tariff war was initiated by the United States, and China's attitude is consistent and clear: if you want to fight, we will fight to the end; if you want to negotiate, the door is open. Dialogue and negotiation must be equal, respectful and mutually beneficial," said Chinese Foreign Ministry spokesman Guo Jiakun.
Cleveland Fed President Hammack made it clear in an interview on Thursday that the Fed has essentially ruled out a rate cut in May. But she also delivered a key message, saying that if there is clear evidence of the economy’s direction, there will be room for policy action in June.
When asked if a rate cut was possible in June, Hammack said: “If we get clear and compelling data in June, then I think the committee will act, assuming we have a clear understanding of the right path for policy at that point.” Markets reacted quickly after Hammack’s remarks, with interest rate swaps indicating the likelihood of a rate cut by the Federal Reserve in June rising to around 65%.
Technical Outlook Analysis OANDA:XAUUSD
After achieving the target increase twice, which readers should pay attention to in the previous day's publication at 3,371 USD, the price point of the Fibonacci retracement of 0.236%, the recovery momentum of gold is being controlled and limited.
In the short term, gold is likely to enter a sideways accumulation phase, waiting for more fundamental breakthroughs. The expected accumulation area is around 3,371 - 3,292 USD, which are the positions of the Fibonacci retracement of 0.236% and 0.382%.
However, with the current position, the main outlook is still bullish in the long term with the trend from the price channel as the main trend and support from the EMA21 as the main support.
During the day, the expectation of short-term accumulation in the main uptrend will be noted by the following levels.
Support: 3,300 – 3,292 USD
Resistance: 3,371 USD
SELL XAUUSD PRICE 3411 - 3409⚡️
↠↠ Stop Loss 3415
→Take Profit 1 3403
↨
→Take Profit 2 3397
BUY XAUUSD PRICE 3204 - 3206⚡️
↠↠ Stop Loss 3200
→Take Profit 1 3212
↨
→Take Profit 2 3218

Gold Pushing Up
Hello Traders,
We have a good buy signal from the VPS (Volume Power System) in the gold market.
