$GDXJ Junior Miners looking to hold key supportJuniors looking to hold key support. Nice bullish engulfing weekly candle. $GDXJ $GDX #gold #silver $GLD $SLV. A break above that downtrend line would be a solid entry
GDX


Gold : short term decline then rally to 1587?Gold has reached the target I mentioned on my last idea AND without much retracement. At this point it's best to take profits on gold longs or tighten stops. a decline to 1430-1400 is probable at this point and then a rally to next target 1587
**If you're interested in joining a group of like-minded traders, send me a PM. This is NOT a subscription service, just bunch of average traders sharing insights in a FREE group

THE WEEK AHEAD: ANF, BBY EARNINGS; XOP, EWZ, GDX, SMHIt's a short market week here, but this is what we've got ... .
EARNINGS:
HPE (43/33): Announces Monday after market close.
ANF (85/80): Announces Tuesday before market open.
BBY (70/42): Announces Tuesday before market open.
HPQ (50/36): Announces Tuesday after market close
DE (34/29): Announces Wednesday before market open.
Of these, ANF and BBY appear most appealing from a volatility contract standpoint.
The setup pictured here is an ANF 16 short straddle in the December 20th month, paying 2.87 (.72 at 25% max) versus 15.93 spot (18.0%), with the defined risk 11/16/16/21 iron fly paying 2.60 with a buying power effect of 2.40 (.65 at 25% max).
The BBY December 20th 65/80 short strangle is paying 1.75 (.88 at 50% max), with the correspondent 60/65/80/85 iron condor in the same cycle paying 1.60 (.80 at 50% max).
EXCHANGE-TRADED FUNDS:
TLT (36/12)
SLV (29/20)
GLD (23/11)
USO (21/33)
XLE (19/20)
As with last week, short duration premium selling remains less than ideal here, so either hand sit, keeping powder dry, or look to deploy in longer duration setups. Here's what's on my list for longer duration setups in which at background implied volatility is higher:
XOP: January, where the at-the-money short straddle is paying 2.20 versus 21.05 spot (10.5%)
EWZ: March, where the at-the-money short straddle is paying 5.12 versus 43.16 spot (11.9%)
GDX: March, where the at-the-money short straddle is paying 3.14 versus 26.76 spot (11.7%)
SMH: May, where the at-the-money short straddle is paying 17.95 versus 130.92 spot (13.7%)
BROAD MARKET:
SPY 10/13
IWM (7/16)
QQQ (7/16)
As with the exchange-traded funds, you're looking at either hand sitting on shorter duration setups or going out farther in time to get paid, with the expiries in which the at-the-money short straddle is paying greater than 10% in September for SPY and June for both IWM and QQQ (ugh).
FUTURES:
/6B (67/12)
/NG (41/60)
/6C (30/5)
/SI (29/18)
/GC (23/11)
Cable I get, but what's with the Loonie?
VIX/VIX DERIVATIVES:
With the January, February, and March contracts trading at 16.68, 17.76, and 18.05 respectively as of Friday close, VIX term structure trades in those expiries remain viable. For all other short volatility trades, I'd wait for a VIX pop above 20 to consider starting to add short position, as well as consider taking off some risk if we see another drop back into the 2019 lows at 12. It finished Friday at 12.34 ... .

GDXJ Junior Gold Miners in Wave 4 correctionConsistent with my view on #gold, juniors look like a Wave 4 correction before a 5th wave higher. $GDXJ $GDX $GLD $SLV #silver #platinum #palladium

$GDX Gold Miners in bull flag, testing rising channel support. Price should move up from these levels as rising channel support holds and price breaks out of bull flag.


GDX - Watching for ReversalSmall position here for me.
Watching for pattern turn right around Christmas.
SPY / SPX pullback during the same period should indicate risk-on for GDX with bullish trend.
Options are cheap and so is stock. Small position size until we see bullish confirmation helps to reduce risk.
I suggest using stop losses. I do not personally because I feel they telegraph my orders to the algo's.
I play the chart, pattern, world events, price, and sentiment. I also use Price Alerts HEAVILY instead of stop losses.
Holla if anyone wants an update for GDX and I will do my best.
Thank you for liking, commenting, throwing up a chart, following, or viewing.
I am not a financial advisor. My comments and reviews are based on what I do with my personal accounts.
Disclosure - I am long MARA, GBTC, BTCUSD, GDX, VIXY

Gold - Reversal Bullish Pattern FormingOANDA:XAUUSD is forming a falling wedge awaiting breakout.
RSI is showing bullish divergence. Estimated targets is around 1492
Cheers!


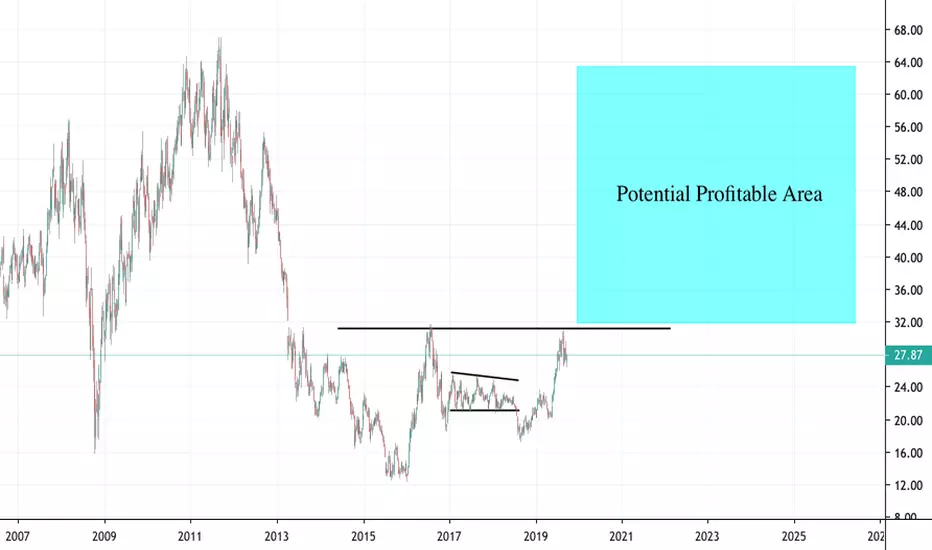
GDX - Bullish Wedge PatternGDX saw a rise in price from June breakout until its top in September. Since that September top, the stock has formed a bullish wedge pattern where it is currently bouncing off the support line. There is also a slight bullish divergence between the price & the RSI indicator.
Just waiting for the bullish breakout to occur to activate a potential price target. Any breakdown would negate the formation.

Target for $JNUG at different $gold spot prices $GDX $NUGT $GLDThe ascending triangle in the gold price displayed here:
Has produced a double bottom and bullish XABCD pattern displayed above in pink on the $JNUG chart.
A return to the recent highs will likely send $JNUG back into the $76 to $83 range.
Gold is, momentarily, no longer inversely correlated with the stock market. Negative real interest rates globally and the inverse correlation with USD is now the primary driving force in the price of gold.
Lower interest rates and (not QE ) QE are repricing the US dollar against major world currencies and gold:
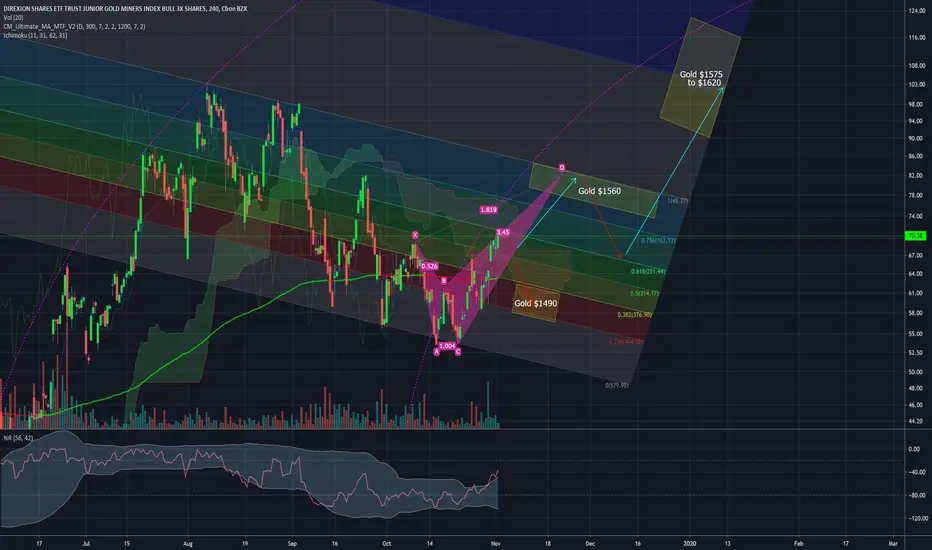
Target for $NUGT at different $gold spot prices $GDX $NUGT $JNUGThe ascending triangle in the gold price displayed here:
Has produced the consolidation wedge displayed in the green triangle pattern above in $NUGT.
A return to the recent highs will likely send $NUGT back into the $36 to $38 range.
Gold is, momentarily, no longer inversely correlated with the stock market. Negative real interest rates globally and the inverse correlation with USD is now the primary driving force in the price of gold.
Lower interest rates and (not QE ) QE are repricing the US dollar against major world currencies and gold:

GDX - Ready to pop with BTC , while SPY fallsGDX, SPY, and VIXY all tell similar story.
Things are topped out. Gold, Bitcoin, and shorting SPY will be the best (if not the only) options for alpha in the upcoming market.
If you are long SPY or any equities, be careful chasing that last 10% because a 20%+ drop is below you.
Long - GDX, MARA, VIXY, BTCUSD, GBTC.

#Gold Volatility Signalling Further Declines?This is an excerpt from the Parallax Report, originally published the week of October 15. For more information, please visit @themacrostrat.
"Unlike the usual relationship between volatility and equities, gold and gold volatility trade in tandem; and gold volatility (GVX) continues to grind lower since gold failed to gain momentum above $1,550 which is trending neatly within a descending channel.
If we breakdown gold volatility further, when the standard deviation spikes above 1 with the 30-day ROC trending lower, we see lower gold prices. The ROC is maintaining negative territory while the volatility sigma continues to slide lower."
Nar-term TACVOL range is 1520/1474.

GDX - Long Opportunity with low risk- There seems to be some support on 26.16
- Two target prices, if it manage to break 27.33 the next would be 28.44
- A good 3.1RR for this trade

natural dollar cycles$xauusd $xagusd $gdx $dust $nugt $gdxj $jnug $jdst $dxy $silver $gold
I'm looking for the dollar to continue these natural cycles and form a low towards end of 2020 watch for a possible spike before the low. Gold, silver will most likely sell off again and offer another very good opportunity.. perhaps we'll see a huge rally in precious metals through 2020. Buckle up.

JDST long ideaSure looks like a break out to me. Pick up some JDST as gold and miners drop into the next ICL.


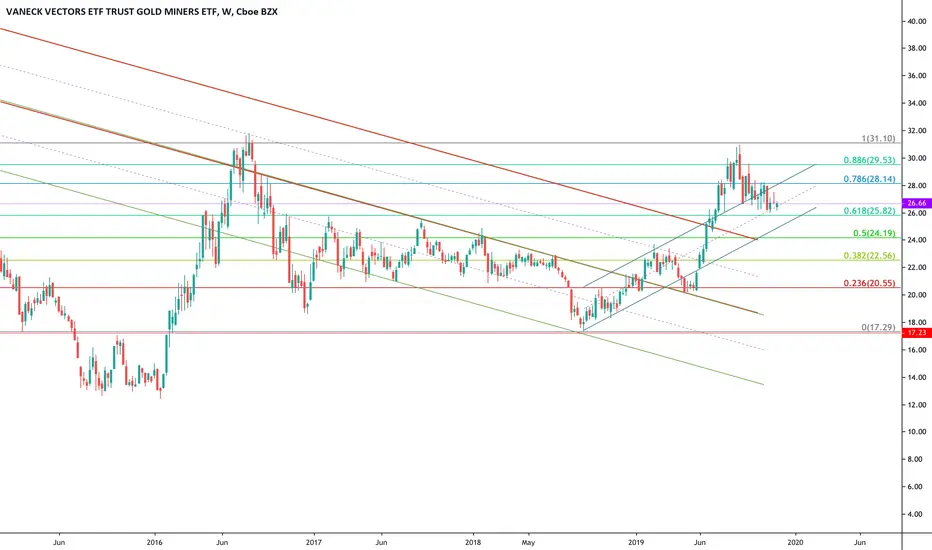
GDX, VanEck Vectors Gold Miners ETF - Potential Risk RewardAMEX:GDX
If the value of gold continues to increase, automatically the companies linked to the extraction of this metal would derive profit from it and therefore we wait for a breakout of this resistance to allocate eventually a part of the portfolio on this ETF.
As we also notice from the point of view of the potential resistances that could be found on the path towards the achievement of profit would be very few, and therefore the Risk Reward is very interesting.
finance.yahoo.com
FCX and the looming recession?pure play copper not exactly best idea for global recession positioning.. but, who knows how this thing is going to go down. Copper is so important, it cant be left behind for long? Maybe it can? But accumulation at least shows some promise.. Should be fun next few months! Please let me know your thoughts.. FCX performance lately is scary. Big money know some details the little guys arent privy to just yet?
