GOLD bearish.. XAUUSD (Monthly)I like to challenge my own biases with this chart. Seems like a break of the recent years triangle. $GDX $GLD
GDX

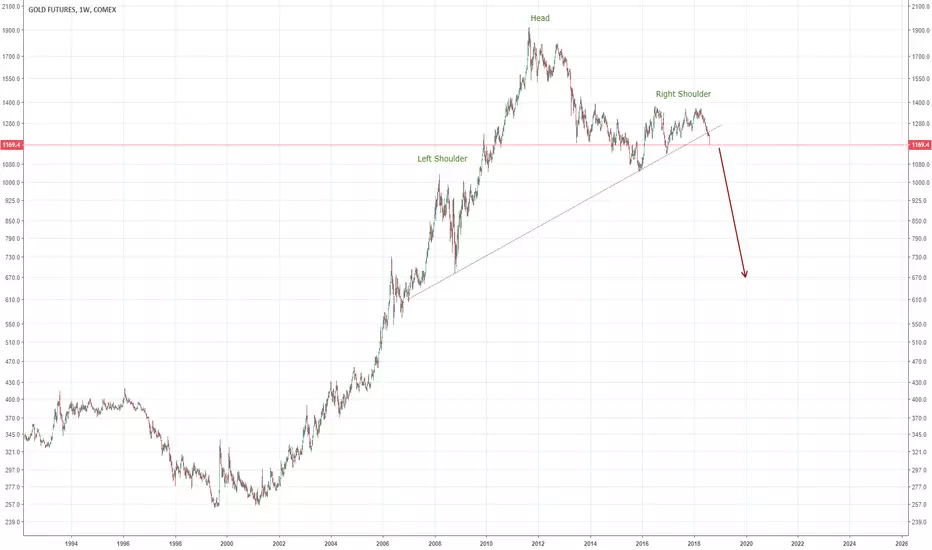
We never finished the commodity crash of 2014, we just paused itSo many thought we bottomed out in Gold. But what if Gold still has a LOT further to go? If you just look at the chart, it's essentially a classic bubble. Yet the drop from the bubble's top was not that much compared to the rise... that's not how this works. Note the very discernable head and shoulders pattern that just broke, where we now see gold falling violently. I hear the arguments that there are record shorts in Gold right now, and that's normally a positive indicator for a rally. But I'm not convinced this is going to be enough right now, I think those who are net short tend to "know" some more fundamental stuff than many of the rest of us do. This is deflation people.
Capitulation?I see the signs of capitulation in the PM minder markets.
$Nugt could go up 80% like previous time, with a target of around $24.
However, I'm aware we haven't seen real capitulation yet, but from a technical perspective, things looks quite safe to go long.

Silver. Short Opportunity. Target 12-13.66Silver market was undermined with a notorious Flash Crash occurred last summer.
The chart structure was spoiled but at the end of the day if we have enough patience
to wait until dust settles we could see the clear picture again.
I spotted for you both the blue downtrend and the yellow triangle pattern in the wave X on the chart.
It looks like we can gain from the last drop down to the previous low at the 13.65 or even lower to the downside
of the downtrend to the area of 12 handle.
The RSI indicator can't raise its head above the waterline beyond the 50 level and it favors the short.
The invalidation level is set at the finish of the wave "e" of X at the 17.70 level.
The minimum risk/reward then is equal to 2 and is healthily asymmetric.

GDX long idea long set up here as it hits a multi month support. Would get bullish over 22 with increase in weekly volume $GDX $GDXJ $NUGT $DUST $GLD

XAUUUSD BULLISH Triangle FormingEntry: 1222.00 - 1223.00
SL: 1218.2
TP1: 1229
TP2: 1234
TP3: 1239
R/R: 3.67


USDOLLAR KEY Reversal Day on BLOOD RED MOON MERCURY RETROGRADEDONT Forget MARS ALIGNMENT FAVORS WAR.
The US 2Q GDP came in at 4.1% with a revision to the 1Q (they are still revising that number). The GDP is the quarter change... annualized. Taking the 2 quarters (2.2% and 4.1%) and dividing by 2 gets 3.15%. The 4 quarter average is 2.85%. (2.8%, 2.3%, 2.2% and 4.1%)
The initial knee jerk reaction in the dollar is a little lower.
The USDJPY fell to a low of 110.95. That is still above the low for the day at 110.92.
The price is below the 100 hour MA at 111.113. The price today has been waffling above and below that MA line today. We trade at 111.08 currently. Move above the MA and perhaps the sellers turn around and buy. Stay below keeps the sellers more in charge.
The EURUSD moved up and back down. The high reached 1.1639. That was just below the 61.8% of the move up from last weeks trading range. Yesterday, the price moved below the 100 and 200 hour MA and has remained below those MAs since (blue and green lines).
The initial reaction was dollar lower (expecting 4.8% perhaps), but "the market" overall is stymied trying to figure what to do next.

ABX Barrick Gold Beat Down Dog may Lead the NEXT GDX BuLL?Longer term trade setup for Canadians in RRSP or TFSA
Since no shorts can be taken in RRSP or TFSA in Canada be patient and plan out the longer term longs with the highest probability of working out.
The being patient part is still a significant challenge for myself.
Two options for entry if things work out and ABX gets this low.
Like anything else in life there is no gaurantee price will Reverse but if it does it is best to be prepared and have a plan.
Plan your trade and trade your plan.
$USDOLLAR Norm Winski 2018 vs 1937 Blood Red Moon Astro Chart calls GOLD Bottom REVERSAL
HTTPS://PBS.TWIMG.COM/MEDIA/DJHVVO5WSAAIXPX.JPG

Gold Mercury Retrograde and Friday Blood RED MoonThe uncertainty surrounding the ongoing trade war between the US and China has been driving the price of gold lower, instead of higher, as would normally be the case in times of heightened geopolitical risk. This is due to the close correlation between gold and the Chinese yuan which has remained firm in recent months. The Chinese government has allowed the Chinese currency to weaken in order to offset the drag on Chinese growth caused by US tariffs on billions of dollars worth of goods. Furthermore, mounting signs of a renewed round of monetary easing has also been weighing on the currency. Especially following Monday’s announcement of tax cuts and infrastructure projects and after the PBoC on Wednesday said that a capital requirement for some banks would be eased in order to support lending.
From their recent respective peaks back in April, the yuan is down by 8% while gold has lost 9.3%. Most of the relatively worse performance seen in gold has occurred during the past week as the market prepares for what is expected to be a very strong US Q2 growth number on Friday.
Gold has once again managed to find support ahead of $1,200/oz, an area which has provided support in the past and which represents a 50% retracement of the $329/oz rally seen between December 2015 and July 2016. For this level to hold, however, it is clear that the dollar appreciation needs to pause or reverse, especially against the yuan as highlighted above.
In the week to July 17, gold’s continued slump to a one-year low helped trigger another spate of heavy short-selling by funds. The net-short reached 22,000 lots, just shy of the 24,000 lots record seen in December 2015. Back then this bearish view was reached just before the first US rate hike signalled a low point from where gold rallied strongly. The current gross-short of 132,000 lots has never been seen bigger and it has left gold in a much better position to react to price-friendly news.

Gold Unprecedented Volume Spike - $1.7 BillionOver 82 million shares were traded in the triple leverage gold stock ETF (NUGT) on July 17, 76 million in 40 minutes, which is about $1.7 billion worth.
This is triple the previous record of 27 million on December 15th, 2016, after which NUGT doubled in two months.
Long?

UPDATE: BoJ signalling the end to Curve Control, USDJPYHi guys, thank you for the support! I will have this analysis out each weekend as well as daily updates throughout the week, if you guys like what I'm doing hit the "follow" button and you will get a notification each time I post a video or chart!
Have a great day everyone!

Silver/Gold Triple Three Pattern? HelpSpent a silly amount of time on this. Every Combo pattern seemed off until I came across this one.
Wanted to focus only on Elliot Wave Theory. I'm trying to learn more about combination structures WXY and would welcome an expert opinion if any have one.
There's some sort of double corrective structure going on here in Silver, I can just smell it. But can't put my finger on it.
I'm reaching far out on this one so it could easily get invalidated, but it corresponds nicely to what I was originally thinking would play out in Gold/Silver over the next year. It took me a very long time before I realized that we might only be half-way through this corrective period, and this is the only structure that fits given that we only have half the price action to speculate off of.
Just throwing a stray metals post out into the ether of bitcoin posts.
This is the link to the idea:
www.google.com

SYH (NYSE) W set up longWeekly chart here showing tightening range on consolidation. Long over 0.485

GSV (NYSE) long set up WDidn't take the first targeted entry. Second chance of entry over 2.20. volume back above average after recent long term downtrend. $GSV $GLD $GOLD $MUX $GDX

UPDATE: Everyone is calling for Gold $1,200, is the low in?Hi guys, thank you for the support! I will have this analysis out each weekend as well as daily updates throughout the week, if you guys like what I'm doing hit the "follow" button and you will get a notification each time I post a video or chart!
Have a great day everyone!


Rejection of higher prices on Royal Gold - Weekly Chart $RGLD $GLD $GDX #gold #miners #trading $DXY
These custom support resistance indicator lines show decent places to enter or exit.
The Blue indicator line serves as a Bullish Trend setter.
If your instrument closes above the Blue line, we think about going Long.
If your instrument closes below the Red line, we think about Shorting.
For Stocks, I prefer to use the Yellow line as my Bearish Trend setter (on Daily charts).
Find out more. Send Private Mail (PM) to @MasterCharts

Gold's Giant Wedge, Just Interesting for ReviewAs always, I try to keep the larger picture in mind. This is a very interesting overview.

Probably Good to Long GoldSince my last post on Gold, Gold keeps its downtrend after it broke its uptrend line. Now it looks like that gold reached its support area, and i think it's probably a good opportunity to long gold.

Gold Long SetupXAUUSD has just landed on two major levels, the uptrend and Fibo level.
I expect Gold to reverse here and targets the upper trend of the triangle.
Cheers!

GDX Gold miners ETF has not broken down into bloodbath like goldReversal possible off lower E into the holiday weekend as the shorts have had their fill smashing gold. Now they will load up and go the other way for several months is my guess. The miners should lead the way as they did not break down like gold did which shows positive strength. IMO>
