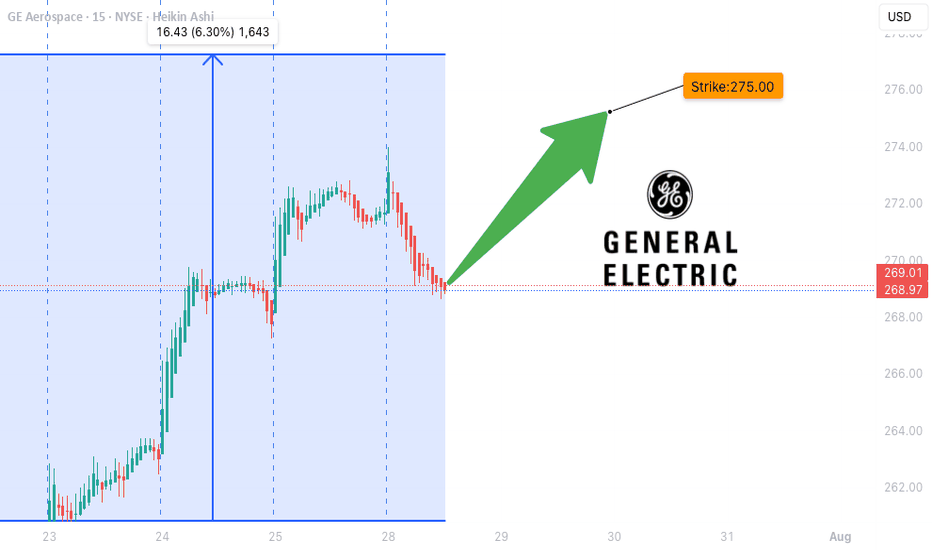
GE WEEKLY OPTIONS SETUP (2025-07-28)
### ⚙️ GE WEEKLY OPTIONS SETUP (2025-07-28)
**Mixed Signals, Bullish Flow – Can Calls Win This Tug-of-War?**
---
📊 **Momentum Breakdown:**
* **RSI:** Falling across models → ⚠️ *Momentum Weak*
* **Volume:** Weak 📉 = Low conviction from big players
* **Options Flow:** Call/Put ratio favors bulls 📈
* **Volatility (VIX):** Favorable for directional plays
🧠 Model Consensus:
> “Momentum weak, but bullish flow + low VIX = cautiously bullish.”
> Some models recommend **no trade**, others suggest **tight-risk long call**.
---
### ✅ WEEKLY SETUP AT A GLANCE
* 🔍 **Volume:** Weak (distribution risk)
* 📉 **Momentum:** RSI fading
* 💬 **Options Sentiment:** Bullish bias (calls > puts)
* ⚙️ **Volatility:** Favorable
**Overall Bias:** 🟡 *Moderate Bullish*
---
### 💥 TRADE IDEA: GE \$275C
* 🎯 **Strategy:** Long Weekly Call
* 🔵 **Strike:** 275.00
* 📆 **Expiry:** Aug 1, 2025
* 💸 **Entry:** \$1.10
* ✅ **Profit Target:** \$1.80
* 🛑 **Stop Loss:** \$0.55
* 📈 **Confidence Level:** 65%
* 🧮 **Risk Level:** Medium (momentum divergence = tread carefully)
* ⚠️ **Support Watch:** Monitor for drop below \$268–270 for potential exit.
---
### 📦 TRADE\_DETAILS (Algo/Backtest Ready JSON)
```json
{
"instrument": "GE",
"direction": "call",
"strike": 275.0,
"expiry": "2025-08-01",
"confidence": 0.65,
"profit_target": 1.80,
"stop_loss": 0.55,
"size": 1,
"entry_price": 1.10,
"entry_timing": "open",
"signal_publish_time": "2025-07-28 12:08:59 UTC-04:00"
}
```
---
### 📌 NOTES FOR TRADERS
* 🤖 Models split between *no trade* vs *tight-risk long*
* 🚨 **Momentum divergence** is real – don’t oversize
* 🧭 **Watch Friday theta decay** — manage exits accordingly
* 🔍 Chart check: Watch price action near \$275 and \$268
---
**#GE #OptionsTrading #WeeklyPlay #CallFlow #UnusualOptionsActivity #GEcalls #AITrading #RiskManagement**
Gelong
GE LONG this is for long investment 3+ months don't go long until it pass $13.45 if it brake that level than you good to go,
1st target is between 2 and 3 months of wait
2nd target is 4-5 months
3rd target 8 to 12 month
GE is heavy to move but the movement is clear.
you probably will get it to 3rd target with a different age tho but it is good investment.
GE BULL RUN | Bounce Off Monthly LevelGood afternoon Traders,
Today we made a few weekly GE plays playing the continuation.
Plays Made:
- $6.5 Call 5/22 and 5/29
Looking to grab much longer-term contracts ASAP.
Potential Plays:
- 6 Month Play | GE $10 Call 9/18 @ $10 Per Contract
- [Far out the money ] 6 Month Play | GE $19 CALL 11/20 @ $3 Per Contract
Do not trade this, not financial advice
DotcomJack
GENERAL ELECTRIC CO (GE) Monthly, Weekly & DailyDates in the future with the greatest probability for a price high or price low.
The Djinn Predictive Indicators are simple mathematical equations. Once an equation is given to Siri the algorithm provides the future price swing date. Djinn Indicators work on all charts, for any asset category and in all time frames. Occasionally a Djinn Predictive Indicator will miss its prediction date by one candlestick. If multiple Djinn prediction dates are missed and are plowed through by same color Henikin Ashi candles the asset is being "reset". The "reset" is complete when Henikin Ashi candles are back in sync with Djinn price high or low prediction dates.
One way the Djinn Indicator is used to enter and exit trades:
For best results trade in the direction of the trend.
The Linear Regression channel is used to determine trend direction. The Linear Regression is set at 2 -2 30.
When a green Henikin Ashi candle intersects with the linear regression upper deviation line (green line) and both indicators intersect with a Djinn prediction date a sell is triggered.
When a red Henikin Ashi candle intersects with the linear regression lower deviation line (red line) and both indicators intersect with a Djinn prediction date a buy is triggered.
This trading strategy works on daily, weekly and Monthly Djinn Predictive charts.
Trades made when the monthly, weekly and daily arrows are pointing in the same direction are the most profitable.
This is not trading advice. Trade at your own risk.
Possible Ascending Triangle on GEAs the market looks like its rebounding from the coronavirus scare I'm looking at longing GE. It has some positive fundamentals right now along with an ascending triangle forming. I also like the bullish hammer candle from last week which is why i'm jumping in a little early as opposed to waiting for the 3rd touch at the top.
Bullish GE Trend With Key Resistance Levels 2 Month ForecastGE has broken out of it's descending channel and has now shown a strong reversal and bullish indicator. This first quarter will be a beast as the new CEO takes reign and focuses on balancing the books. GE will become the comeback kid of 2019!
GE - General Electric On The But?As far as I can interpret the facts from the chart, I would say that there's a potential support for this Stock.
You see the confluence point from a couple of potential support levels like the Fork, the horizontal, the over- and under shoot level etc.
If you want more details check out my TradingView blog where I post the step by step analysis, from the clean chart to this result.
P!


