Nasdaq 100 Near Breakout – Eyes on 22,200 ResistanceThe Nasdaq 100 is approaching a critical technical level at 22,200. This resistance marks the upper boundary of recent consolidation and aligns with prior rejection zones. A clean break above this threshold could trigger a sharp upside move, possibly propelling the index into uncharted territory.
Geopolitical tensions have eased, and the dollar’s renewed weakness is supporting risk appetite, particularly in the tech-heavy Nasdaq. Strong earnings from key sectors are reinforcing bullish sentiment, with investors increasingly pricing in a favorable macro backdrop.
Technically, momentum is building. Price action has formed a series of higher lows, and buying pressure is intensifying near resistance. A breakout above 22,200 could ignite a strong rally, driven by stop orders and fresh bullish entries.
That said, traders should remain cautious. While the breakout setup is promising, a retracement toward support zones—such as 21,500 or the 20-day moving average—remains possible, especially if upcoming inflation or macro data disappoints.
For now, the 22,200 level remains the key to watch. A daily close above this level would shift the bias clearly higher, confirming breakout strength and potentially accelerating gains toward 22,800 or beyond.
Geopoliticaltensions

CRUDE OIL poised to go UP AGAIN? Usually my posts on crude oil are short. but here’s a longer one for a change.
Back in December, I predicted that crude oil would hit the highlighted zone around $57. That’s exactly what happened, hit the target and bounced.
Over the past two weeks, we’ve seen wild swings in crude oil prices as tensions between Iran and Israel escalated. But now, following the ceasefire announcement brokered by President Trump, and considering Iran’s response over the past couple of days, crude oil has dropped below its pre-conflict price levels.
While I truly hope for a peaceful world where no innocent lives are harmed, my personal view is that this ceasefire feels fragile and may not last long.
So, what’s next for crude oil? Up or down?
If the ceasefire holds and we don’t see further conflict in the Middle East, I think crude oil could hover in the $65–$75 range. There’s even a slim chance we dip as low as $45.
However, based on my technical analysis model, and my doubts about the durability of the ceasefire, I expect oil prices to rise in the next 6 to 9 months. My targets? $78 and $85.
Of course, I might be wrong this time. :)
Cheers!

Gold Poised to Shine - 18% Upside Projected by Completing Wave 5Gold is currently trading around 494.92 RMB per gram in China as of July 25, 2023. Based on the technical analysis on XAUCNY showing we are currently in wave 5, subwave 4 of an upward trend, the prediction is that by January 2025, the price for 1 ounce of gold will reach 16575 RMB.
Given that 1 ounce equals 28.3495 grams, a price of 16575 RMB per ounce implies that the price per gram of gold is expected to reach around 584 RMB by January 2025.
This represents an increase of approximately 18% from the current price of 494.92 RMB per gram. Going from subwave 4 to subwave 5 typically signals the final leg of an advancing trend before it completes the larger degree wave 5. If the analysis is correct, we can expect the 18% price increase to occur over the next 1.5 years as gold enters the terminal subwave 5.
The ongoing expansionary monetary policies by central banks globally serves as a key driver supporting higher gold prices. High inflation levels in many economies incentivizes investors to allocate more funds to gold as an inflation hedge. Geopolitical tensions, such as the Russia-Ukraine conflict also increase safe-haven demand for gold.
While risks remain, such as potential interest rate hikes that strengthen the dollar, the overall backdrop still seems conducive for higher gold prices. From a technical perspective, the upside projection toward 584 RMB per gram over the next 1.5 years aligns with the view that subwave 5 will see accelerating upside momentum toward completing wave 5.
In summary, based on current technical analysis, the prediction is that gold will reach 584 RMB per gram by January 2025, an 18% increase from today's levels, as it completes the final wave 5 uptrend over the coming months. The macroeconomic and geopolitical environment also seem supportive of this view.

S&P 500 Daily Chart Analysis For Week of April 4, 2025Technical Analysis and Outlook:
During this week's trading session, the Index experienced lower openings, completing the Outer Index Dip at 5403, as highlighted in the previous week's Daily Chart analysis. This development lays a foundation for a potential decline targeting the Outer Index Dip at 5026, with the possibility of further extension to the subsequent target of the next Outer Index Dip, 4893. An upward momentum may materialize at either completed target level, with the primary objective being the Mean Resistance level of 5185.

Gold Price Surges Amid Market Uncertainty – What’s Next?The late Friday session on March 28, 2025, ended with a strong rally in gold, as multiple price candles attempted to push higher. By 10 PM CET, gold had settled at $3,085.345, reflecting significant bullish momentum.
As the market reopened on Monday, the gold price gapped up by approximately +$12.5 , opening at $3,097.978 .
This type of price gap typically occurs when buyers are willing to pay more than the previous session’s close, signaling strong demand.
What’s Driving the Gold Rally?
The answer lies in a mix of tariffs, war, and recession fears. The global financial landscape remains highly unstable, and in times of uncertainty, gold historically acts as the preferred safe-haven asset. Investors are flocking to the precious metal as a hedge against economic instability.
Adding fuel to the fire, on April 2nd, additional U.S. tariffs imposed by President Donald Trump are set to take effect. This move could further disrupt markets, potentially driving even more capital into gold.
The Interest Rate Factor – A Hidden Risk?
While gold is surging, there’s a crucial factor to watch: Federal Reserve policy. So far, Fed Chair Jerome Powell has maintained a cautious stance on interest rates. However, if the situation deteriorates, the Fed might be forced to cut rates earlier than expected to stabilize the economy.
This could create a paradox for gold traders. While rate cuts typically support gold in the long run, a sudden policy shift could trigger a short-term sell-off as investors adjust their positions. If that happens, gold could see a sharp correction before resuming its trend.
Final Thoughts
Gold remains in a strong uptrend, but traders should stay cautious. If the Fed pivots and announces rate cuts sooner than expected, we could see a pullback in gold before the next leg higher. The coming days will be critical – keep an eye on April 2 and any shifts in Fed policy that could shake up the market.
👉 Will gold continue its rally, or are we facing a major pullback? Share your thoughts in the comments! 🚀
-------------------------------------------------------------------------
This is just my personal market idea and not financial advice! 📢 Trading gold and other financial instruments carries risks – only invest what you can afford to lose. Always do your own analysis, use solid risk management, and trade responsibly.
Good luck and safe trading! 🚀📊

Will the Fear Gauge Flash Red?The Cboe Volatility Index (VIX), Wall Street's closely watched "fear gauge," is poised for a potential surge due to US President Donald Trump's assertive policy agenda. This article examines the confluence of factors, primarily Trump's planned tariffs and escalating geopolitical tensions, that are likely to inject significant uncertainty into the financial markets. Historically, the VIX has proven to be a reliable indicator of investor anxiety, spiking during economic and political instability periods. The current climate, marked by a potential trade war and heightened international risks, suggests a strong likelihood of increased market volatility and a corresponding rise in the VIX.
President Trump's impending "Liberation Day" tariffs, set to target all countries with reciprocal duties, have already sparked considerable concern among economists and financial institutions. Experts at Goldman Sachs and J.P. Morgan predict that these tariffs will lead to higher inflation, slower economic growth, and an elevated risk of recession in the US. The sheer scale and breadth of these tariffs, affecting major trading partners and critical industries, create an environment of unpredictability that unsettles investors and compels them to seek protection against potential market downturns, a dynamic that typically drives the VIX upward.
Adding to the market's unease are the growing geopolitical fault lines involving the US and both China and Iran. Trade disputes and strategic rivalry with China, coupled with President Trump's confrontational stance and threats of military action against Iran over its nuclear program, contribute significantly to global instability. These high-stakes international situations, fraught with the potential for escalation, naturally trigger investor anxiety and a flight to safety, further fueling expectations of increased market volatility as measured by the VIX.
In conclusion, the combination of President Trump's aggressive trade policies and the mounting geopolitical risks presents a compelling case for a significant rise in the VIX. Market analysts have already observed this trend, and historical patterns during similar periods of uncertainty reinforce the expectation of heightened volatility. As investors grapple with the potential economic fallout from tariffs and the dangers of international conflicts, the VIX will likely serve as a crucial barometer, reflecting the increasing fear and uncertainty permeating the financial landscape.

Is Erdogan’s Gambit Destabilizing Turkey’s Future?Erdogan’s administration continues to engage in high-stakes geopolitical maneuvers by maintaining direct and indirect ties with groups designated as terrorist organizations. His government’s strategic alliances, notably with Hayat Tahrir al-Sham (HTS), serve immediate military and political goals in Syria, despite significant international controversy and longstanding terrorist designations by the U.S. and other global actors.
This risky strategy has had a pronounced impact on the Turkish economy. Investors have increasingly shifted their capital from the Turkish Lira to the U.S. dollar, leading to a notable rise in the USD/TRY rate. Fears of further economic isolation and the looming threat of sanctions—which could cut off Turkey from critical European banking and trade services—have only intensified market instability.
The growing strains within NATO and shifting regional alliances are compounding these economic challenges. Erdogan’s pragmatic yet contentious foreign policy raises serious questions about Turkey’s future role within the alliance, as Western partners deliberate potential sanctions and other measures. Meanwhile, evolving dynamics with regional powers such as Russia and Iran add further uncertainty to Turkey’s strategic position and economic prospects.

Will Oil Prices Ignite Amid a Middle East War?The global oil market is critical, with geopolitical tensions in the Middle East potentially leading to significant price fluctuations. Recent military actions by the U.S. against Yemen's Houthi group have contributed to rising oil prices, as Brent crude futures reached $71.21 per barrel and U.S. West Texas Intermediate crude futures hit $67.80 per barrel. Positive economic indicators from China, including increased retail sales, have supported oil prices despite global economic slowdown concerns.
The Middle East remains a focal point for oil price volatility due to its strategic importance in global oil supply. Iran, a major oil producer, could face disruptions if tensions escalate, potentially driving prices higher. However, global spare capacity and demand resilience might cap long-term increases. Historical events like the 2019 Saudi oil facility attacks demonstrate the market's sensitivity to regional instability, with prices spiking by $10 following the incident.
Analysts predict that if the conflict escalates to close the Strait of Hormuz, oil prices could exceed $100 per barrel. Nevertheless, historical data suggests that prices may stabilize within a few months if disruptions prove temporary. The delicate balance between supply shocks and market adjustments underscores the need to closely monitor geopolitical developments and their economic ripple effects.
As global economic uncertainties overshadow geopolitical risks, maintaining market confidence will depend on sustained positive economic data from countries like China. The potential for peace negotiations in Ukraine and changes in U.S. sanctions could also impact oil prices, making this a pivotal moment for global energy markets.

Geopolitical Uncertainty Supports Gold PriceXAUUSD Prices Steady Amid Geopolitical Tensions
1. *Gold price*: Gold (XAU/USD) is currently trading around $2,870, attracting some buyers.
2. *Reason for increase*: The ongoing Russia-Ukraine conflict and uncertainty are supporting the precious metal.
3. *Upcoming data*: Traders are waiting for the US February ISM Manufacturing Purchasing Managers Index (PMI) data, which may impact gold prices.
Geopolitical Tensions
1. *Russia-Ukraine conflict*: The conflict continues, with US President Donald Trump canceling a minerals deal with Ukraine.
2. *Oil refinery fire*: A fire broke out at an oil refinery in the Russian city of Ufa, but the cause is unknown.
Economic Data
1. *US inflation*: The US Personal Consumption Expenditures (PCE) Price Index rose 2.5% YoY in January, in line with expectations.
2. *Core PCE*: The core PCE Price Index, excluding food and energy, climbed 2.6% YoY in January.
3. *Federal Reserve*: The US Federal Reserve may adopt a cautious stance on further rate cuts due to the inflation data.
Market Implications
1. *Gold prices*: Escalating tensions between Russia and Ukraine could boost gold prices, while a stronger US dollar might cap the upside.
2. *Investor sentiment*: Investors are closely monitoring developments surrounding Russia and Ukraine, which may impact market sentiment.

Gold Spot intraday setup. The Pushmi - Pullyu animalRemember Dr. Dolittle? He was a vet who could talk to animals. One of the rarest was the “pushmi-pullyu,” a llama with two heads (one head was where the ass ought to be).
The pushmi-pullyu was a gentle creature that did not like to be stared at. And yet the other animals in Africa convinced him to go with the good Dr., and be put on display in Europe, because Dr. Dolittle was a kind soul who needed money to look after all the animals in his “care”.
It's gone a bit since Gold explosion last week, due to Biden's gaffe to authorize the yellow/blues regime use US-made missiles inside Russia's legal area, while the rods of Russia's retribution hanged like the sword of Damocles over all of Europe, on the basis of reciprocity.
Last week Gold spot added +153 US Dollars just in 5 Days. That was the best in history ever 1-week return, since January, 1980. Additionally, in percentage points Gold spot added +5.97 percent in a week. It was the 3rd best 1-week return over past decade.
Gold spot in Euro OANDA:XAUEUR at the same time continues its gain 11th straight month in a row.
The main intraday graph is for Gold spot OANDA:XAUUSD , and it indicates that Gold has retraced a bit to its key $2670 level (that was discussed in earlier published ideas), and ready to take Adv. again, since Trump-a-rally rolled out into the all-the-world fart.

Can Defense Industry Giants Turn Global Tensions into SustainablIn a fascinating paradox of modern defense economics, RTX Corporation stands at the epicenter of escalating global security demands while grappling with production constraints that challenge its ability to meet them. With a remarkable $90 billion defense backlog and recent approval for a $744 million missile sale to Denmark, RTX exemplifies how geopolitical tensions are reshaping the aerospace and defense industry landscape. Yet this surge in demand raises profound questions about the sustainability of growth in an industry where production capacity faces inherent limitations.
The company's financial performance tells a compelling story of adaptation and resilience, with its stock attracting increased attention from major analysts and an upward revision of earnings guidance. However, beneath these promising figures lies a more complex narrative: RTX must balance the immediate pressures of global defense requirements against the long-term challenges of production capacity and technological innovation. This delicate equilibrium becomes even more critical as the company serves not just one nation's defense needs, but those of at least 14 allied nations simultaneously.
What emerges is a thought-provoking case study in strategic industrial scaling: How can defense manufacturers like RTX transform short-term geopolitical pressures into sustainable long-term growth? The answer may lie in the company's diversified approach, combining traditional defense contracts with innovative aerospace solutions, while navigating the intricate balance between immediate market demands and long-term strategic planning. This scenario challenges our traditional understanding of defense industry dynamics and forces us to reconsider how global security needs might reshape industrial capacity in the decades to come.

Will the Perfect Storm in Natural Gas Markets Lead to a New EnerIn an era of unprecedented global energy transformation, the natural gas market stands at a critical juncture where geopolitical tensions, technological advancement, and infrastructure development converge to create a potentially game-changing scenario. The ongoing Middle East crisis, particularly the Israel-Iran tensions threatening the Strait of Hormuz, could reshape energy flows and trigger a cascade of effects across interconnected global energy markets, potentially forcing a fundamental reassessment of natural gas's role in the global energy mix.
A seismic shift is approaching in North American markets with LNG Canada's anticipated 2025 launch, which promises to revolutionize Canadian gas pricing dynamics and global market access. This transformation coincides with an extraordinary surge in potential demand from AI and data centers, projected to consume between 3 and 30 billion cubic feet per day of additional North American gas. Such technological evolution, coupled with Asia's growing appetite for cleaner energy sources, suggests a structural reformation of traditional gas flow patterns and pricing mechanisms.
The convergence of these factors presents both challenges and opportunities for market participants. While weather patterns and storage dynamics continue to influence short-term price formation, longer-term strategic considerations are increasingly dominated by infrastructure development, market access, and geopolitical risk management. As the industry adapts through strategic hedging, infrastructure investment, and consolidation, the natural gas market appears poised for a period of dynamic evolution that could fundamentally alter its global value proposition and establish a new paradigm in energy markets.

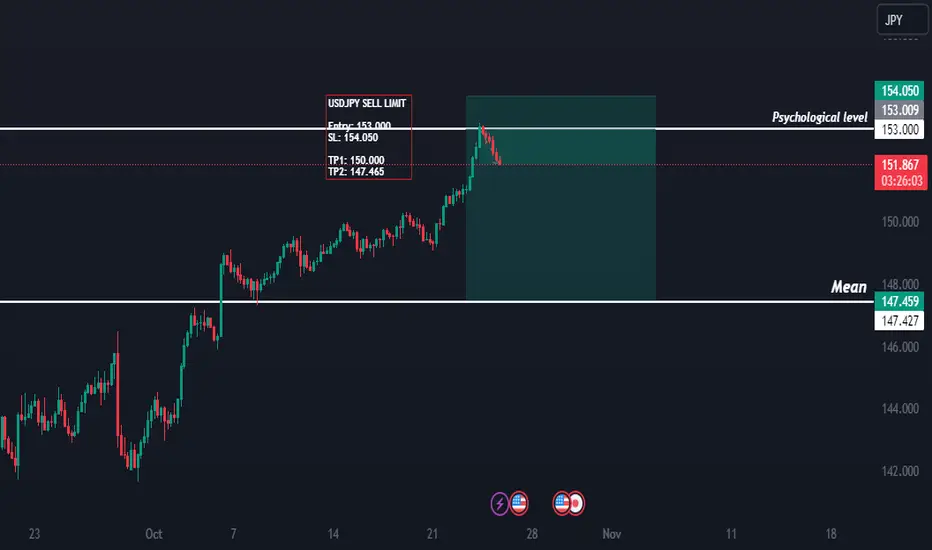
USDJPY Analysis for 24/10/2024: A Slightly Bearish Bias AheadAs we analyze the USDJPY currency pair on October 24, 2024, current market conditions and fundamental factors suggest a slightly bearish bias. This article delves into the key drivers influencing this outlook, allowing traders to make informed decisions in this dynamic market environment.
Current Market Conditions
The USDJPY pair has shown a mixed performance recently, with fluctuations influenced by both U.S. economic data and developments in Japan. Traders are closely watching for signals that could dictate the pair’s movement, particularly as we approach critical economic indicators.
Key Fundamental Drivers
1. U.S. Economic Data: Recent economic data from the U.S. has been a mixed bag. While there have been positive signs in job growth and consumer spending, inflation remains a concern. The Federal Reserve’s stance on interest rates continues to be cautious, signaling that any aggressive rate hikes may not be imminent. This dovish sentiment can weigh on the U.S. dollar, creating a bearish outlook for USDJPY.
2. Japanese Economic Performance: Japan's economy is showing signs of resilience, with recent data indicating stronger-than-expected growth. The Bank of Japan (BoJ) has maintained its accommodative monetary policy, but there are discussions about potential adjustments in response to rising inflation. Should the BoJ signal a shift towards tightening, this could support the Japanese yen and contribute to a bearish trend in USDJPY.
3. Geopolitical Factors: Ongoing geopolitical tensions and global economic uncertainty can lead to safe-haven buying of the yen. Any escalation in conflicts or adverse developments in trade relations may strengthen the yen further, enhancing its appeal against the U.S. dollar.
4. Market Sentiment and Technical Indicators: Sentiment in the forex market is essential. Currently, there is cautious optimism among traders regarding the yen due to the previously mentioned economic performance indicators. Additionally, technical analysis reveals that USDJPY is nearing resistance levels, suggesting a potential reversal. If the pair fails to breach these levels, it may retreat, reinforcing a bearish bias.
Conclusion
Considering the current fundamental factors and market conditions, the outlook for USDJPY remains slightly bearish for today. Traders should monitor upcoming U.S. economic data releases and any announcements from the Bank of Japan that could further impact this currency pair.
Keywords:
USDJPY analysis, bearish bias, forex market, U.S. economic data, Bank of Japan, Japanese yen, geopolitical tensions, market sentiment, technical analysis.
The Fear Index and Geopolitical TensionsIn an era marked by geopolitical tensions and economic volatility, the fear index emerges as a crucial tool for traders seeking to navigate turbulent markets. This article delves into the historical significance of the fear index, exploring pivotal moments like the Cuban Missile Crisis, the 1973 Oil Crisis, and the 2008 Financial Crisis. By understanding how investor psychology and market sentiment intertwine with the fear index, traders can gain a competitive edge.
In today's world, marked by unprecedented geopolitical tensions, understanding the fear index has never been more crucial. As global conflicts escalate, the fear index provides essential insights into market sentiment and helps risk managers navigate through these turbulent times.
A Geopolitical Powder Keg
We are witnessing a convergence of significant geopolitical events:
Russo-Ukrainian Conflict: Ongoing hostilities have far-reaching implications for global stability.
Middle Eastern Volatility: Potential for a full-scale war involving major powers like Israel, the U.S., and Iran.
Sino-Taiwanese Tensions: Threats of a Chinese invasion of Taiwan with severe repercussions for the semiconductor industry and global economy.
Pro-Palestinian Protests: These could escalate into widespread violence, further destabilizing the political and economic landscape.
The Role of the Fear Index
The fear index, often measured by market volatility, acts as a barometer of investor sentiment in the face of these geopolitical risks. By closely monitoring the fear index, risk managers can gain early warnings of market disruptions and develop strategies to mitigate potential crises.
Historical Context
Historical precedents show how the fear index responds to geopolitical tensions:
Cuban Missile Crisis (1962): Stock markets plummeted due to heightened anxiety, underscoring the impact of geopolitical events on market sentiment.
1973 Oil Crisis: The Arab-Israeli War and subsequent oil embargo led to global economic downturns, reflecting the fear index's potential spike during such crises.
9/11 Attacks: The fear index surged as markets reacted to the unprecedented nature of the terrorist attacks.
2008 Financial Crisis: Global financial instability caused a dramatic increase in the fear index, providing early warnings of the impending market collapse.
COVID-19 Pandemic: The pandemic's economic halt saw the fear index spike, signaling early disruptions.
Methodologies for Calculation
Understanding how the fear index is calculated enhances its utility:
Volatility Indexes (e.g., VIX): Measure implied market volatility.
Sentiment Analysis: Assess sentiment through news and social media.
Investor Behavior Metrics: Analyze options trading and margin debt levels.
Combining these approaches offers a comprehensive view of market fear in response to geopolitical tensions.
The Psychological Impact
Investor behavior during geopolitical crises is influenced by:
Loss Aversion: Heightened sensitivity to potential losses.
Herd Mentality: Following the crowd amplifies reactions.
Availability Heuristic: Overestimating the probability of easily recalled events.
Strategic Applications
Risk managers must adopt a holistic approach, integrating the fear index with geopolitical and economic data to develop robust contingency plans. While the fear index can't predict crises' exact timing or magnitude, it provides valuable early warnings to prepare for potential disruptions.
Conclusion
The fear index is indispensable for navigating today's geopolitically charged environment. By monitoring market sentiment and identifying emerging trends, you can protect your investments from unforeseen events and build resilience. Embrace the insights offered by the fear index to stay ahead in these volatile times.

Premium Bearish Gold idea $$$ #xauusd XAU/USD is currently bearish for next 4 hours due to the strength of the US dollar, easing geopolitical tensions, and technical indicators showing downward momentum. Traders may consider shorting the currency pair with tight stop-loss orders to capitalize on the bearish trend.
Entry 2348.56
SL 2351.30
Target 2335.67
#XAU/USD #daytrading #bearish #USDstrength #geopoliticaltensions #technicalindicators
Thanks for tuning in Trade God out
Like share comment and hit the follow button for more

Trading Plans for MON. 10/09 - Geopolitical Tensions, Oil PricesS&P 500 INDEX MODEL TRADING PLANS for MON. 10/09
The geopolitical tensions with the attacks on Israel could be the main drivers of the market today and for the rest of the week. As we published in our trading plans on Thu. 10/05: "With JOLTS on Tuesday, Initial Jobless Claims Numbers this morning, and Non-Farm Payrolls tomorrow, this week is all about Jobs and Jobs. So far, there is no sign of any letting up in the strength of the Job market". This morning's much stronger than expected NFP data re-affirmed this strength and quashing any hopes of a softer fed anytime soon.
Since our published trading plans two weeks ago pointing out that week's 4505 level as potential top for the near term, the market has been in a free fall mode. Our models indicate 4310 as the level to close above for the current bearish bias to be negated.
Aggressive, Intraday Trading Plans:
For today, our aggressive intraday models indicate going long on a break above 4351, 4327, 4302, 4283, or 4253 with a 8-point trailing stop, and going short on a break below 4347, 4297, 4279, 4261, or 4248 with a 9-point trailing stop.
Models indicate explicit long exits on a break below 4320 or 4287, and explicit short exits on a break above 4265. Models also indicate a break-even hard stop once a trade gets into a 4-point profit level. Models indicate taking these signals from 09:36am EST or later.
By definition the intraday models do not hold any positions overnight - the models exit any open position at the close of the last bar (3:59pm bar or 4:00pm bar, depending on your platform's bar timing convention).
To avoid getting whipsawed, use at least a 5-minute closing or a higher time frame (a 1-minute if you know what you are doing) - depending on your risk tolerance and trading style - to determine the signals.
(WHAT IS THE CREDIBILITY and the PERFORMANCE OF OUR MODEL TRADING PLANS over the LAST WEEK, LAST MONTH, LAST YEAR? Please check for yourself how our pre-published model trades have performed so far! Seeing is believing!)
NOTES - HOW TO INTERPRET/USE THESE TRADING PLANS:
(i) The trading levels identified are derived from our A.I. Powered Quant Models. Depending on the market conditions, these may or may not correspond to any specific indicator(s).
(ii) These trading plans may be used to trade in any instrument that tracks the S&P 500 Index (e.g., ETFs such as SPY, derivatives such as futures and options on futures, and SPX options), triggered by the price levels in the Index. The results of these indicated trades would vary widely depending on the timeframe you use (tick chart, 1 minute, or 5 minute, or 15 minute or 60 minute etc.), the quality of your broker's execution, any slippages, your trading commissions and many other factors.
(iii) These are NOT trading recommendations for any individual(s) and may or may not be suitable to your own financial objectives and risk tolerance - USE these ONLY as educational tools to inform and educate your own trading decisions, at your own risk.
#spx, #spx500, #spy, #sp500, #esmini, #indextrading, #daytrading, #models, #tradingplans, #outlook, #economy, #bear, #yields, #stocks, #futures, #inflation, #recession, #softlanding, #higher4longer, #higherforlonger, #israel, #geopolitical
