EUR/USD Daily Chart Analysis For August 5, 2022Technical Analysis and Outlook:
The Euro market continues to respect our major Key Res 1.0270. The main target is Mean Sup 1.0111. A slight chance the upside target is continuing to be a possibility to Outer Currency Rally 1.0420.
Geopolitics

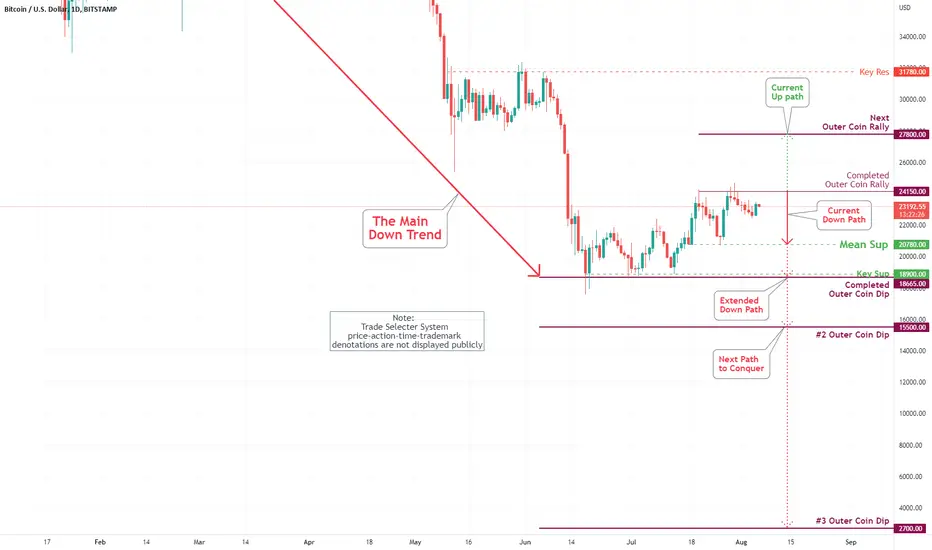
Bitcoin (BTC/USD) Daily Chart Analysis For August 5, 2022Technical Analysis and Outlook:
The repeated retest of completed our Outer Coin Rally of $24,150 took place on July 29,30, and 31. The Mean Sup of $20,780 is the main target. There is a slight chance for a breakout to Outer Coin Rally $27,800.
EUR/USD Daily Chart Analysis For July 29, 2022Technical Analysis and Outlook:
The Euro market has swung back and forth to the U.S. dollar throughout this week's trading session. After creating fresh Mean Sup 1.0111, the currency is poised to retest this support. Currently, the upside target is continuing to be a possibility to Outer Currency Rally 1.0420. An ultimate trip to Outer Currency Dip 0.9765 is in the making.

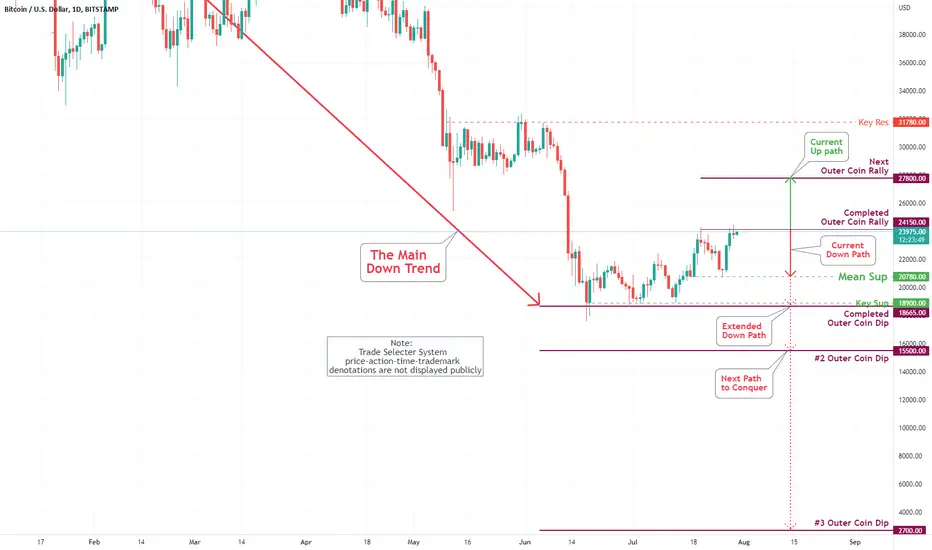
Bitcoin (BTC/USD) Daily Chart Analysis For July 29, 2022Technical Analysis and Outlook:
After completing on July 20 our Outer Coin Rally of $24,150 and retreating to Mean Sup $20,780 (See Bitcoin (BTC/USD) Daily Chart Analysis For July 22), Bitcoin bounced back to competed Coin Rally and showing signs of extending its rally to Outer Coin Rally #27,800. However, if all fails, the coin will take us back down to Mean Sup $20,780, with a strong possibility to Key Sup $18,900 and beyond.
BTCUSD weekly (26/07/2022):
In this logarithmic scale analysis of the BTC/USD pair in BITSMAP, where the trajectory of these fluctuations since their incorporation together with the blockchain in the market is found, we are going to analyze possible key trend changes previously as well as the high probability of having reached a theoretical absolute background.
Mainly we understand on a macro or weekly scale in bitcoin certain bearish patterns of change in trend, we have two similarities in the funds generated in previous cycles and transferred to the current one. In addition, we understand the importance of a Wyckoff change pattern as well as its phases that will be explained in later analyses.
We must pay attention to the minimum areas of the RSI around 25 points. The break of the moving average of 200 periods consolidating under it a brief temporary interval. And finally the gauge cluster pressure zones in the Phoenix Ascending indicated in red.
All this warns us of wonderful long-term Bitcoin buy zones and for Holdeo, with a well-measured key strategy.
Geopolitical uncertainty has yet to give traditional markets great fear scares due to the non-existent supply of cheap gas and the inefficient and insufficient production of electrical energy by Europe.
For winter, major energy crises will be approaching, reflected in the S&P and the NASDAQ as well as the large global markets.
From this humble channel we recommend mainly Europeans or, as in my case, Spaniards, to opt for self-sufficiency in renewable energies, solar or mini-wind self-consumption.
As well as using good analysis to support the prosperous and future growth of certain sectors such as blockchain, energy, minerals or digital tools.
A pleasure as always to share my knowledge through this small channel and I hope you enjoy a wonderful week.
-----------------------------------------------
:
En este análisis en escala logarítmica del par BTC/USD en BITSMAP, donde se halla el recorrido de dichas fluctuaciones desde su incorporación junto a la blockchain en el mercado, vamos a analizar posibles cambios tendenciales clave anteriormente así como la probabilidad alta de haber alcanzado un fondo absoluto teórico.
Principalmente comprendemos a escala macro o semanal en bitcoin ciertos patrones bajistas de cambio de tendencia, tenemos dos similitudes en los fondos generados en los anteriores ciclos y trasladados al actual. Además comprendemos la importancia de un patrón de cambio Wyckoff así como sus fases que se explicarán en posteriores análisis.
Debemos prestar atención a las zonas mínimas del RSI entorno a los 25 puntos. La rotura de la media móvil de 200 periodos consolidando bajo esta un breve intervalo temporal. Y finalmente las zonas de presión del conjunto de indicadores en el Phoenix Ascending indicadas en rojo.
Todo esto nos advierte de zonas maravillosas de compra de Bitcoin a largo plazo y para Holdeo, con una estrategia clave bien medida. La incertidumbre geopolítica aún tiene que dar grandes sustos de miedo a los mercados tradicionales por el suministro inexistente de gas barato y la producción ineficiente e insuficiente de energía eléctrica por parte de Europa. Para invierno se acercarán crisis energéticas grandes reflejadas en el S&P y la NASDAQ asi como los grandes mercados globales.
Desde este humilde canal les recomendamos principalmente a europeos o como en mi caso Españoles optar por la autosuficiencia de energías renovables, autoconsumo solar o miniéolicas. Así como utilizar buenos análisis para fundamentar el prospero y futuro crecimiento de ciertos sectores como blockchain, energías, minerales o herramientas digitales.
Un placer como siempre compartir mi conocimiento por este pequeño canal y espero que disfrutéis de una maravillosa semana.

EUR/USD Daily Chart Analysis For July 22, 2022Technical Analysis and Outlook:
The Eurodollar completed to our Key Res 1.0270. The market appears to be likely to retest our Key Sup 1.0017. Currently, the upside target is possible to Outer Currency Rally 1.0420. An ultimate trip to Outer Currency Dip 0.9765 is in the making.

Bitcoin (BTC/USD) Daily Chart Analysis For July 22, 2022Technical Analysis and Outlook:
Bitcoin hit and completed our outer Coin Rally of $24,150 and currently retreating to Mean Sup $20,780. Extended down the path to Key Sup $18,900 and completed Outer Coin Dip is very probable - #2 Outer Coin Dip $15,500 mark is in the making.

EUR/USD Daily Chart Analysis For July 15, 2022Technical Analysis and Outlook:
The Eurodollar market completed Inner Currency Dip 0.9960. The market appears to be likely to retest our Mean Res 1.0185. Currently, Key Res 1.0270 is the major, primary upside target. An ultimate retest of Key Sup 1.0017 and Outer Currency Dip of 0.9960 is in the making.

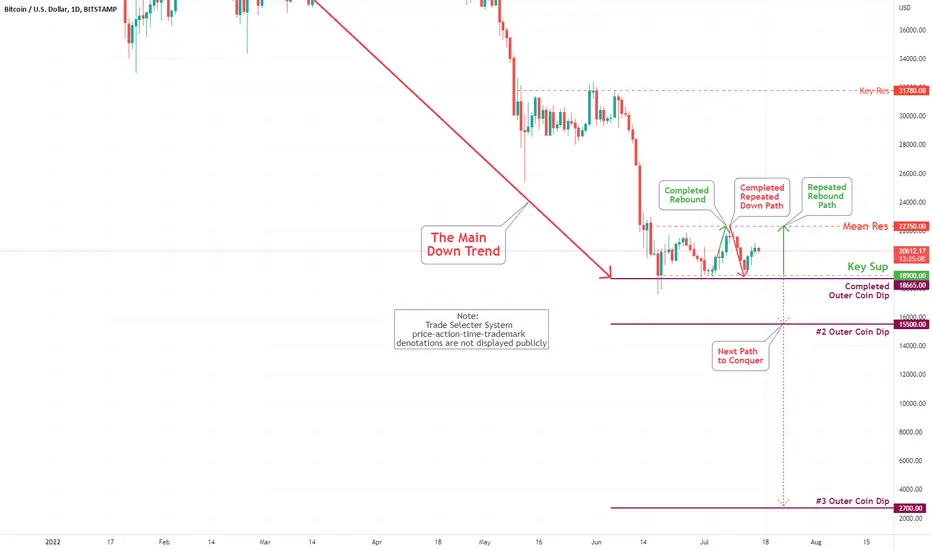
Bitcoin (BTC/USD) Daily Chart Analysis For July 15, 2022Technical Analysis and Outlook:
Bitcoin is trading above $20,000, bouncing off our Key Sup $18,900. The coin is facing up-take to the Mean Res $22,350 mark. If all fails, the coin will take us to the retest of Key Sup $18,900 and #2 Outer Coin Dip $15,500 mark once again, and down we go to #2 Outer Coin Dip $15,500.
EUR/USD Daily Chart Analysis For July 8, 2022Technical Analysis and Outlook:
The Eurodollar market completed Inner Currency Dip 1.0074. The market appears to be likely to fall to retest Key Sup 1.0100 and completed an Inner Currency Dip 1.0074. Currently, Mean Res 1.0270 is the primary upside target. An ultimate Outer Currency Dip of 0.9765 is in the making.

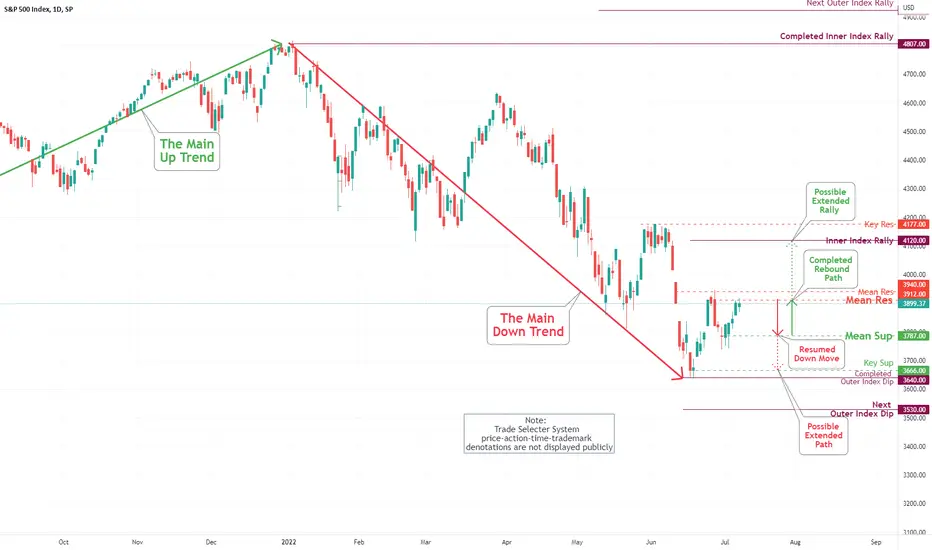
S&P 500 Daily Chart Analysis For July 8, 2022 Technical Analysis and Outlook
The S&P 500 market played out our down move from Mean Res 3912 (See: S&P 500 Daily Chart Analysis For July 1). Currently, we have a down move target specified at Mean Sup 3787, with a possible extended target to Key Sup 3665. However, if all fails, the market will take up the Inner Index Rally 4120 - Major Key Res 4177 is also a forward-looking mark.
S&P 500 Daily Chart Analysis For July 1, 2022 Technical Analysis and Outlook
The S&P 500 market played out our down move from Mean Res 3940 (See: S&P 500 Daily Chart Analysis For June 24). Currently, we have
bounced-up movement targeted at Mean Res 3912 and retest of 3940 - With the extended possibility to Inner Index Rally 4120. However, if all fails, the market will take us down to the newly created Mean Sup 3785, with the opportunity of retesting Key Sup 3666.

EUR/USD Daily Chart Analysis For July 1, 2022Technical Analysis and Outlook:
The Eurodollar market pushed the 1.04 mark on Friday - Our Key Sup 1.038 was the primary show stopper. The market appears to be likely to fall to an Inner Currency Dip of 1.031, and an ultimate Outer Currency Dip of 0.9765 is in the making.

EUR/USD Daily Chart Analysis For June 24, 2022Technical Analysis and Outlook:
The Eurodollar market has been trading under our Mean Res 1.077 and is possibly poised to move higher to the Inner Currency Rally 1.0678. The top Key Res 1.077 is the main show stopper. However, the Inner Currency 1.031 and ultimate Outer Currency Dip 0.9765 is in the making.

S&P 500 Daily Chart Analysis For June 17, 2022 Technical Analysis and Outlook
In the week's trading, the S&P 500 market dropped 5.8 percent and completed our Outer Index Dip 3640. Upon verification (In progress), expect the rebound to Mean Res 3788; however, if all fails, the index will take us to the next Outer Index Dip 3530 mark.

EUR/USD Daily Chart Analysis For June 17, 2022Technical Analysis and Outlook:
The Eurodollar market has been bouncing around throughout the week, settling over the 1.06 mark but then falling below the 1.04 threshold at a certain point - closing at 1.049. The Mean Res 1.058 level is an attraction for the price action, while an outstanding Inner Currency Dip 1.031 looms below. Ultimate Outer Currency Dip 0.9765 is in the making.

EUR/USD Daily Chart Analysis For June 10, 2022Technical Analysis and Outlook:
The Eurodollar got clobbered during the week, mainly on Thursday and Friday trading sessions, as shown on our Daily Chart Analysis For June 3, with the Meen Res 1.077 being the main culprit with the 1.046, 1.038 support level will come into focus in the upcoming trading sessions: Our Inner Currency Dip 1.031 is the ultimate intermediate outcome. Short-term rallies will be in order.

S&P 500 Daily Chart Analysis For June 10, 2022 Technical Analysis and Outlook
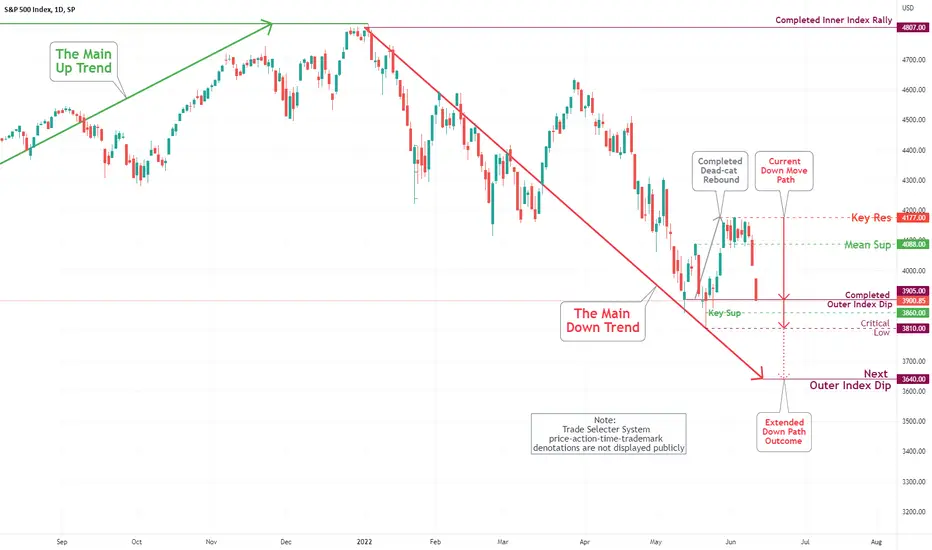
The index bounced between our Mean Sup 4088 and Key Res 4177. But from the Wednesday session, all went downhill, as shown on S&P 500 Daily Chart Analysis For June 3. Critical Key Sup 3860 and low 3810 are the following targets: The ultimate Next Outer Index Dip 3640 is the primary mark. Short-term rallies are expected.
EUR/USD Daily Chart Analysis For June 3, 2022Technical Analysis and Outlook:
The Euro has created a new Mean Res 1.077 and Mean Sup 1.065.
The next strong resistance is in the 1.085mark. On the downside, the Mean Sup 1.056, Mean Sup 1.046, and Key Sup 1.038 are the primary targets - The ultimate Inner Currency Dip is marked at 1.031.

S&P 500 Daily Chart Analysis For May 27, 2022 Technical Analysis and Outlook
From the completed Outer Index Dip 3905, a significant solid dead-cat rebound is in progress. With Mean Res 4088 taken out, the very likelihood destination is marked at Key Res 4296 - from where the renewed down move is expected.

EUR/USD Daily Chart Analysis For May 27, 2022Technical Analysis and Outlook:
The Euro gained quite a bit over the trading week, breaking over our Key Res 1.062 price level. The next strong resistance is in the 1.08 area. On the downside, the Mean Sup 1.056, Mean Sup 1.045, and Key Sup 1.038 are the primary targets - The ultimate Inner Currency Dip is marked at 1.031.

💥 Natural Gas Gas Gas 📈Do I have to recap the current geopolitics for you? Germany is navigating to its black-out because the gas supply from Russia is being capped (stupid German politicians but okay). Because of the lack of nuclear energy, the Europeans will have a certain electricity problem - at least Germany in the coming winter. So, they will import US natural gas on a large scale.
That's the story in a nutshell. The FED and ECB have bloated the circulating money so that some inflation will play its part too.
Looking at the technicals:
We are about to break this triangle formation to the upside. If this breakout gets confirmed, I'm expecting perhaps a re-test of the trendline or breakout level and then a further upward move.
According to the seasonality of the last ten years, Natural Gas has the first spike at the end of April , after this a little bit higher after the middle of May before dropping hard at the beginning of June .
Honestly, I don't know if the seasonality in these global circumstances plays a dominant role. It depends on how strong the inflation kicks in. So I'll decide later if I exit my position in May or if I hodl until October/November.
No investment advice - just my 2 cents on this topic. ;)

S&P 500 Daily Chart Analysis For May 20, 2022 Technical Analysis and Outlook
The down sentiment move is completed with respecting our completed Our Index Dip 3,905 with the possibility of a significant solid rebound to our Mean Res 4,088 is not out of the question.
