Is Mexico's Peso at the Crossroads?The recent imposition of U.S. sanctions on three Mexican financial institutions - CIBanco, Intercam Banco, and Vector Casa de Bolsa - has ignited a crucial debate over the Mexican peso's stability and the intricate dynamics of U.S.-Mexico relations. Washington accuses these entities of laundering millions for drug cartels and facilitating fentanyl precursor payments, marking the first actions under new anti-fentanyl legislation. While these institutions collectively hold a relatively small portion of Mexico's total banking assets (less than 3%), the move carries significant symbolic weight and prompts a re-evaluation of the peso's outlook. The Mexican government, under President Claudia Sheinbaum, swiftly rejected the allegations, demanding concrete evidence and initiating its investigations, including the temporary regulatory intervention of CIBanco and Intercam to safeguard depositors.
Economically, the peso faces a nuanced landscape. Before the sanctions, the Mexican peso (MXN) demonstrated remarkable resilience, appreciating significantly against the dollar, bolstered by Mexico's comparatively higher interest rates and robust trade flows with the U.S. However, the recent divergence in monetary policy, with **Banxico** easing rates while the U.S. Federal Reserve maintains a hawkish stance, now presents a potential headwind for the peso. While analysts generally suggest limited systemic risk to Mexico's broader financial system from these targeted sanctions, the action introduces an element of uncertainty. It raises concerns about potential capital flight, increased compliance costs for other Mexican financial institutions, and a possible erosion of investor confidence, factors that could exert downward pressure on the peso.
Geopolitically, these sanctions underscore the escalating U.S. campaign against fentanyl trafficking, now intricately linked with broader trade and security tensions. President Donald Trump's past threats of punitive tariffs on Mexican imports - aimed at curbing drug flows - highlight the volatile nature of this bilateral relationship. The sanctions serve as a potent political message from Washington, signaling its resolve to combat the fentanyl crisis on all fronts, including financial pipelines. This diplomatic friction, coupled with the ongoing complexities of migration and security cooperation, creates a challenging backdrop for the USD/MXN exchange rate. While the U.S. and Mexico maintain a strong intergovernmental relationship, these pressures test the limits of their collaboration and could influence the peso's trajectory in the medium term.
Geopolitics

EUR/USD Daily Chart Analysis For Week of June 27, 2025Technical Analysis and Outlook:
In the course of this week's trading session, the Eurodollar has exhibited a strong rebound, successfully retesting and surpassing the Outer Currency Rally threshold of 1.163. Recent analyses suggest that the Euro is poised for further upward advancement, with the key target to reach the outer currency rally target of 1.177. Nonetheless, it is essential to recognize the possibility of a subsequent decline to the Mean Support level of 1.160 before a definitive upward movement.

Bitcoin(BTC/USD) Daily Chart Analysis For Week of June 27, 2025Technical Analysis and Outlook:
Throughout this week’s trading session, Bitcoin has demonstrated an upward trajectory and is positioned to achieve the specified targets of Mean Resistance 110300 and Key Resistance 111700. This progression may ultimately culminate in the realization of the Outer Coin Rally 114500 and beyond. Nevertheless, it is crucial to recognize the possibility of a subsequent decline from the current price to the Mean Support level of 104900 before a definitive upward rebound.

Can Gold Regain Ground as Risk Factors Persist?
Gold is holding steady and posting a modest rebound today after notable losses yesterday, though it continues to struggle to reclaim the $3,330 per ounce level.
The precious metal’s ability to resume gains stems from continued market uncertainty surrounding both geopolitical and trade-related risks, which could sustain demand for safe-haven assets.
On the geopolitical front, despite the optimism sparked by the surprise ceasefire agreement that ended the twelve-day war between Israel and Iran, the possibility of renewed escalation remains on the table.
Media outlets have been abuzz with a leaked intelligence report to CNN that was about that the U.S. strike only managed to delay Iran’s nuclear program by a few months and did not eliminate its stockpile of enriched uranium. In other words, the war ended before achieving its core objective—let alone dismantling Iran’s ballistic missile capabilities.
This could also complicate any future negotiations, as Israel may double down on its demands for a complete dismantling of Iran’s nuclear and missile programs, while Tehran may cling even more tightly to these programs following the recent conflict.
On the other hand, New York Times columnist Thomas Friedman expressed hope that the political fallout for both sides might generate internal pressure strong enough to prevent another confrontation.
In any case, should escalation resume, markets may enter a new cycle of geopolitical risk. However, such episodes are unlikely to last long unless the red line is crossed, namely, direct attacks on key oil and gas export infrastructure or on global shipping routes. This logic explains the fragile nature of the risk premiums that both oil and gold gained during earlier waves of escalation.
Now that the latest round of conflict has ended, the market's attention could shift back to trade tensions, which remain unresolved. The suspension of U.S. tariffs on the European Union is set to expire in early July, with the deadline for China following in mid-August.
This comes at a time when businesses still face considerable uncertainty over tariffs and inflationary pressures, as highlighted in recent S&P Global PMI surveys across the Eurozone and the United States .
A return to tariffs or the collapse of trade negotiations could once again ignite fears of persistent inflation, which would likely keep interest rates elevated for longer in the U.S. This, in turn, poses a threat to economic growth. This is the dynamic that has historically been supportive for gold. Conversely, resolving these concerns may strip gold of one of its main drivers, making previous record highs harder to reach.

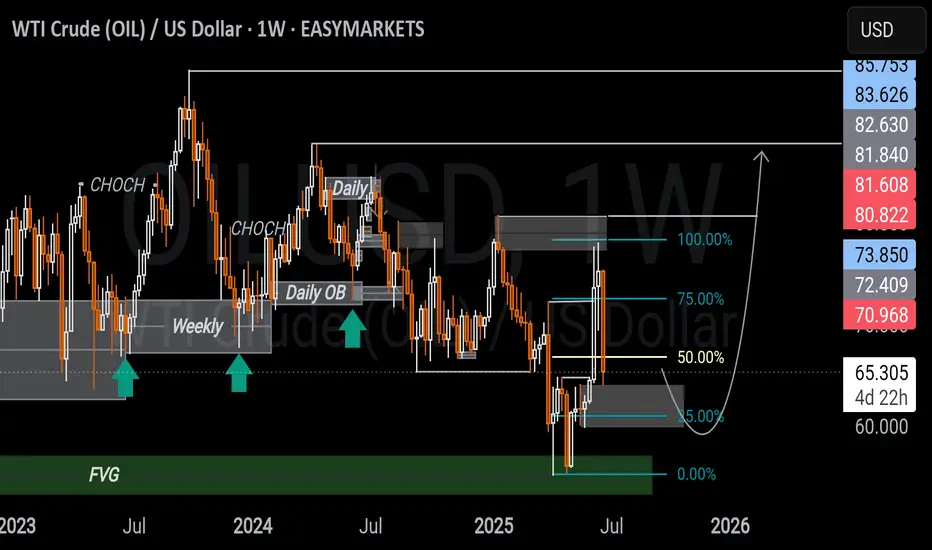
WTI CRUDE OIL USD WEEKLY ANALYSIS Price is reacting from a weekly FVG just below the 50% of a larger range, with some bullish momentum possibly fueled by recent geopolitical tensions.
But price is still within a bearish range acting as resistance, so upside may remain limited unless structure shifts.
A daily bullish OB below the 50% of that range could offer a solid pullback entry if price retraces which is aligning with the broader narrative and upside liquidity. Im having a neutral view of this and leveraging on both sides.
What are your thoughts?
CRUDE OIL poised to go UP AGAIN? Usually my posts on crude oil are short. but here’s a longer one for a change.
Back in December, I predicted that crude oil would hit the highlighted zone around $57. That’s exactly what happened, hit the target and bounced.
Over the past two weeks, we’ve seen wild swings in crude oil prices as tensions between Iran and Israel escalated. But now, following the ceasefire announcement brokered by President Trump, and considering Iran’s response over the past couple of days, crude oil has dropped below its pre-conflict price levels.
While I truly hope for a peaceful world where no innocent lives are harmed, my personal view is that this ceasefire feels fragile and may not last long.
So, what’s next for crude oil? Up or down?
If the ceasefire holds and we don’t see further conflict in the Middle East, I think crude oil could hover in the $65–$75 range. There’s even a slim chance we dip as low as $45.
However, based on my technical analysis model, and my doubts about the durability of the ceasefire, I expect oil prices to rise in the next 6 to 9 months. My targets? $78 and $85.
Of course, I might be wrong this time. :)
Cheers!

Oil Price: Breakout or Fakeout? Watch This Zone Closely Technical Overview:
The current price action is testing the upper boundary of a descending wedge, a bullish reversal pattern. The recent strong green candle indicates a potential breakout attempt, yet price is hovering near a critical resistance level at $74.20 (Fib 0.5).
Key levels from the Fibonacci retracement are:
🔼 Resistance at $74.20 (0.5), then $78.16 (0.618)
🧲 Local support at $69.78 (0.382)
🛡️ Strong demand zone near $63.81 (0.236) if rejection occurs
Structure + Patterns:
Price has been compressing inside a falling wedge, which statistically resolves to the upside.
The breakout candle broke above the 20 EMA and touched the upper wedge resistance — signaling a decision point.
Volume is rising on bullish candles — initial confirmation of buyer interest, but not yet decisive.
Scenarios to Watch
Bullish Case:
Break and close above $74.20 on higher volume → likely move toward $78–$86 resistance zone.
Confirmation of wedge breakout could trigger trend reversal, aligning with bullish fib levels.
Momentum could accelerate if macro factors support demand (see geopolitics below).
Bearish Case:
Failure to close above $74.20 = fakeout risk → price may reject down to $69.78 or even retest $63.81.
Bearish rejection wick on the daily/4H would be an early signal.
Macro & Geopolitical Factors to Monitor:
Middle East Tensions: Any escalation (especially around Iran or shipping lanes) could spike oil due to supply fears.
US Strategic Reserves & Elections: Moves to refill reserves or control inflation could support demand.
China Demand Recovery: Data showing improved industrial output or stimulus from PBoC may strengthen global oil outlook.
Final Thoughts:
Price is at a pivot zone — breaking this wedge with strength could shift the short-to-midterm trend. Until then, this remains a "show me" breakout . Watch how the next 1–2 weekly candles close around the $74–$75 area to confirm direction.

Can Geopolitics Power Tech's Ascent?The Nasdaq index recently experienced a significant surge, driven largely by an unexpected de-escalation of tensions between Israel and Iran. Following a weekend where U.S. forces reportedly attacked Iranian nuclear sites, investors braced for a volatile Monday. However, Iran's measured response - a missile strike on a U.S. base in Qatar, notably without casualties or significant damage - signaled a clear intent to avoid wider conflict. This pivotal moment culminated in President Trump's announcement of a "Complete and Total CEASEFIRE" on Truth Social, which immediately sent U.S. stock futures, including the Nasdaq, soaring. This rapid shift from geopolitical brinkmanship to a declared truce fundamentally altered risk perceptions, alleviating immediate concerns that had weighed on global markets.
This geopolitical calm proved particularly beneficial for the Nasdaq, an index heavily weighted towards technology and growth stocks. These companies, often characterized by global supply chains and reliance on stable international markets, thrive in environments of reduced uncertainty. Unlike sectors tied to commodity prices, tech firms derive their value from innovation, data, and software assets, which are less susceptible to direct geopolitical disruptions when tensions ease. The perceived de-escalation of conflict not only boosted investor confidence in these growth-oriented companies but also potentially reduced pressure on the Federal Reserve regarding future monetary policy, a factor that profoundly impacts the borrowing costs and valuations of high-growth technology firms.
Beyond the immediate geopolitical relief, other crucial factors are shaping the market's trajectory. Federal Reserve Chair Jerome Powell's upcoming testimony before the House Financial Services Committee, where he will discuss monetary policy, remains a key focus. Investors are closely scrutinizing his remarks for any indications regarding future interest rate adjustments, particularly given current expectations for potential rate cuts in 2025. Additionally, significant corporate earnings reports from major companies like Carnival Corporation (CCL), FedEx (FDX), and BlackBerry (BB) are due. These reports will offer vital insights into various sectors' health, providing a more granular understanding of consumer spending, global logistics, and software security, thereby influencing overall market sentiment and the Nasdaq's continued performance.

Crude Oil Prices Rocketing amid geopolitical risks
NYMEX:CL1! NYMEX:MCL1! NYMEX:BZ1!
Macro:
Geopolitical tensions remain high and markets are now likely to price in our scenario discussing ongoing air and missile war, given one-off intervention from the US thus far. According to Reuters, the U.S. now assesses that Iranian retaliation could occur within the next two days.What happens next is anybody’s guess but as traders, it is important to navigate these uncertainties with scenario planning and/or reduce risk to account for increased volatility.
We also get Services and Manufacturing PMI data today and PCE Price Index on Friday. Chair Powell is set to testify on Tuesday 9am CT.
Key levels:
Jan 2025 High: 76.57
2025 High: 78.40
2025 CVAH(Composite Value Area High): 75.68
Key LIS zone: 73.50-73.15
We anticipate the following scenarios in crude oil:
Scenario 1:
Prices remain elevated as tensions remain high, despite limited retaliation, however, the situation overall now escalated beyond return to diplomacy.
Scenario 2:
Any push towards de-escalation, unlikely in our analysis, but given the headline risk, crude prices may remain volatile and come off the highs.
Given our key LIS (Line in Sand) zone above, we favor longs above this and shorts below this zone.

Gold Slides as Markets Downplay the Fallout of ME EscalationGold prices are trending lower today after a slight positive open, struggling to hold near $3,365 per ounce, hovering just above the lowest level in over ten days.
This weak performance comes as markets continue to downplay the consequences of the unprecedented U.S. strike on Iran’s nuclear facilities.
Previously, experts had viewed a strike on Iran’s nuclear sites as the line between a limited bilateral conflict with Israel and a full-blown regional war with global economic costs. Fears centered around a potential Iranian—or proxy—attack on the region’s vital oil and gas infrastructure, which supplies over a fifth of global energy needs.
However, those fears have yet to materialize, offering markets some reassurance that the escalation will not trigger a major shock that could reignite concerns over global economic stability. This narrative of containment has stripped gold of the geopolitical risk premium it previously enjoyed.
According to the New York Times , some experts believe Iran is unlikely to disrupt energy flows in the region as long as its own export facilities remain intact. In another word, any Iranian attempt to destabilize energy markets may invite retaliatory strikes on its own vital oil infrastructure—further damaging its already fragile economy. Axios quoted Brookings Institution foreign policy director Suzanne Maloney describing Iran’s parliamentary call to shut the Strait of Hormuz as symbolic, arguing that the Islamic Republic is unlikely to risk its economy or the rapprochements with Gulf neighbors.
That said, the Middle East’s unpredictable trajectory, with near-daily escalations, continues to unsettle markets and sustain elevated risk appetite, which could ultimately benefit gold.
In a New York Times opinion piece , Nicholas Kristof outlined three key risks that could stem from the U.S. strike on Iranian nuclear facilities: the nature of Iran’s response, whether the strike set back or accelerated Iran’s nuclear ambitions, and whether this is a step toward a broader war.
Iran’s response could range from symbolic gestures to reckless escalation, potentially dragging the U.S. deeper into direct involvement.
According to the Wall Street Journal , Tehran may choose to strike at evacuated U.S. bases in the region, as it did in response to the 2020 assassination of Qassem Soleimani, when Iran targeted the Ain al-Asad base in Iraq in what was described as a calculated, non-escalatory response. Alternatively, Iran could intensify missile strikes on Israel—viewed by some as Washington’s largest forward base—thus keeping the conflict somewhat localized for now.
Still, Iranian Supreme Leader Ayatollah Ali Khamenei may ultimately reject a ceasefire, unlike what his predecessor Ayatollah Ruhollah Khomeini did in the late 1980s to preserve the Islamic Republic. This keeps the door open to new and unpredictable rounds of conflict, according to The Times .
On the nuclear front, Washington Post columnist David Ignatius warned in an opinion piece that Iran could pursue a crude radioactive “dirty bomb” using highly enriched near weapons-grade enriched uranium. Such a scenario would also be dangerously uncertain. In my opinion, it is unlikely that the U.S. or Israel would simply stand down after such a development, possibly setting the stage for the most extreme and dangerous escalation yet.
This could align with the protracted duration of the war and reports that Israel’s defensive missile stockpiles are running low, which raising the stakes. Israel may feel compelled to force Iran into surrender, as the U.S. did with Japan, though unlike Japan, Iran could be a nuclear state. Given Prime Minister Netanyahu’s political stance, a settlement that leaves Iran’s nuclear or ballistic program intact is unlikely to be accepted. Iran, for its part, firmly rejects dismantling its programs, adding to the likelihood of prolonged conflict and worst-case scenario.
Despite the market’s muted reaction to the U.S. strike, the surrounding risks remain significant and unresolved. As long as their realization remains uncertain, volatility in gold and oil prices may persist until the conflict is either resolved or definitively contained.
Samer Hasn

Can Geopolitics Redefine Market Risk?The Cboe Volatility Index (VIX), which analysts widely dub the "fear gauge," currently commands significant attention in global financial markets. Its recent surge reflects profound uncertainty, particularly from escalating geopolitical tensions in the Middle East. While the VIX quantifies market expectations for future volatility, its current elevation signals more than mere sentiment. It represents a sophisticated repricing of systemic risk, capturing the implied probability of significant market dislocations. Investors find it an indispensable tool for navigating turbulent periods.
The dramatic escalation of the Iran-Israel proxy conflict into a confrontation, involving the United States, directly fuels this heightened volatility. Israeli airstrikes on Iranian military and nuclear facilities on June 13, 2025, prompted swift Iranian retaliation. Subsequently, on June 22, the U.S. launched "Operation Midnight Hammer," conducting precision strikes on key Iranian nuclear sites. Iran's Foreign Minister immediately declared diplomacy over, holding the U.S. responsible for "dangerous consequences" and vowing further "punishment operations," including a potential closure of the Strait of Hormuz.
This direct U.S. military intervention, particularly targeting nuclear facilities with specialized munitions, fundamentally alters the conflict's risk profile. It moves beyond proxy warfare into a confrontation with potentially existential implications for Iran. The explicit threat to close the Strait of Hormuz, a critical global chokepoint for oil supplies, creates immense uncertainty for energy markets and the broader global economy. While historical VIX spikes from geopolitical events often prove transient, the current situation's unique characteristics introduce a higher degree of systemic risk and unpredictability. The Cboe VVIX Index, measuring the VIX's expected volatility, has also risen to the higher end of its range, signaling deep market uncertainty about the future trajectory of risk itself.
The current environment necessitates a shift from static portfolio management to a dynamic, adaptive approach. Investors must re-evaluate portfolio construction, considering long exposure to volatility through VIX instruments as a hedging mechanism, and increasing allocations to traditional safe havens like U.S. Treasuries and gold. The elevated VVIX implies that even the predictability of market volatility is compromised, demanding a multi-layered risk management strategy. This specific confluence of events might signify a departure from historical patterns of short-lived geopolitical market impacts, suggesting geopolitical risk could become a more ingrained and persistent factor in asset pricing. Vigilance and agile strategies are paramount for navigating this unpredictable landscape.

Beyond the Headlines - Gold Outlook June 16-20, 2025Beyond the Headlines: Gold's Ascent Amidst Global Shifts & Key Technicals 🌐🚀
Everything about the last week can be found here:
OANDA:XAUUSD 💰📈
We all know what's going on, I believe. Israel struck Iran 💥, and this conflict will likely take a bit before things cool down. 🥶
---
## Geopolitical News Landscape 🌍📰
### Israel / Iran
Since June 12, Israel launched "Operation Rising Lion," targeting Iranian nuclear sites like Natanz and Esfahan – over 128 killed, Iran claims. 🇮🇷 retaliated with missile and drone strikes on Haifa and Tel Aviv, killing at least 10. 🚀
**Outlook:** 🔥 Tensions are spiraling. Without urgent mediation, full-scale regional war remains a real risk. 💣
### India / Pakistan
Since the May ceasefire, few clashes have occurred. However, both navies increased readiness, signaling potential escalation at sea. 🚢
**Outlook:** ⚖️ Peace is fragile. A strategic dialogue is key to avoiding a renewed border or maritime conflict. 🙏
### Gaza Conflict
Between June 7–15, Israeli strikes killed at least 41 Palestinians, including 8 near an aid center in Rafah. Over 55,000 total deaths, and famine is looming. 💔
**Outlook:** 🆘 Gaza remains a humanitarian catastrophe. Global pressure for access and a ceasefire must intensify. 🕊️
### Russia / Ukraine
June 13–15: Russia returned the bodies of 1,200 Ukrainian soldiers in a rare POW swap gesture. 🤝 Fighting remains intense in Sumy and Toretsk; Russia hit a major oil refinery. 🏭
**Outlook:** 🕊️ While symbolic moves continue, no peace is in sight – battlefield outcomes will shape diplomacy. ⚔️
### U.S. - China Trade War
The U.S. hiked tariffs to 55% on key Chinese goods. 🇺🇸🇨🇳 responded with 10% on U.S. imports. Talks yielded a partial truce, but military-use rare earths remain unresolved. 💻
**Outlook:** 🔧 Tech remains the battleground. Without progress on critical materials, the trade war may deepen. 📉
### Global Trade War
The OECD revised global growth downward due to rising tariffs from the U.S. targeting 🇨🇳, 🇲🇽, 🇨🇦. Global trade volume is expected to shrink by 0.2–1.5%. 📉
**Outlook:** ⛓️ Supply chain disruption is spreading. Global trade will stay under pressure without coordinated policy. 🌍➡️🌍
### Trump vs. Powell
Trump labeled Powell a "numbskull" for not cutting rates, suggesting he might "force something" if re-elected. 🗳️ The Fed maintains policy independence ahead of a critical June decision. 🏛️
**Outlook:** ⚔️ Political pressure on the Fed is mounting. Expect more friction as the election cycle heats up. 🔥
### U.S. Inflation
CPI rose 2.4% YoY in May (from 2.3%); Core CPI held steady at 2.8%. Monthly growth was modest at 0.1%. Key rises were seen in healthcare and vehicle prices. 🚗🏥
**Outlook:** Inflation is stable but sticky. 🚦 The Fed will likely hold rates steady until clearer disinflation signals appear. 📊
---
## Technical View 📐📈
### Market Structure:
Gold shows a clear **bullish market structure** with higher highs and higher lows. ⬆️ Recent price action suggests we're in a strong uptrend with institutional buying pressure. 🏦
### Key Levels:
* The chart shows a significant low around the **$3,245 area** (marked as "Low") which could act as a key institutional support level. 💪
* The current high near **$3,446** represents a potential institutional resistance zone. 🛑
* Look for potential **order blocks** around the **$3,380-$3,400 range** where price consolidated before the recent breakout. 🧱
### Fair Value Gaps (FVG):
There appear to be several gaps in the price action during volatile moves, particularly during strong rally phases. These could act as future support/resistance areas. 📉📈
### Gann Analysis:
The price movement shows strong adherence to Gann principles:
* The rally from the low follows a steep angle, suggesting strong momentum. 🚀
* Key Gann angles would place support around the **$3,300-$3,320 zone**. 📐
* The current price near **$3,436** is testing natural resistance levels based on Gann square calculations. 📏
### Fibonacci Levels:
From the significant swing low to the current high:
* 23.6% retracement: ~$3,395 📉
* 38.2% retracement: ~$3,370 📉
* 50% retracement: ~$3,345 📉
* 61.8% retracement: ~$3,320 📉
The golden ratio levels suggest key support on any pullback would be around the **$3,370-$3,345 zone**. ✨
### Institutional Levels:
* **Weekly/Monthly Levels:** The **$3,400** and **$3,450** areas appear to be significant institutional levels based on round numbers and previous price action. 🏦💰
* **Smart Money:** The accumulation pattern before the breakout suggests institutional participation. 🧠💡
### Cycle Timing:
Based on the timeframe (appears to be 30-minute bars from May 26-June 15):
* We're seeing approximately **3-week cycles** in the major moves. 🗓️
* The current rally phase appears to be in its mature stage. 🌳
* The next potential cycle turn could be approaching, suggesting caution for new longs at current levels. ⚠️
---
### Trading Considerations:
* Watch for rejection at current levels near **$3,446**. 📉
* Key support confluence around **$3,370-$3,345** for potential re-entry. 🎯
* Volume and momentum divergences would be critical for timing any reversal. 📊🔄
Other indicators tend to show bullish scenario enhancements. 🚀
Gold has formed a ** Standard Bullish Flag pattern ** over a time from early April till today. 🚩🐂
Also, the structure of a ** reverse Head & Shoulders ** is existing and has broken the neckline! 🔄🗣️
Another indicator is an existing "** Ascending Bull Flag **." ⬆️🚩
Please take the time to let me know what you think about this. 💬
-------------------------------------------------------------------------
This is just my personal market idea and not financial advice! 📢 Trading gold and other financial instruments carries risks – only invest what you can afford to lose. Always do your own analysis, use solid risk management, and trade responsibly.
Good luck and safe trading! 🚀📊

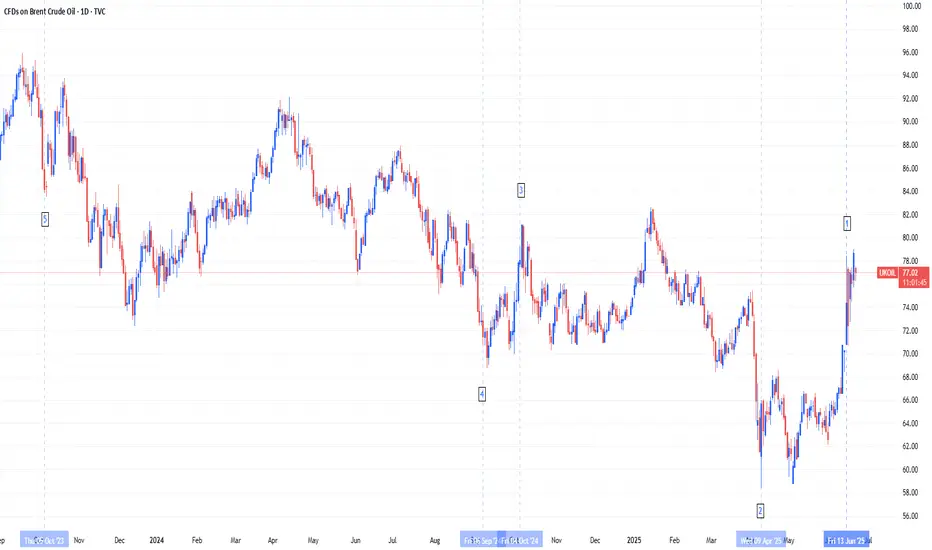
Brent Crude Oil's Defining Moments: Analyzing the Top 5 MovesThe oil market has experienced unprecedented volatility over the past two years, with five pivotal moments generating the most significant price movements in Brent crude.
The Top 5 Market Movers:
1. June 13, 2025 (+7.02%): Israeli airstrikes on Iranian nuclear and oil facilities triggered the largest single-day surge to $74.23/barrel, demonstrating how geopolitical events can instantly drive supply disruption fears.
2. April 8, 2025 (-15.67% over 5 days): Trump's tariff escalation and US-China trade war intensification caused the most severe multi-day decline, ending at $62.82/barrel as traders priced in global economic slowdown.
3. October 7, 2024 (+12.76% over 5 days): Escalating Israel-Iran tensions drove a significant rally to $80.93/barrel as markets built in geopolitical risk premiums ahead of expected retaliatory strikes.
4. September 3, 2024 (-6.41%): Libya's oil dispute resolution combined with weak global demand outlook caused a sharp drop to $73.75/barrel, showing how supply resolutions can trigger selloffs.
5. October 6, 2023 (-11% weekly crash): The end of driving season combined with demand concerns and interest rate fears triggered the biggest weekly decline since March 2023, with Brent falling to $84.07/barrel as gasoline demand hit yearly lows.
Current Fundamental Landscape and Path Forward
The EIA forecasts Brent averaging $66/barrel in 2025 and $59/barrel in 2026, below recent levels due to trade uncertainties and slower growth. Three key factors will drive future prices: US-China trade resolution, Middle East geopolitical risks, and OPEC+'s production strategy. Recent volatility shows that while fundamental supply-demand dynamics remain important, geopolitical events, trade policies, and seasonal demand patterns can generate dramatic price swings that overwhelm traditional market forces.
Will Middle East Flames Ignite Winter Gas Prices?The global natural gas market is currently navigating a period of profound volatility, with prices surging and defying typical seasonal trends. This significant upward movement is primarily driven by escalating geopolitical tensions in the Middle East, specifically the intensifying conflict between Iran and Israel, coupled with the looming potential for direct US military intervention. This complex interplay of factors is fundamentally reshaping perceptions of global energy supply and influencing investor sentiment, pushing natural gas prices towards critical psychological and technical thresholds.
Direct military strikes on Iran's energy infrastructure, including the world's largest gas field, the South Pars, have introduced a tangible threat to supply at the source. This is compounded by the strategic vulnerability of the Strait of Hormuz, a vital maritime chokepoint through which a significant portion of the world's liquefied natural gas (LNG) transits. Despite Iran possessing the world's second-largest natural gas reserves and being the third-largest producer, international sanctions and high domestic consumption severely limit its export capabilities, making its existing, albeit modest, export volumes disproportionately sensitive to disruption.
Europe, having strategically pivoted to LNG imports following the reduction of Russian pipeline gas, finds its energy security increasingly tied to the stability of Middle Eastern supply routes. A prolonged conflict, especially one extending into the crucial winter months, would necessitate substantial LNG volumes to meet storage targets, intensifying competition and potentially driving European gas prices higher. This environment of heightened risk and volatility also attracts speculative trading, which can amplify price movements beyond fundamental supply-demand dynamics, embedding a significant geopolitical risk premium into current market valuations.
This confluence of direct infrastructure threats, critical chokepoint risks, and Europe's structural reliance on global LNG flows creates a highly sensitive market. The trajectory of natural gas prices remains inextricably linked to geopolitical developments, with potential for further substantial increases in an escalation scenario, or sharp reversals should de-escalation occur. Navigating this landscape requires a keen understanding of both energy fundamentals and the intricate, often unpredictable, currents of international relations.

Geopolitical Oil Shocks May Be Short-Lived and Prices May Fall
Crude oil prices are climbing by over 1% today across both Brent and West Texas Intermediate, approaching their highest levels since January.
These gains are driven by rising concerns over the fallout from a potential escalation in the Israel–Iran war, especially with the prospect of direct U.S. military involvement that could widen the conflict and threaten oil supplies from the Middle East.
Talks are intensifying around a possible U.S. strategic bomber strike on Iran’s Fordow uranium enrichment facility. Such a move would mark a dangerous new phase of escalation, raising the risk of supply disruptions from key oil-exporting countries via the Strait of Hormuz or the Bab el-Mandeb Strait, according to several analysts and opinion columnists . Iran’s major oil export facilities may also be pulled into the conflict sooner rather than later.
Any attack on these energy assets could trigger a price shock that sends oil soaring toward $130 per barrel, according to estimates from JPMorgan .
The first step toward this new phase of escalation may not be far off, as former President Trump appears unshaken by potential consequences—the include regional instability to possible retaliatory attacks on U.S. and allied interests abroad. According to Axios , he is doubtful about the effectiveness of the bunker-busting bombs intended for a Fordow strike.
Even without such a strike, a prolonged conflict with little hope for a diplomatic resolution would likely increase the vulnerability of global oil flows, as reported by the Wall Street Journal earlier this week. However, such disruptions are expected to remain short-term, in my opinion.
In the longer run, this war is unlikely to be sustainable in its current form. Israel is reportedly facing a dwindling supply of interceptor missiles, with reserves potentially lasting just 12 more days at the current rate of Iranian rocket fire, according to experts cited by The Washington Post . The Journal also quoted a U.S. official who mentioned a decline in Israel’s supply of Arrow missiles used to intercept ballistic threats.
In my view, Israel will likely avoid reaching such a tipping point unless it achieves a decisive turning point in the conflict, whether through sidelining U.S. involvement or toppling Iran’s regime. If neither is achieved, Israel may resort to targeting Iran’s oil and gas export infrastructure to enforce a surrender. This action that could send oil prices into shock in the coming days. A drawn-out war in its current form is unsustainable for either side.
Still, a diplomatic solution is not entirely off the table. A senior Iranian foreign ministry official told the New York Times that Tehran may accept Trump’s offer to meet soon for a potential ceasefire discussion. Such developments could reduce the geopolitical risk premium priced into oil and potentially push U.S. crude back below $70 per barrel.
In any case, I believe any shock to oil prices would likely be temporary, as major producers are generally capable of offsetting short-term supply disruptions unless we enter into extreme scenarios, as noted by the Wall Street Journal’s Editorial Board earlier this week.
On another front, oil prices are also under increasing pressure from concerns around prolonged monetary tightening by the Federal Reserve. Jerome Powell’s speech yesterday disappointed markets, striking a more hawkish and cautious tone than before on interest rate cuts.
Policymakers have grown increasingly wary of inflation risks, particularly with the renewed trade war and rising geopolitical tensions, which could potentially push inflation above 3 percent again.
Such extended tightening could weigh further on economic growth or even trigger a recession, dragging down oil demand and keeping prices on a downward trajectory.
Monetary tightening risks also overlap with persistent negative signals from China. Despite improvements in retail sales and declining unemployment, both industrial production and fixed-asset investment slowed unexpectedly in May. Goldman Sachs also expects continued weakness in China’s housing market, which could remain at just a quarter of its 2017 peak level for years to come.
Should trade negotiations between the U.S. and China fail, both economies and oil prices could face further downward pressure.
Samer Hasn

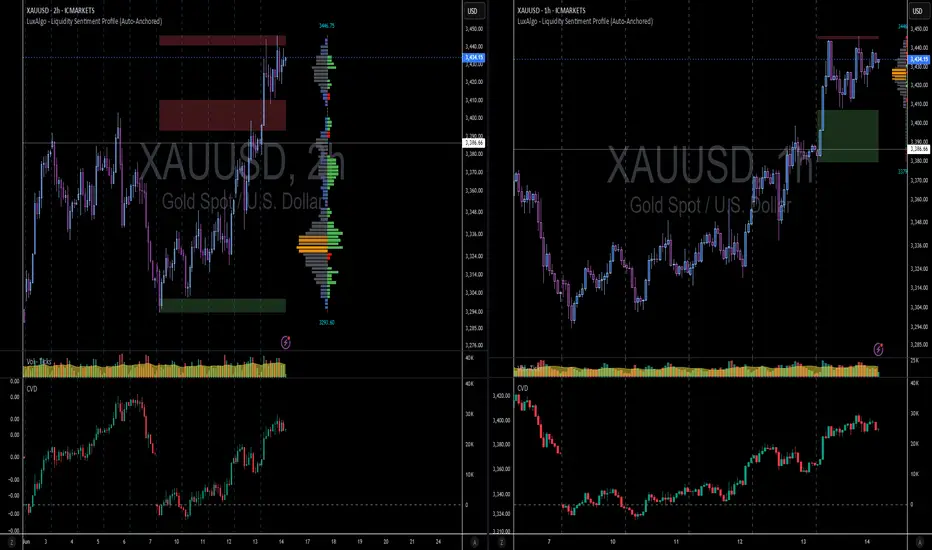
Gold Loses Shine Amid Hopes the Middle East War Remains Under Co
Gold is showing little movement today, holding near $2,386 per ounce after a drop of over 1.4% yesterday.
This weak performance comes as market fears over the fallout from the Israel-Iran conflict have eased. Investors are hopeful that energy supplies flowing from the region to the rest of the world will not face major disruption.
Scenarios that could shock oil prices, according to Axios , include Israel striking Iran’s key export facilities, Iran targeting production sites in the region, or the closure of the Strait of Hormuz. None of these developments have occurred so far, which has kept fears of renewed inflation and persistently high interest rates in check.
The Editorial Board of the Wall Street Journal believes that global oil production capacity can absorb supply disruptions unless they are catastrophic, such as a closure of the Strait of Hormuz.
As long as the conflict does not severely disrupt energy supplies, markets may downplay its impact. This limits the geopolitical risk premium that would otherwise support further gains in gold prices.
However, if diplomacy fails to contain the conflict soon, Iran may choose to escalate it by shutting down the Strait of Hormuz, according to experts cited by The Journal . This concern could prompt the US and Gulf states to intensify diplomatic efforts or even pull the US directly into the conflict.
Beyond the military situation, markets are watching developments in the US-China trade dispute, where talks have yet to make meaningful progress. The lack of a breakthrough could push the US to impose restrictions on semiconductor exports and manufacturing equipment, threatening billions in American corporate sales, according to The Journal .
Such moves might trigger further escalation by China, which holds leverage through its dominance in rare earth metals. Renewed tensions could disrupt supply chains and drive inflation even higher.
Although recent inflation data do not suggest a sudden surge in prices, experts told The New York Times that the effects of tariffs and supply chain disruption may take months or even over a year to feed through to consumer prices. This is partly because sellers can rely on pre-tariff stockpiles and offer discounts for a period.
Failure to resolve these issues could see inflation rebound, keeping interest rates high at levels that the economy may not be able to bear. The chief economics commentator at The Journal wrote last week that the Federal Reserve should shift its focus from fighting inflation to supporting the economy through rate cuts, given signs of labor market weakness.
Persistently high rates or further increases, along with rising bond yields, may not weigh on gold. On the contrary, they could support demand for the safe-haven asset as worries about slowing growth and recession deepen.
Uncertainty in the bond market remains high compared to levels before the Ukraine war in 2022, as shown by the ICE BofAML TVC:MOVE index, which measures fear in the US Treasury bond market. This could limit the downward pressure of rising yields on gold prices.
Markets are awaiting tomorrow’s Fed decision on interest rates, with attention focused on Jerome Powell’s remarks after the announcement. A stronger Fed stance on keeping rates elevated for longer might temporarily pressure gold. However, renewed concerns about economic growth could quickly restore demand for the yellow metal.
Data from China also continue to fuel economic worries. Recent figures show industrial production and fixed-asset investment growth slowing more than expected, which could bolster demand for safe-haven assets like gold.
Samer Hasn

Bitcoin Consolidates Near Highs — Bullish Wedge Signals StrengthHolding Strong Amid Uncertainty:
Despite rising geopolitical tensions, Bitcoin remains resilient, trading near recent highs. This stability reflects strong institutional confidence and sustained accumulation by long-term holders.
Bullish Technical Setup:
The ongoing consolidation between $100,000 and $110,000 is forming a wedge pattern—a classic bullish continuation structure. This suggests the market is coiling for its next major move.
Key Levels to Watch:
Immediate Resistance: $112,500
Support Zone: Holding above $100,000 keeps the bullish case intact
Measured Move Target: $130,000–$135,000
Outlook:
This tight consolidation signals a healthy pause in a strong uptrend, positioning Bitcoin for a potential breakout and continuation higher. All signs point to the bulls remaining firmly in control.
#Bitcoin #BTC #TechnicalAnalysis #BullishWedge #CryptoMarket #InstitutionalBuying #PriceAction #Geopolitics #SupportAndResistance #BullRun

Weekly Market Outlook: FOMC, Trade Deals and GeopoliticsIt is a holiday-shortened week, with the majority of markets halting early on Thursday, June 19, 2025, in observance of Juneteenth. See here for holiday trading schedule
Key Themes to Monitor This Week
Geopolitical Risks
Any outside intervention in the ongoing Israel-Iran conflict will likely be seen as a risk-off event by market participants. Despite Friday’s sell-off, markets shrugged off during the Sunday open and overnight sessions.
There are potential risks to trade routes and energy infrastructure, although disruptions seem unlikely at the moment. Amena Bakr at Kpler noted that, so far, there are no signs of disruptions in oil loadings from Iran. Without a supply outage, there is no pressing need for additional barrels to be brought onto the market.
Trade War and Trade Deals
There have been recent developments with the U.S. reaching key trade deal milestones with several countries. The baseline scenario remains optimistic, with expectations for an extension in negotiations and potential reciprocal tariffs for countries failing to reach agreements.
FED Week
This is a key week for U.S. monetary policy, with the FOMC decision, Summary of Economic Projections (SEP), and Chair Powell’s press conference scheduled.
Traders will be closely watching how the Fed’s inflation and growth expectations have evolved, as reflected in the SEP. All eyes will be on the dot plot to note how interest rate expectations have evolved since last quarter. Of note: Will President Trump’s continued calls for rate cuts influence Chair Powell’s tone or guidance?
Expectations for the Week Ahead
NQ futures have continued one-time framing higher, consistently creating higher lows since the week of April 21, 2025. A strong support zone exists below, anchored at the yearly Volume Point of Control (VPOC) and the Anchored VWAP from May 11, 2025, when markets gapped higher.
Key Levels to Watch
• yVAH: 22,690.50
• R2: 22,510
• R1 / Previous Week High: 22,322.50
• May 11 AVWAP: 21,672.25
• yVPOC: 21,660
Scenario 1: Market Grinds Higher but Stays Cautious
Despite several looming risk factors, the market could continue to grind higher. In this scenario, we anticipate a test above the prior week's high, followed by a potential pullback into last week’s range.
Example Trade Idea 1
• Entry: 22,000
• Stop: 21,930
• Target: 22,322
• Risk: 70 pts
• Reward: 322 pts
• Risk-Reward Ratio: 4.6R
Scenario 2: Pullback to Support, Range-Bound Consolidation
If the market pulls back, we expect the yearly VPOC and AVWAP from May 11 to act as key support levels. In this case, price action may remain range-bound within the previous week’s range, forming an inside week.
Example Trade Idea 2
• Entry: 21,672
• Stop: 21,600
• Target: 22,000
• Risk: 72 pts
• Reward: 328 pts
• Risk-Reward Ratio: 4.6R
________________________________________
Glossary
• VPOC: Volume Point of Control
• VA: Value Area
• VAL: Value Area Low
• VAH: Value Area High
• VP: Volume Profile
• AVP: Anchored Volume Profile
• Y: Yearly
• pWk: Previous Week

Turbulent Week Ahead? Gold Outlook June 9-13, 2025Hey fellow traders,
Let's dive into the OANDA:XAUUSD outlook for the upcoming week, June 9-13, 2025. The recent price action has been a rollercoaster 🎢, and the next few days promise even more fireworks 🎇.
Looking back at the 30-minute chart from May 22 to June 6, gold saw an initial consolidation, then a strong rally to multi-week highs near 3,420. However, this was followed by a sharp, dramatic reversal, pushing prices back below 3,300. This "bull trap" 🐂 pattern suggests underlying weakness and potential preemptive market positioning.
Another view on this could be the possibility that a gap on the chart at 3300-3295 of around $5 could get closed. Since strong support is right below this, it could serve as a good launchpad 🚀 for an upward rally. Let's see if the upcoming Asia session on Monday triggers this because its only - $14 from $3309.
Key Drivers for the Week Ahead:
📅 June 9, 2025 (Monday)
US-China High-Level Trade Talks Commence in London
High-level delegations from the United States and China began trade discussions in London. This meeting followed an announcement by President Donald Trump on Friday, June 6, 2025, who described a preceding 90-minute phone call with Chinese President Xi Jinping as "very positive".
The US delegation included Treasury Secretary Scott Bessent, Commerce Secretary Howard
Lutnick, and US Trade Representative Jamieson Greer, reflecting a coordinated approach to addressing complex trade issues. The talks were primarily aimed at resolving the ongoing bilateral trade war, with a particular focus on tariffs and the global supply of critical rare earth minerals.5 While no specific time for the commencement of talks was provided, it is understood they began during London's daytime, approximately (10:12 CEST / 04:12 EDT).
These discussions occurred in the context of a temporary 90-day agreement reached on May 12, 2025, which had seen the US reduce its tariffs on Chinese imports from 145% to 30%, and China reciprocate by lowering its tariffs on US goods from 125% to 10%.9 However, this temporary truce is set to expire in early August, and President Trump had recently accused China of violating the agreement, specifically regarding critical mineral exports. The broader bilateral relationship remains strained by issues extending beyond tariffs, including restrictions on advanced chips, student visas, and concerns over China's state-dominated economic model.
The prompt scheduling of these high-level talks immediately after a leader-to-leader call suggests a tactical move towards de-escalation of immediate trade tensions, aiming to prevent a full-blown trade war. The objective appears to be managing current conflicts rather than achieving a fundamental resolution, especially with the May 12 agreement nearing its expiration. The core disputes, such as control over rare earths and technology, are deeply entrenched and reflect a broader geopolitical competition rather than mere economic disagreements. This pattern of temporary de-escalation followed by persistent underlying tensions indicates a long-term,structural competition. It suggests that trade policy is increasingly intertwined with national security and geopolitical strategy, implying that businesses should anticipate continued volatility and strategic decoupling in certain sectors, rather than a return to pre-trade war normalcy.
Other big movers for gold will be the US inflation reports. 💥
📅 Wednesday, June 11 (14:30 CEST / 08:30 EDT):
We get the crucial US Consumer Price Index (CPI) data.
Watch for Core CPI (YoY) with a forecast of 2.9% and headline CPI (YoY) at 2.5%.
📅 Thursday, June 12 (14:30 CEST / 08:30 EDT):
The US Producer Price Index (PPI) follows.
Forecasts are for Core PPI (YoY) at 3.0% and headline PPI (YoY) at 2.6%.
📊 These numbers are critical. If inflation comes in hotter 🔥 than expected, it will likely strengthen the US Dollar 💵 and push real interest rates higher 📈, making gold less attractive. This could trigger further declines 📉, especially given the current market structure. Conversely, cooler 🧊 inflation could spark a significant rebound 🔄.
Beyond US data, keep an eye 👁️ on speeches from various European Central Bank (ECB) officials throughout the week, including President Lagarde on Tuesday (23:15 CEST / 17:15 EDT). Their collective tone 🎤 could influence EUR/USD dynamics and indirectly impact the US Dollar Index, offering a counterbalance ⚖️ or amplification to gold's movements.
Key Numbers and Technical Levels to Watch:
Gold is currently sitting on a substantial speculative net long position of 187.9K contracts. This is a massive amount of bullish bets 📊🐂, making gold highly vulnerable to rapid liquidation 💣 if the fundamental picture turns sour. A "long squeeze" could amplify any downside move.
Immediate Support: The 3,300 level is paramount. A decisive break below it would signal further weakness. Below that, 3,250 is strong technical support where we saw a bounce previously.
Overhead Resistance: Look for resistance at 3,350-3,360, and then the recent peak of 3,420. Reclaiming these levels would require a significant shift in sentiment.
Expect high volatility ⚡, especially around the US inflation releases. Trade smart 🧠, manage your risk ⚖️, and stay nimble! 🏃
Geopolitical News Landscape 🌍
India / Pakistan
The ceasefire from May 10 is holding, but diplomatic relations remain frosty. India has launched a global image campaign to gain support, while Pakistan insists on dialogue and accountability.
Outlook: Without substantial agreements on border terrorism and water issues, tensions will stay latently high, with potential for new escalation risks. ⚠️
Gaza Conflict
Violence escalated again in early June. Israel intensified attacks, killing civilians seeking aid in Gaza City, and at least six people were killed at a distribution point.
Outlook: The humanitarian situation continues to worsen 🚨, and international mediation efforts are urgently needed. However, an immediate ceasefire seems unrealistic. ❌
Russia / Ukraine
In the first week of June, Russia launched one of its largest series of attacks: hundreds of drones and missiles hit Kharkiv and Kyiv, resulting in civilian casualties. Simultaneously, a planned prisoner exchange has stalled.
Outlook: Strategic air attacks will likely continue 💥, and the prisoner exchange remains deadlocked. Without a diplomatic initiative, the conflict will stay entrenched. 🕳️
U.S.–China Trade War
Following talks between Trump and Xi, new negotiation rounds are expected in London. China has opened up rare earth exports, a sign of cautious de-escalation.
Outlook: If dialogue channels open 🗣️, systemic trust could grow, but genuine reforms remain uncertain. 🤔
🌐 Global Trade War
The OECD has lowered its growth outlook to 2.9%, warning of protectionism 🧱 and delayed investments. The ECB is also maintaining synchronization with the FED.
Outlook: Without de-escalation, the world faces a global economic slowdown 🐌 and permanent fragmentation of supply chains. 🔗
🏛 Trump vs. Powell
Trump has again complained about the FOMC's hesitancy, nicknaming Powell “Too Late,” and demanding a full 1% interest rate cut.
Outlook: Pressure is mounting 📣. Whether the Fed yields depends on if inflation and labor data allow for a loose policy. 🎯
💵 U.S. Inflation – May 2025
Forward-looking data shows a weakening services sector and consumer prices rising again as tariffs pass through. Official CPI data for May 2025 will be released on June 11.
Outlook: Higher inflation could halt the Fed's "dereflexion" course — a dilemma ⚖️ between growth 📈 and price stability. 🛑
Technical View 📐
Regarding the major Head and Shoulders (H&S) reversal pattern on the 4H chart I shared previously, I'd like to explain some new developments that are altering its potential outcome.
Since the price has re-entered and fallen below the neckline, I activated my "second brain cell" 🧠 to guess what could be next. This led me to revise the larger 4-hour chart structure with the adjustments shown in the accompanying image.
As you can also see in the updated version below, a reversed H&S pattern remains a possibility, as the proportions still appear valid. 🔄
Potential Scenarios for Gold 🧩
Under this revised idea, Gold could potentially reach the neckline entry at 3397 (+88) from the current price. This is one plausible scenario. ✅
Alternatively, the price could drop further to the "Head" at 3120 (-191 from the current 3309), which would, of course, invalidate this H&S pattern. ❗
While this is speculative 🔮, given that trading often involves psychological movements and their resulting impacts, I believe this is a favorable approach to forecasting.
Another reason to see it as bullish is the formed standard bull flag 🚩🐂.
Please take the time to let me know what you think about this. 💬
-------------------------------------------------------------------------
This is just my personal market idea and not financial advice! 📢 Trading gold and other financial instruments carries risks – only invest what you can afford to lose. Always do your own analysis, use solid risk management, and trade responsibly.
Good luck and safe trading! 🚀📊

XAUUSD - High possibility of volatile market opening (20250616)Well, it is quite obvious we have a volatile geo-political crisis this weekend, so market may overreact once again to bring Gold to at least 3500 opening.
Looking at volume, though Gold is in uncharted territory and it can be move as high as 3550 - 3600, I rather play for a quick profit.
Hope later this Sunday, we can find some positive news that can at least hold the surge of Gold to minimum.
Trade safe, Trade wisely. Monday will be a very volatile opening.
EUR/USD Daily Chart Analysis For Week of June 13, 2025Technical Analysis and Outlook:
During the current trading session, the Eurodollar has exhibited notable volatility, mirroring patterns observed in the preceding week. The currency has surpassed both the Mean Resistance level of 1.145 and the Key Resistance level of 1.151, subsequently retesting the significant completed Outer Currency Rally level at 1.157.
Recent analyses indicate that the Euro is likely to revisit both the Key Resistance and the completed Outer Currency Rally and expand further to the next Outer Currency Rally of 1.177 in the forthcoming trading session(s). However, there exists a potential for a continuation of the downward trend from the current level, which could lead to the price action targeting the Mean Support level at 1.149 and possibly a further extension to the Mean Support level at 1.140.

Bitcoin(BTC/USD) Daily Chart Analysis For Week of June 13, 2025Technical Analysis and Outlook:
Throughout the past week, Bitcoin has exhibited considerable volatility. After reaching a peak at the first Mean Resistance level of 109500, the cryptocurrency experienced a significant decline. Nevertheless, on Friday, Bitcoin demonstrated a notable recovery, ascending to a newly established resistance now designated as the new Mean Resistance level marked at 110300.
At this juncture, Bitcoin is retracing downward as it retests the initial Mean Support level of 104000 while aiming to target the Mean Support at 101500 and the ultimate Inner Coin Dip at 96500. It is essential to recognize the potential for an upward rally from the Mean Support levels of $ 104,000 and/or $ 101,500, which could culminate in a retest of the Mean Resistance level of $ 110,300.

Gold: silence on the charts—because the real money already movedThe gold market isn't reacting — it's confirming. The Israeli strikes on Iran? That’s the trigger. But the move started earlier. Price was already coiled, already positioned. All the market needed was a headline. And it got it.
Price broke out of the accumulation channel and cleared $3,400 — a key structural level that’s acted as a battleground in past rotations. The move from $3,314 was no fluke — it was a textbook build: sweep the lows, reclaim structure, flip the highs. Volume spiked exactly where it needed to — this wasn’t emotional buying. This was smart money pulling the pin.
Technicals are loaded:
— Holding above $3,396–3,398 (0.618 Fibo + demand re-entry zone)
— All major EMAs (including MA200) are now below price
— RSI strong, no sign of exhaustion
— Candles? Clean control bars — breakout, retest, drive
— Volume profile above price = air pocket — resistance is thin to nonexistent up to $3,450+
Targets:
— $3,447 — prior high
— $3,484 — 1.272 extension
— $3,530 — full 1.618 expansion — key upside target
Fundamentals:
Middle East is boiling. Iran is ready to retaliate. Israel is already escalating. In moments like these, gold isn't just a commodity — it's capital preservation. The dollar is rising — and gold still rallies. That means this isn’t about inflation, or rates. It’s about risk-off. Pure, institutional-level flight to safety.
Tactical view:
The breakout is done. Holding above $3,396 confirms the thesis. Pullbacks to that zone? Reloading points. While gold remains in the channel and momentum is clean, the only side that matters right now — is long.
When price moves before the news — that’s not reaction. That’s preparation. Stay sharp.
