Ger40
DAX sideways consolidation support at 24070The DAX remains in a bullish trend, with recent price action showing signs of a corrective pullback within the broader uptrend.
Support Zone: 24070 – a key level from previous consolidation. Price is currently testing or approaching this level.
A bullish rebound from 24070 would confirm ongoing upside momentum, with potential targets at:
24605 – initial resistance
24740 – psychological and structural level
24910 – extended resistance on the longer-term chart
Bearish Scenario:
A confirmed break and daily close below 24070 would weaken the bullish outlook and suggest deeper downside risk toward:
23935 – minor support
23820 – stronger support and potential demand zone
Outlook:
Bullish bias remains intact while the DAX holds above 23925. A sustained break below this level could shift momentum to the downside in the short term.
This communication is for informational purposes only and should not be viewed as any form of recommendation as to a particular course of action or as investment advice. It is not intended as an offer or solicitation for the purchase or sale of any financial instrument or as an official confirmation of any transaction. Opinions, estimates and assumptions expressed herein are made as of the date of this communication and are subject to change without notice. This communication has been prepared based upon information, including market prices, data and other information, believed to be reliable; however, Trade Nation does not warrant its completeness or accuracy. All market prices and market data contained in or attached to this communication are indicative and subject to change without notice.
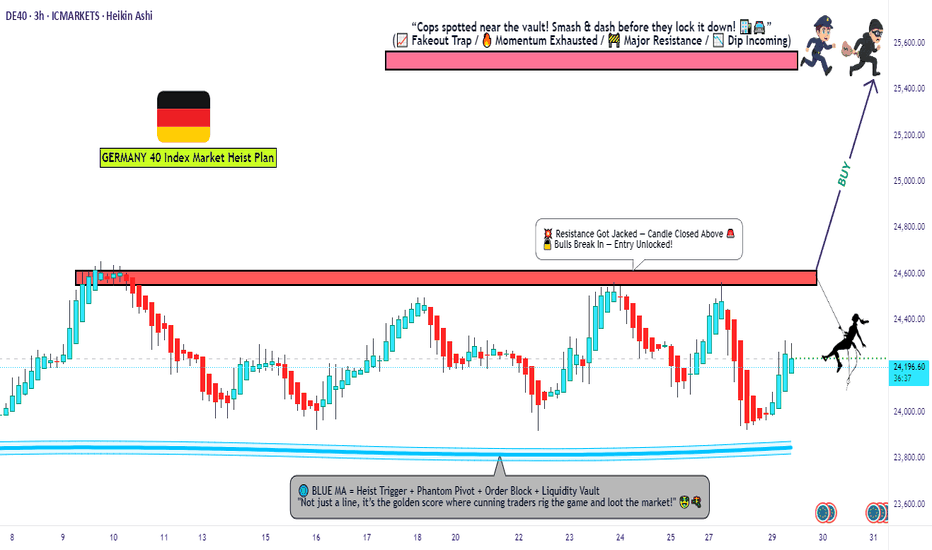
DE40 Breakout Robbery – Bullish Setup Revealed!💣 DE40 / GER40 INDEX BREAKOUT RAID 🚨
🌟 Hi! Hola! Ola! Bonjour! Hallo! Marhaba! 🌟
Dear Market Robbers, Money Makers, and Chart Bandits 🕶️💰💣,
We’re rollin' out our latest Thief Trader Heist Plan based on laser-sharp technical + fundamental recon 🧠💼 on the Germany DE40 / GER40 Index. It’s time to gear up and break the resistance vault 🏦💥
🎯 THE MASTER HEIST SETUP: LONG ONLY 🎯
📈 Entry Setup:
"The heist is on! Wait for breakout & retest near 24600 🔓.
Once confirmed, GO BULLISH and snatch that market loot!"
✅ Use Buy Stop above resistance
✅ (OR) Buy Limit from pullback zones using 15m–30m swing lows/highs
🎯 DCA / Layered limit entries for optimal robbery!
🔔 Set Alerts: Don't sleep on this! Mark your alarms to catch the breakout.
🛑 STOP LOSS: PLAY IT SMART, NOT EMOTIONAL
🗣️ "Don’t drop your SL before the breakout—wait for the confirmation candle. Place it smart based on your entry lot size & risk."
📍Thief SL Plan: Below the recent 4H wick swing low – around 21700
🔒 Protect the loot once you're in the trade!
🏁 TARGET: TIME TO ESCAPE THE SCENE
🎯 Primary Profit Vault: 25500
🛫 Escape earlier if signs of resistance emerge. A clean get-away is the goal!
🔪 SCALPERS MODE: ONLY LONG SIDE
💰 Got the funds? Feel free to enter early.
💼 Otherwise, team up with swing traders. Use Trailing SL to guard your treasure.
🔎 FUNDAMENTALS BACKING THIS HEIST
📊 GER40 shows bullish momentum backed by:
Global macro optimism
Strong Eurozone data
Risk-on flows into European indices
Technical chart breakout formations
📰 Get full market breakdowns (COT, Macro, Intermarket, Sentiment, etc.) – Check your trusted sources and confirm your targets.
🚨 TRADING ALERT: STAY ALERT DURING NEWS
⚠️ Big news = high volatility! Follow the robbery code:
Avoid new trades during major news drops
Trail SLs on running positions
Stay glued to live updates!
❤️ SUPPORT THE THIEF CREW
If this plan helped you, hit that BOOST 🚀
Let’s keep raiding the charts, stacking profits like pros 🏆
Join the Thief Crew, where we rob the market... not dreams.
🎭 Until the next plan… stay sneaky, stay profitable. 🐱👤💸💥
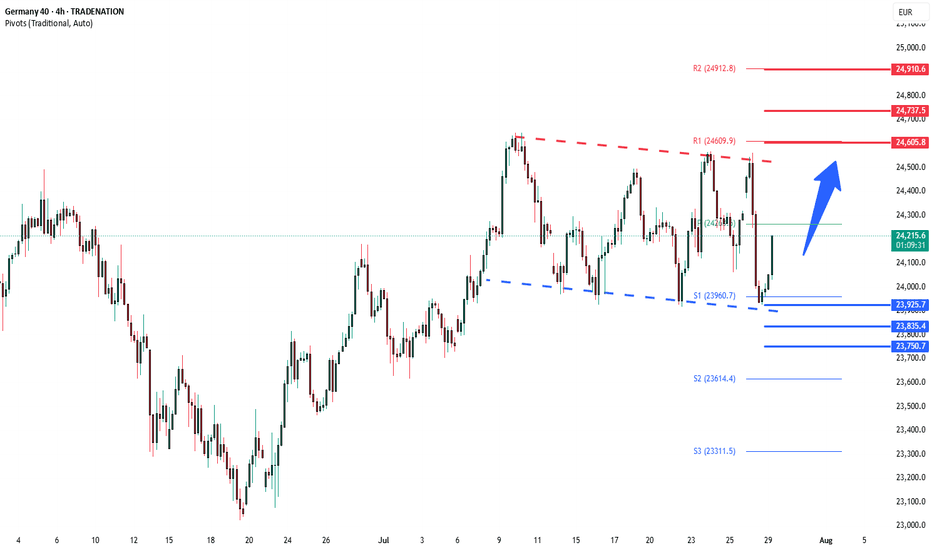
DAX oversold rally support at 23925The DAX remains in a bullish trend, with recent price action showing signs of a corrective pullback within the broader uptrend.
Support Zone: 23925 – a key level from previous consolidation. Price is currently testing or approaching this level.
A bullish rebound from 23925 would confirm ongoing upside momentum, with potential targets at:
24605 – initial resistance
24740 – psychological and structural level
24910 – extended resistance on the longer-term chart
Bearish Scenario:
A confirmed break and daily close below 23925 would weaken the bullish outlook and suggest deeper downside risk toward:
23835 – minor support
23750 – stronger support and potential demand zone
Outlook:
Bullish bias remains intact while the DAX holds above 23925. A sustained break below this level could shift momentum to the downside in the short term.
This communication is for informational purposes only and should not be viewed as any form of recommendation as to a particular course of action or as investment advice. It is not intended as an offer or solicitation for the purchase or sale of any financial instrument or as an official confirmation of any transaction. Opinions, estimates and assumptions expressed herein are made as of the date of this communication and are subject to change without notice. This communication has been prepared based upon information, including market prices, data and other information, believed to be reliable; however, Trade Nation does not warrant its completeness or accuracy. All market prices and market data contained in or attached to this communication are indicative and subject to change without notice.
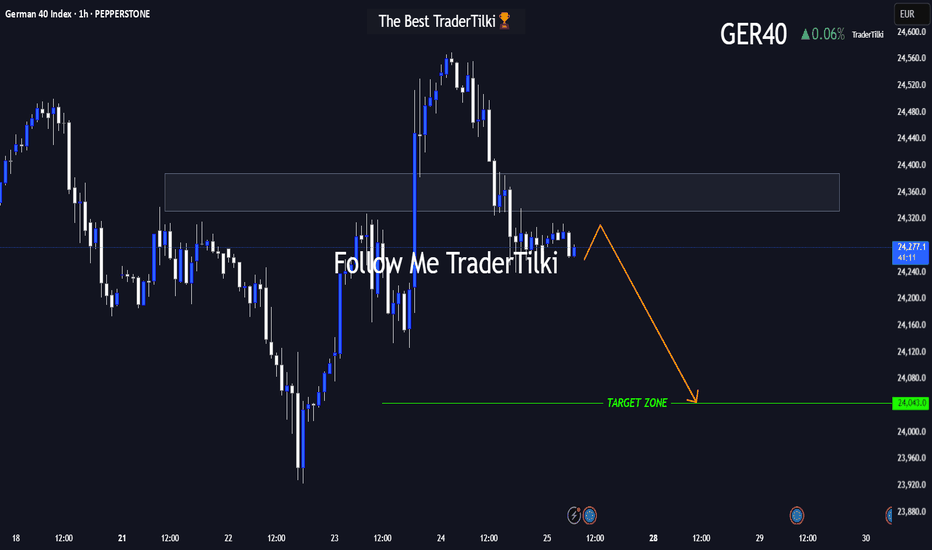
GER40 in Motion: This Setup Speaks Volumes 🌅 Good morning, my friends,
I’ve put together a fresh GER40 analysis just for you. Even if the 1-hour timeframe shows some upward momentum, I fully expect the price to reach my target level of **24,050**.
I'm holding firm until that level is hit.
Every single like from you is a massive source of motivation for me to keep sharing analysis. Huge thanks to everyone supporting with a tap!
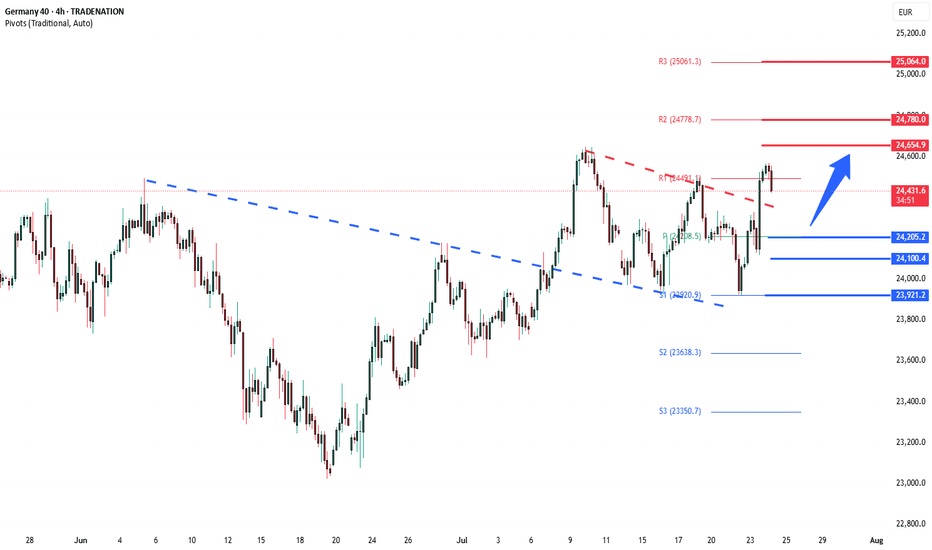
DAX40 Bullish breakout retest support at 24205The DAX remains in a bullish trend, with recent price action showing signs of a corrective pullback within the broader uptrend.
Support Zone: 24205 – a key level from previous consolidation. Price is currently testing or approaching this level.
A bullish rebound from 24205 would confirm ongoing upside momentum, with potential targets at:
24655 – initial resistance
24780 – psychological and structural level
25064 – extended resistance on the longer-term chart
Bearish Scenario:
A confirmed break and daily close below 24205 would weaken the bullish outlook and suggest deeper downside risk toward:
24100 – minor support
23921 – stronger support and potential demand zone
Outlook:
Bullish bias remains intact while the DAX40 holds above 24205. A sustained break below this level could shift momentum to the downside in the short term.
This communication is for informational purposes only and should not be viewed as any form of recommendation as to a particular course of action or as investment advice. It is not intended as an offer or solicitation for the purchase or sale of any financial instrument or as an official confirmation of any transaction. Opinions, estimates and assumptions expressed herein are made as of the date of this communication and are subject to change without notice. This communication has been prepared based upon information, including market prices, data and other information, believed to be reliable; however, Trade Nation does not warrant its completeness or accuracy. All market prices and market data contained in or attached to this communication are indicative and subject to change without notice.
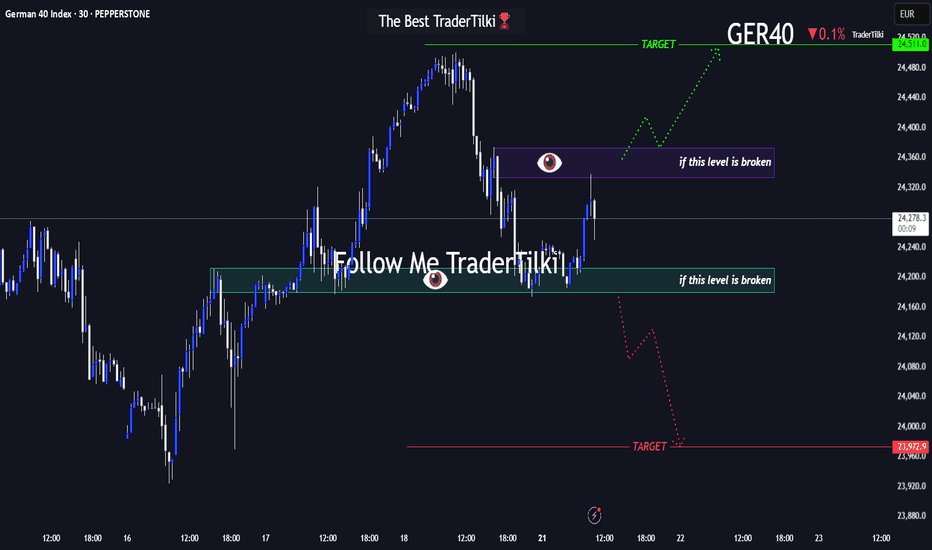
Before GER40 Roars, It WhispersHey guys👋
Here’s the latest GER40 analysis I’ve prepared for you:
🔻 If the **24,179** support level breaks, the next target is **23,972**.
🔺 If the **24,373** resistance level breaks, the next target is **24,511**.
🎯 I’ve shared two key levels with you — please monitor them carefully.
Every like from you gives me a big boost of motivation 🙏
Thanks to everyone who supports my work — truly appreciate it 💙
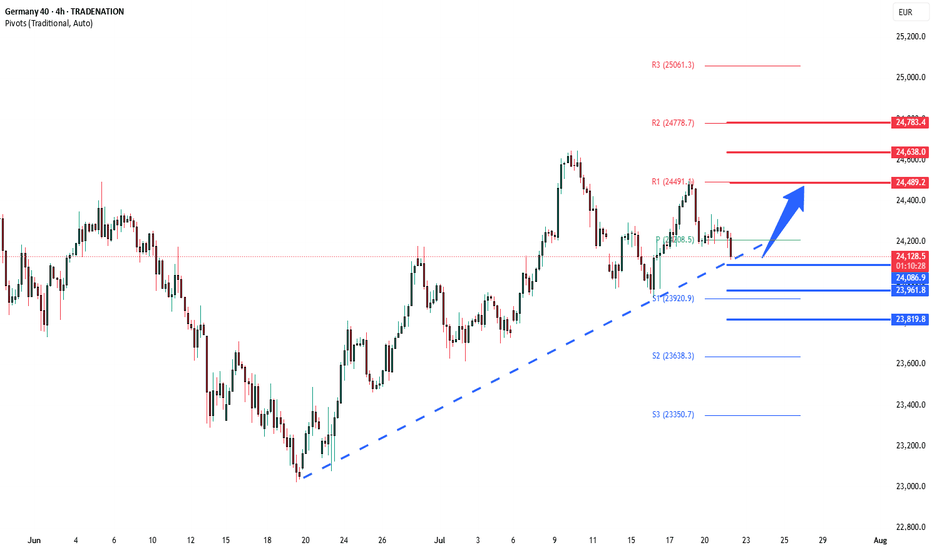
DAX40 Support retest at 24085The DAX remains in a bullish trend, with recent price action showing signs of a resistance breakout within the broader uptrend.
Support Zone: 24085 – a key level from previous consolidation. Price is currently testing or approaching this level.
A bullish rebound from 24085 would confirm ongoing upside momentum, with potential targets at:
24490 – initial resistance
24640 – psychological and structural level
24780 – extended resistance on the longer-term chart
Bearish Scenario:
A confirmed break and daily close below 24085 would weaken the bullish outlook and suggest deeper downside risk toward:
23970 – minor support
23800 – stronger support and potential demand zone
Outlook:
Bullish bias remains intact while the DAX holds above 24085. A sustained break below this level could shift momentum to the downside in the short term.
This communication is for informational purposes only and should not be viewed as any form of recommendation as to a particular course of action or as investment advice. It is not intended as an offer or solicitation for the purchase or sale of any financial instrument or as an official confirmation of any transaction. Opinions, estimates and assumptions expressed herein are made as of the date of this communication and are subject to change without notice. This communication has been prepared based upon information, including market prices, data and other information, believed to be reliable; however, Trade Nation does not warrant its completeness or accuracy. All market prices and market data contained in or attached to this communication are indicative and subject to change without notice.
DAX corrective pullback supported at 24085The DAX remains in a bullish trend, with recent price action showing signs of a resistance breakout within the broader uptrend.
Support Zone: 24085 – a key level from previous consolidation. Price is currently testing or approaching this level.
A bullish rebound from 24085 would confirm ongoing upside momentum, with potential targets at:
24650 – initial resistance
24880 – psychological and structural level
25000 – extended resistance on the longer-term chart
Bearish Scenario:
A confirmed break and daily close below 24085 would weaken the bullish outlook and suggest deeper downside risk toward:
23970 – minor support
23800 – stronger support and potential demand zone
Outlook:
Bullish bias remains intact while the DAX holds above 24085. A sustained break below this level could shift momentum to the downside in the short term.
This communication is for informational purposes only and should not be viewed as any form of recommendation as to a particular course of action or as investment advice. It is not intended as an offer or solicitation for the purchase or sale of any financial instrument or as an official confirmation of any transaction. Opinions, estimates and assumptions expressed herein are made as of the date of this communication and are subject to change without notice. This communication has been prepared based upon information, including market prices, data and other information, believed to be reliable; however, Trade Nation does not warrant its completeness or accuracy. All market prices and market data contained in or attached to this communication are indicative and subject to change without notice.
Bullish rise?GER40 has reacted off the support level which lines up with the 50% Fibonacci retracement and could potentially rise from this level to our take profit.
Entry: 24,135.27
Why we like it:
There is a pullback support that lines up with the 50% Fibonacci retracement.
Stop loss: 23,928.93
Why we like it:
There is a pullback support that aligns with the 71% Fibonacci retracement.
Take profit: 24,624.49
Why we like it:
There is a pullback resistance.
Enjoying your TradingView experience? Review us!
Please be advised that the information presented on TradingView is provided to Vantage (‘Vantage Global Limited’, ‘we’) by a third-party provider (‘Everest Fortune Group’). Please be reminded that you are solely responsible for the trading decisions on your account. There is a very high degree of risk involved in trading. Any information and/or content is intended entirely for research, educational and informational purposes only and does not constitute investment or consultation advice or investment strategy. The information is not tailored to the investment needs of any specific person and therefore does not involve a consideration of any of the investment objectives, financial situation or needs of any viewer that may receive it. Kindly also note that past performance is not a reliable indicator of future results. Actual results may differ materially from those anticipated in forward-looking or past performance statements. We assume no liability as to the accuracy or completeness of any of the information and/or content provided herein and the Company cannot be held responsible for any omission, mistake nor for any loss or damage including without limitation to any loss of profit which may arise from reliance on any information supplied by Everest Fortune Group.
"Planning the Perfect DE40 Robbery? Here’s the Setup!"💥🔥Thief Trading Style: The Ultimate Market Heist Plan for DE40/Germany40🔥💥
"Steal the Trend, Escape the Trap, and Vanish with Profits!"
🌍🌟**Hola, Hallo, Marhaba, Bonjour, Ola, and Hey Traders!**🌟
Welcome to the Thief Trading Vault – where we don’t just trade, we plan market heists with precision and escape like professionals!
To all my fellow Profit Pirates, Smart Robbers, and Money Hunters – this one's for you. 🤑💸💼
🔐💹DE40/Germany40 Master Robbery Plan – Swing Trade Setup
Strategy Type: Swing & Scalp Friendly
Market Direction: Neutral ➜ Bullish Bias
Approach: DCA + Tactical Entry Zones + News-Conscious Trading
📍ENTRY (The Vault Is Open!)
Break in like a pro! We are eyeing a long entry setup.
Wait for price to dip near key pullback zones (within recent 15m or 30m swing highs/lows). Use buy limit orders to scale in.
🛠 Thieves love layering: DCA style entry strategy ensures lower average cost.
💡“Swipe smart, enter silently.”
📍STOP LOSS (Secure Your Exit!)
Our risk control is set at recent 4H swing low – around 23950.00.
However, your SL can vary based on risk profile, lot size, and number of entries.
Protect the stash! 💼🔒
📍TARGET (Getaway Point!)
🎯 Target: 24570.00 or exit early if resistance becomes tight.
We’re approaching a “Red Zone” – a high-risk area loaded with fake-outs, bear traps, and profit-takers.
🔁Scalpers' Goldmine Tips
Only scalp LONG SIDE ONLY.
Big accounts? Jump in anytime.
Small accounts? Tag along with swing setups.
Always use a trailing SL to secure gains and avoid traps.
🧠Technical + Fundamental Blend
This setup isn’t just chart-based.
We analyze:
🔍 Fundamentals & Macro Trends
🧾 COT Reports & Sentiment
🌐 Geopolitical Events
📊 Intermarket & Index-Specific Data
🧭 Trader Positioning & Future Price Bias
📎 Full outlook & premium research available – Klickk the Lnk🔗🧠
📢IMPORTANT REMINDERS:
⚠️ Major news releases = High risk.
Avoid fresh entries during those hours.
Use trailing SLs to lock profits during volatile sessions.
🚀Support The Thieves – Hit Boost!
Smash that 💥Boost Button💥 if this plan helped you plan your next profit heist.
More boosts = More strategies unlocked.
Join our elite robbers’ squad and conquer the market daily with the Thief Trading Style! 🏆💰❤️
📌DISCLAIMER:
This is a general swing trade strategy and not financial advice.
Always evaluate your own risk level and market understanding before entering trades.
Markets shift fast – adapt, stay sharp, and never trade blindly. 🎯
📅 Stay tuned – more robbery plans, more precision trades, and more fun ahead!
Follow & Boost if you want in on the next mission!
🕶️🐱👤 See you at the getaway spot!
Next week on GER40 The reason is that I am waiting for the price to reach the 50% PW level and form a 1-hour SMT + 5-minute CISD, then I will look for a buy opportunity. It is also possible that the market will consolidate above the HTF CISD, and after that, we will continue searching for a buy opportunity. Anyway, we will see what the market is doing INSHALLAH.
“GER30 Bull Vault Heist: The Ultimate Loot Plan”💎“The Bull Vault Job: GER30 Heist Blueprint”💎
🌟Hi! Hola! Ola! Bonjour! Hallo! Marhaba!🌟
Welcome fellow Chart Raiders & Market Hackers 🧠💰—your next mission is here.
We’re pulling off a precision breakout plan on GER30 / DE30 "Germany30" — a market vault bursting with bullish loot. This isn’t just trading... this is Thief Trading Style™ — where smart analysis meets slick execution. 👨💻💎📊
💼 The Heist Plan:
📈 Entry: Market shows a wide open vault. Ideal long setups near the last swing low (15–30m for sniper entries). Don’t chase—wait for the retrace.
🛑 Stop Loss: Guard your getaway! Use recent swing lows on 4H (e.g. 24170). Customize based on your risk profile & lot sizes.
🎯 Target: Aim for 24720 or EXIT before the cops (a.k.a. reversal zones) show up. Always secure your gains.
📌 Scalpers’ Signal: Stay LONG-only. Follow swing traders if low on ammo (capital). Use trailing SLs like tripwires to protect your profits.
📊 Market Heat Check: The DE30 is radiating bullish pressure 💥—fueled by fundamentals, macro trends, COT positions, sentiment indicators, and intermarket clues. We read between the lines. You just follow the blueprint. 🧠
🚨 Pro Tips:
Avoid entering trades during high-impact news.
Manage risk like a vault door—solid, tested, and ready.
💖 Smash that Boost Button 💖 if you believe in the Art of Legal Market Extraction™ — it supports the plan, strengthens the crew, and keeps this hustle alive!
🎭 More blueprints & breakdowns coming soon. Stay locked in...
Until the next market hit, trade sharp, trade smart. 🐱👤📈💰
DAX pause at the ATH The DAX remains in a bullish trend, with recent price action showing signs of a resistance breakout within the broader uptrend.
Support Zone: 24335 – a key level from previous consolidation. Price is currently testing or approaching this level.
A bullish rebound from 24335 would confirm ongoing upside momentum, with potential targets at:
24800 – initial resistance
24900 – psychological and structural level
25000 – extended resistance on the longer-term chart
Bearish Scenario:
A confirmed break and daily close below 24335 would weaken the bullish outlook and suggest deeper downside risk toward:
24175 – minor support
24090 – stronger support and potential demand zone
Outlook:
Bullish bias remains intact while the DAX holds above 24335. A sustained break below this level could shift momentum to the downside in the short term.
This communication is for informational purposes only and should not be viewed as any form of recommendation as to a particular course of action or as investment advice. It is not intended as an offer or solicitation for the purchase or sale of any financial instrument or as an official confirmation of any transaction. Opinions, estimates and assumptions expressed herein are made as of the date of this communication and are subject to change without notice. This communication has been prepared based upon information, including market prices, data and other information, believed to be reliable; however, Trade Nation does not warrant its completeness or accuracy. All market prices and market data contained in or attached to this communication are indicative and subject to change without notice.
Is the Trend Intact? Key Signal Emerging on GER40 4H ChartHey Guys,
We could see a pullback on the GER40 index from the 24,060 level. If that happens, the 23,824 – 23,675 zone could present a potential buying opportunity. The primary trend still points upward, and bullish momentum remains intact.
Also worth noting—the rise in volume is quite striking, which supports my target level of 24,500.
I meticulously prepare these analyses for you, and I sincerely appreciate your support through likes. Every like from you is my biggest motivation to continue sharing my analyses.
I’m truly grateful for each of you—love to all my followers💙💙💙
DAX40 uptrend continuation support at 23850The DAX40 remains in a bullish trend, with recent price action showing signs of a corrective pullback within the broader uptrend.
Support Zone: 23850 – a key level from previous consolidation. Price is currently testing or approaching this level.
A bullish rebound from 22850 would confirm ongoing upside momentum, with potential targets at:
24410 – initial resistance
24500 – psychological and structural level
24650 – extended resistance on the longer-term chart
Bearish Scenario:
A confirmed break and daily close below 23850 would weaken the bullish outlook and suggest deeper downside risk toward:
23700 – minor support
23520 – stronger support and potential demand zone
Outlook:
Bullish bias remains intact while the DAX40 holds above 23850. A sustained break below this level could shift momentum to the downside in the short term.
This communication is for informational purposes only and should not be viewed as any form of recommendation as to a particular course of action or as investment advice. It is not intended as an offer or solicitation for the purchase or sale of any financial instrument or as an official confirmation of any transaction. Opinions, estimates and assumptions expressed herein are made as of the date of this communication and are subject to change without notice. This communication has been prepared based upon information, including market prices, data and other information, believed to be reliable; however, Trade Nation does not warrant its completeness or accuracy. All market prices and market data contained in or attached to this communication are indicative and subject to change without notice.
DAX40 Bullish consolidation breakout Trend Overview:
The DAX index maintains a bullish overall sentiment, supported by a sustained rising trend on the higher timeframes. However, recent intraday price action suggests a corrective pullback and consolidation phase, likely part of a broader continuation pattern.
Key Support and Resistance Levels:
Support:
Initial support: 23,330 – a key previous consolidation area and pivot level
Below that: 23,170, then 22,970 as deeper retracement levels
Resistance:
Near-term upside target: 24,030
Further resistance: 24,130 and 24,345 over the longer term
Scenarios:
Bullish Continuation:
A bounce from 23,330 would confirm this level as valid support
Sustained strength could drive price toward 24,030, then 24,130 and 24,345
Bearish Breakdown:
A daily close below 23,330 would invalidate the bullish setup
Opens potential for deeper pullbacks toward 23,170 and 22,970
Conclusion:
The DAX remains bullish in structure but is currently consolidating. Watch the 23,330 support zone closely—its ability to hold will determine whether bulls regain control or if a deeper correction unfolds. A bounce here would favor upside targets; a confirmed breakdown shifts the outlook to short-term bearish.
This communication is for informational purposes only and should not be viewed as any form of recommendation as to a particular course of action or as investment advice. It is not intended as an offer or solicitation for the purchase or sale of any financial instrument or as an official confirmation of any transaction. Opinions, estimates and assumptions expressed herein are made as of the date of this communication and are subject to change without notice. This communication has been prepared based upon information, including market prices, data and other information, believed to be reliable; however, Trade Nation does not warrant its completeness or accuracy. All market prices and market data contained in or attached to this communication are indicative and subject to change without notice.
DAX bullish breakout resistance at 24030Trend Overview:
The DAX index maintains a bullish overall sentiment, supported by a sustained rising trend on the higher timeframes. However, recent intraday price action suggests a corrective pullback and consolidation phase, likely part of a broader continuation pattern.
Key Support and Resistance Levels:
Support:
Initial support: 23,330 – a key previous consolidation area and pivot level
Below that: 23,170, then 22,970 as deeper retracement levels
Resistance:
Near-term upside target: 24,030
Further resistance: 24,130 and 24,345 over the longer term
Scenarios:
Bullish Continuation:
A bounce from 23,330 would confirm this level as valid support
Sustained strength could drive price toward 24,030, then 24,130 and 24,345
Bearish Breakdown:
A daily close below 23,330 would invalidate the bullish setup
Opens potential for deeper pullbacks toward 23,170 and 22,970
Conclusion:
The DAX remains bullish in structure but is currently consolidating. Watch the 23,330 support zone closely—its ability to hold will determine whether bulls regain control or if a deeper correction unfolds. A bounce here would favor upside targets; a confirmed breakdown shifts the outlook to short-term bearish.
This communication is for informational purposes only and should not be viewed as any form of recommendation as to a particular course of action or as investment advice. It is not intended as an offer or solicitation for the purchase or sale of any financial instrument or as an official confirmation of any transaction. Opinions, estimates and assumptions expressed herein are made as of the date of this communication and are subject to change without notice. This communication has been prepared based upon information, including market prices, data and other information, believed to be reliable; however, Trade Nation does not warrant its completeness or accuracy. All market prices and market data contained in or attached to this communication are indicative and subject to change without notice.
DAX Inverse Head and Shoulders target 24600!DAX (DE40) is about to complete an Inverse Head and Shoulders (IH&S) pattern, with the price currently stuck in range within the 4H MA50 (blue trend-line) and the 4H MA200 (orange trend-line).
A 4H candle closing above the 4H MA200, confirms the IH&S pattern and the bullish break-out technically targets the 2.0 Fibonacci extension, currently a little above 24600. On top of that, the break-out may be accompanied by a 1D MAD Bullish Cross, further confirmation of the bullish sentiment.
-------------------------------------------------------------------------------
** Please LIKE 👍, FOLLOW ✅, SHARE 🙌 and COMMENT ✍ if you enjoy this idea! Also share your ideas and charts in the comments section below! This is best way to keep it relevant, support us, keep the content here free and allow the idea to reach as many people as possible. **
-------------------------------------------------------------------------------
Disclosure: I am part of Trade Nation's Influencer program and receive a monthly fee for using their TradingView charts in my analysis.
💸💸💸💸💸💸
👇 👇 👇 👇 👇 👇
DAX Bullish breakout supported at 23330Trend Overview:
The DAX index maintains a bullish overall sentiment, supported by a sustained rising trend on the higher timeframes. However, recent intraday price action suggests a corrective pullback and consolidation phase, likely part of a broader continuation pattern.
Key Support and Resistance Levels:
Support:
Initial support: 23,330 – a key previous consolidation area and pivot level
Below that: 23,170, then 22,970 as deeper retracement levels
Resistance:
Near-term upside target: 24,030
Further resistance: 24,130 and 24,345 over the longer term
Scenarios:
Bullish Continuation:
A bounce from 23,330 would confirm this level as valid support
Sustained strength could drive price toward 24,030, then 24,130 and 24,345
Bearish Breakdown:
A daily close below 23,330 would invalidate the bullish setup
Opens potential for deeper pullbacks toward 23,170 and 22,970
Conclusion:
The DAX remains bullish in structure but is currently consolidating. Watch the 23,330 support zone closely—its ability to hold will determine whether bulls regain control or if a deeper correction unfolds. A bounce here would favor upside targets; a confirmed breakdown shifts the outlook to short-term bearish.
This communication is for informational purposes only and should not be viewed as any form of recommendation as to a particular course of action or as investment advice. It is not intended as an offer or solicitation for the purchase or sale of any financial instrument or as an official confirmation of any transaction. Opinions, estimates and assumptions expressed herein are made as of the date of this communication and are subject to change without notice. This communication has been prepared based upon information, including market prices, data and other information, believed to be reliable; however, Trade Nation does not warrant its completeness or accuracy. All market prices and market data contained in or attached to this communication are indicative and subject to change without notice.
“GER40 Heist in Progress – Bearish Blueprint Deployed!”🦹♂️💼 “Operation: Black Forest Heist” – DAX Day/Swing Trade Plan 💼🦹♀️
📍Thief Trading Style | CFD Tactical Chart Blueprint | GER40 Recon Mission
🌟Hi! Hola! Ola! Bonjour! Hallo! Marhaba!🌟
Dear Money Movers, Risk Raiders & Precision Planners 🧠💸,
Suit up for a clean-cut operation on the Germany 40 (GER40) Index! 🎯
With our sharp-edged Thief Trading blueprint 🔪, we’re scanning for a potential bearish trap—market’s heating up with oversold setups and momentum cracks near key resistance. Watch for the green MA zone—we suspect it's where bullish imposters hide. 🕵️♂️📉
🔓 Entry Plan
“The vault’s cracking... get ready!”
Wait for price to breach the ATR Line (23000.0). Once the level is crossed cleanly, it’s go-time:
🧨 Use Sell Stop orders just under the breakout
🎣 Or hunt pullback setups on 15m/30m charts with Sell Limit entries at resistance
🔐 Stop-Loss Strategy
Keep it tight. Protect your loot.
🚧 Place SL around swing high/low on the 4H chart (e.g. 23400.0)
⚖️ Adapt SL based on lot size, risk appetite, and number of entries
🎯 Target Zone
Mission Objective: 22600.0
Or exit earlier if the security alarm (price action shift) starts ringing. Don't get greedy—get out smart. 💼🚪💨
📉 Market Outlook:
Current trend: Neutral but suspiciously wobbly – early signs of bearish dominance. 🐻
This trade aligns with multiple signals:
📊 Technical: Consolidation near highs
💼 Fundamental: Macro & news risks
🧠 Sentiment: Crowd leaning long = opportunity for reversal
📰 Caution Note – News Events = Laser Tripwires
Stay sharp during releases!
Avoid new setups when big headlines drop
Use trailing stops to secure gains on running trades
Position smart, manage tighter, act quicker 🕶️
💥 Smash that Boost Button if this plan sharpens your edge or adds value to your mission! 💥
Together, we move like shadows and strike like lightning—Thief Traders never miss a clean setup.⚔️🕵️♀️
Stay tuned for the next raid… the market’s full of opportunities waiting to be unlocked. 🗝️🚀
DAX40 INTRADAY Bullish breakout support at 23330Trend Overview:
The DAX index maintains a bullish overall sentiment, supported by a sustained rising trend on the higher timeframes. However, recent intraday price action suggests a corrective pullback and consolidation phase, likely part of a broader continuation pattern.
Key Support and Resistance Levels:
Support:
Initial support: 23,330 – a key previous consolidation area and pivot level
Below that: 23,170, then 22,970 as deeper retracement levels
Resistance:
Near-term upside target: 24,030
Further resistance: 24,130 and 24,345 over the longer term
Scenarios:
Bullish Continuation:
A bounce from 23,330 would confirm this level as valid support
Sustained strength could drive price toward 24,030, then 24,130 and 24,345
Bearish Breakdown:
A daily close below 23,330 would invalidate the bullish setup
Opens potential for deeper pullbacks toward 23,170 and 22,970
Conclusion:
The DAX remains bullish in structure but is currently consolidating. Watch the 23,330 support zone closely—its ability to hold will determine whether bulls regain control or if a deeper correction unfolds. A bounce here would favor upside targets; a confirmed breakdown shifts the outlook to short-term bearish.
This communication is for informational purposes only and should not be viewed as any form of recommendation as to a particular course of action or as investment advice. It is not intended as an offer or solicitation for the purchase or sale of any financial instrument or as an official confirmation of any transaction. Opinions, estimates and assumptions expressed herein are made as of the date of this communication and are subject to change without notice. This communication has been prepared based upon information, including market prices, data and other information, believed to be reliable; however, Trade Nation does not warrant its completeness or accuracy. All market prices and market data contained in or attached to this communication are indicative and subject to change without notice.


