DAX Volatility Analysis 21-25 Nov 2022 DAX Volatility Analysis 21-25 Nov 2022
We can see that currently the implied volatility for this week is around 3.08%, raising from 3.07% of last week , according to VDAX data
(DAX Volatility Index)
With this in mind, currently from ATR point of view we are located in the 1th percentile, while according to VDAX, we are on 4th percentile.
Based on this, we can expect that the current weekly candles ( from open to close ) are going to between:
Bullish: 2.05% movement
Bearish: 2.38% movement
At the same time, with this data, we can make a top/bot channel which is going to contain inside the movement of this asset,
meaning that there is a 21.1% that our close of the weekly candle of this asset is going to be either above/below the next channel:
TOP: 14837
BOT: 13953
Taking into consideration the previous weekly high/low, currently for this candle there is :
27% probability we are going to touch previous low of 14150
73% probability we are going to touch previous high of 14450
Lastly, from the technical analysis point of view, currently 67% of the weekly moving averages are in a bullish trend, and
a combination of moving averages and oscillators are in 37% bullish stance
Germany

German stock index. Europe.According ewt expanding triangle via $DEU40 should plunge lower than lows of 1932 and 1945
in next 70 years.

DAX 1hour : 2 scenario possible , we have open gap in downfor buy wait for 14270 area and buy on gap and hold it 3-4 day
if you have old sell, you must close all or hedge them in gap
upper target is 14555 then 14800
keep monitor AC indicator on 4hourchart, it is full green now ,if high not break it has sell signal
strongly advice 90% looking for buy in deep above 14000
good luck

dax40 sellmarket direction ;downtrend htf
inside supply zone dax started to go from uptrend to distribution phase on ltf
price creating new lows
enter at lower high

The DAX could retrace further from its ‘bull market’ thresholdThe DAX entered a technical bull market on Tuesday by closing just over 20% higher from its September low. I have lost count the amount of times I have seen a market pull back from the 20% threshold (which is based on no logic that I can see, other than being a nice round number) – so that is just the first clue that the DAX could pull back further.
But we also saw two Doji candles leading into the high, prices were rising on lower volume, and a bearish divergence has formed on the stochastic oscillator. Therefore, the bias is for a retracement towards the 14,000 area whilst prices remains beneath 14,440. At which point we can re-evaluate its potential for a move up to the 14,709 high. A break above this week’s high assumes bullish continuation.

DAX: Push itIt's not a struggle for the German index! The DAX index used all its willpower to find its way up and pushed all the way to climb above the resistance at 13 970 points. We're currently observing an upwards slope that should steadily move into the pink zone between 14 346 - 14 687 points. As soon as the blue wave completes its movement, the trend should turn into a downwards slope heading to the resistance at 13 970 points. If the DAX can't keep its upwards trend going, there's a 35% chance for the trend to cross the support at 13 036 and drop below 11 829 points into the green zone. We'll keep you posted on whether the DAX can keep up with its hard work or if it slams on the brakes.

DAX Big MA200 hit but needs +14000 to avoid new selloffBig bullish news for DAX yesterday as it hit the 1D MA200 for the first time since February 2nd. Even though it has also broken above the Lower High Resistance of the Bear Market since October 27th, there is one pattern remaining which if repeated, can cause a new selloff.
That is the April Cup pattern which after it failed to break its Resistance, it caused a massive selloff. The level for DAX to beat in order to cancel this is 14000, which just so happens to be near the 0.5 Fibonacci retracement level. Otherwise we can visit the September low again where the 1W MA500 will be waiting. The weekly RSI can offer a fair estimate of what could happen next, bullish above its Higher Highs Resistance and bearish below it.
## If you like our free content follow our profile to get more daily ideas. ##
## Comments and likes are greatly appreciated. ##
## Also DONATIONS through TradingView coins help our cause of increasing the daily ideas put here for free and reach out more traders like you. ##

InvestMate|DAX Time to fall🇩🇪 DAX Time to fall
🇩🇪 Looking at the last few weeks on the dax, we see quite a bit of unwinding after new lows.
🇩🇪 The dax has already rallied more than 15.40% from its lows
🇩🇪 In my last post where I perfectly predicted the correction that took place last week.
🇩🇪 It was followed by a breakout to new highs but I believe that the correction potential has not yet been fully exhausted.
🇩🇪 It is unusual in a serious long-term downtrend for the price to just keep going higher and higher from a new low.
🇩🇪 Sooner or later a correction comes.
🇩🇪 Is the 13600 level the ideal time for a correction?
🇩🇪 Definitely highly likely in my opinion.
🇩🇪 My assumption is confirmed by the fact that we are in a place where the price has already reversed direction once in the past and that it is one of the more important fibo levels 0.382 of the whole downward wave.
🇩🇪 The correction targets will be 2 levels, one more likely and the other a little less likely
These are the levels 0.382 and 0.5 of the current upward impulse. These are places where the price has found support many times in the past
🇩🇪This is a long-term scenario, I do not even exclude breaking out even higher before the decline.
🚀If you appreciate my work and effort put into this post I encourage you to leave a like and give a follow on my profile.🚀

DAX: Bull flag breakout, or has the high been seen?The DAX is set to open lower, but there are two potential scenarios to monitor; a bullish breakout from a bull flag – or the swing high has already been seen around trend resistance.
The DAX has rallied from the September low in three waves, which could either be part of a new bullish trend or part of a 3-wave retracement. If we look at price action alone, the rally from 12,000 has been strong and a potential bull-flag is forming. Should we see prices break above 13,000 then we’ll assume the bullish trend is set to continue.
But there are two potential flies in the ointment which could scupper such a break higher. The rally has been seen on declining volumes, which suggests the ‘rally’ is corrective and not impulsive. Furthermore, the bull flag remains stuck beneath trend resistance. And given we recently saw a -bar reversal on the four-hour chart within the supposed bull flag, we are on guard for a break beneath yesterday’s low to assume bearish continuation.

DAX Weekly Volatility Forecast 31/10 - 04/11 2022 DAX Weekly Volatility Forecast 31/10 - 04/11 2022
Currently the volatility for this week is around 3.82% , up from expected 2.7% last week.
According to ATR calculation, currently the volatility is located around 50th percentile.
Under this circumstances the expected movement of the candle is :
BEAR : 2.49% from the opening point of the weekly candle
BULL : 1.84% from the opening point of the weekly candle
At the same time, currently there is 20.2% that the movement within this weekly candle is going to
break and close either above or below the next channel:
TOP: 13617
BOT: 12891
Lastly, taking into account the previous weekly high and low there is a :
75% chance that we are going to touch the previous week high
25% chance that we are going to touch the previous week low

Inflation Rate of the G20 countriesThe G20 is made up of the world's 19 largest economies, represented by the finance ministers and heads of central banks, plus the European Union, represented by the European Central Bank and the rotating presidency of the European Council.
This graph shows the inflation of these countries month over month (MoM).
Source:
tradingeconomics.com

InvestMate|DAX Prepare to rally higher🇩🇪 DAX Prepare to rally higher
🇩🇪 Referring to my last post on dax 👇👇👇
🇩🇪 We are in a very interesting place where an upside breakout formation could take place.
🇩🇪After making a correction yesterday. At the opening of the session today, the dax index showed strength and a desire to continue the uptrend.
🇩🇪 If today's breakout occurs, the way is open to the 13500 level, which was determined by the fibo grid of 0.786 of the last downward impulse.
🇩🇪 In this situation the stop order would be below the 0.618 level of the same wave at 13125
🇩🇪 The impulse sequence can look like this as I have drawn on the arrows
🚀If you appreciate my work and effort put into this post I encourage you to leave a like and give a follow on my profile.🚀

Joe Gun2Head Trade - More downside for DAX?Trade Idea: Selling NASDAQ
Reasoning: Bearih pressure likley to continue
Entry Level: 12644
Take Profit Level: 12350
Stop Loss: 12767
Risk/Reward: 2.38:1
Disclaimer – Signal Centre. Please be reminded – you alone are responsible for your trading – both gains and losses. There is a very high degree of risk involved in trading. The technical analysis , like all indicators, strategies, columns, articles and other features accessible on/though this site is for informational purposes only and should not be construed as investment advice by you. Your use of the technical analysis , as would also your use of all mentioned indicators, strategies, columns, articles and all other features, is entirely at your own risk and it is your sole responsibility to evaluate the accuracy, completeness and usefulness (including suitability) of the information. You should assess the risk of any trade with your financial adviser and make your own independent decision(s) regarding any tradable products which may be the subject matter of the technical analysis or any of the said indicators, strategies, columns, articles and all other features.

WWI: A Timeline of History [Part II] - 1940Some key dates of WW2 in 1940 overlaid with the Dow Jones Industrial Average. Part III (1941) coming soon

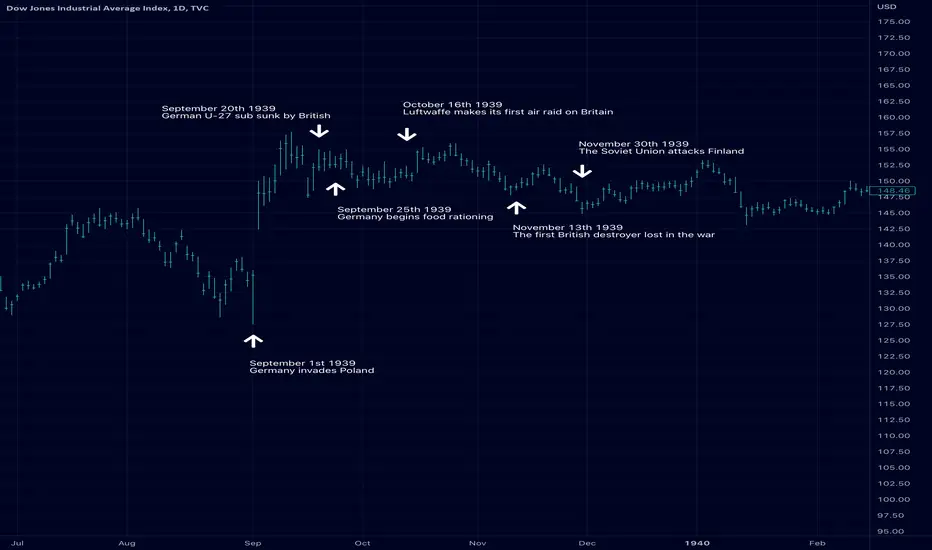
WWI: A Timeline of History [Part I]Some key dates of WW2 in 1939 overlaid with the Dow Jones Industrial Average. Part II (1940) coming soon

#trade #daytrading #DOWJONES #FUTURES Ym1! How to #germanycpiI Use 1 minute Chart of Mini dow futures contract
the add #supertrend indicator + visibe range volume profile and you can use any occilator
$spx $ES_F $DJIA $DJ_F $COMPQ $QQQ $SPY,
#trendanalisys #chartpatterns #tradingview #trading #stocks #sp500 #stocktrading #dojones
#forex,#tradingroom,#daytrade,#daytrading,#dowjones,#nasdaq,s&p500,#trade,#nyse,#crypto

Long DAX ( Daily Hammer pattern) sept 28Hello After 25% drop from highs in the DAX
A big hammer appeared today in daily.
First target 12,400 -then 12,700-13,100
Good time to cover shorts and begin loading long positions.
Other option is long EWG (ETF)

Europe&Japan to perform better than USA from now on, 1-GermanyComparision of "DAX in USD dollars" to "SPX".
I am publishing the same for all (please see my other analysis): Germany, UK, France, Italy, Japan...
I ignore all the fundamentals and just make technical analysis. Fall of EUR&GBP&JPY and their stock market's negative divergence compared to USA (SPX) is about to end, I believe.
Important: This doesn't mean that the equities&indices are going to rise from now on. My analysis only says: Europe&Japan will perform better than USA. Just because they are very cheap.

Descending Triangle in DAX40 DAX index is trading below the lower boundary of the descending triangle (the daily chart).
We can expect DAX to drop to 10,000 - 10,200 points.


DAX respecting diagonal supportThis is Germany's stock market index, one of the strongest economies in Europe.
The index consists of the 40 largest companies listed in Frankfurt Stock Exchange.
On the monthly chart we have the red diagonal line, which has been a support since the beginning, as shown in the circles.
We also have the middle yellow line, which has been tested 11 times as a support.
In the times when the line was 'respected', I put the green number.
When the line was broken, I put the red number.
Will it break down this time?
Cyclically, the price reaches the red line in the month of March.
So if this periodicity continues, the price would reach this line in March 2023.
Or if it happens equal to 2011, at least it would come close in September this year.
At least in the short term, the scenario does not seem to be the best, and this is true for all markets.
The monthly MACD is pointing down, which is not a good sign.
But just because something happened in the past doesn't necessarily happen in the future.
This is just a prediction and a question.

DE10HELLO GUYS THIS MY IDEA 💡ABOUT DE10 is nice to see strong volume area....
Where is lot of contract accumulated..
I thing that the Seller from this area will be defend this SHORT position..
and when the price come back to this area, strong SELLER will be push down the market again..
DOWNTREND + Support from the past + Strong volume area is my mainly reason for this short trade..
IF you like my work please like share and follow thanks
TURTLE TRADER 🐢
