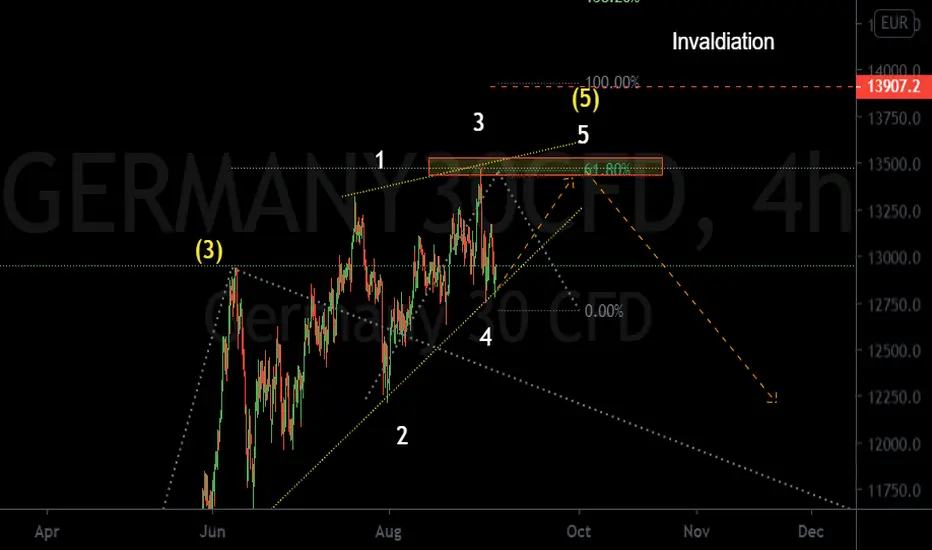
DAX, GERMANY30 Elliott wave update I am expecting wave 5 and then crash
watch it , not recommended to buy
Germany30
GER30, what's going on for DAX?The uptrend trendline needs to be definitively broken to consider a long-time short entry.
Retest could be on 128500 Area.
Otherwise (the most valuable scenario), the price will touch 13300 area again.
We will short it.
--------
Trading Kitchen

ridethepig | DAX Q2 Macro Chart Buyers of a V shaped recovery constitute a formidable opponent; the purpose of the bounce was not to recover but only to re-balance and rightly so. Of course, retail have another account and while the 11700 highs are holding continue to load thinking everything is roses and business as usual... You see, a sound position has at least 5 waves in the impulse and a double ABC in the retrace.
In such circumstances, the short-circuit and its remaining furloughed businesses hardly make a very bullish impression. A bit of a hat trick for @ridethepig after such a battle! .. In any case, if sellers claim back the highs and obstruct any breach the end scenario looks rather miserable. Sadly we will have another leg lower in Global Equities, this will turn out to be the sweep that caused depression and forces capitulation from even the most experienced of hands.
In spite of the advanced environment, this chart will demonstrate how and where an advance on the wrong side should and will be punished.

Long-term view of the Germany 30 DAX compared to the US S&P 500Long-term development of the Germany 30 DAX compared to the US S&P 500 (in EUR).

DAX30 Short Idea Elliott impulse waveDXA30 Short Idea Elliott impulse wave, Pls consider your on risk management and watch the levels. both shorting idea of yesterday and today still valid.

GRXEUR, A bullish picture!If the price will fall to the Key Level rapidly we can open buy there.
The reasons are:
- bullish trend
- the price is above the Level
- there is a support line also.
The potential profit will be 3 times bigger than the risk.
Push like if you think this is a useful idea!
Before to trade my ideas make your own analysis.
Write your comments and questions here!
Thanks for your support!

Dax30Short ideaJust a short idea each Trader have to decide the Levels .. First TP1 12850 but it could make a LL to hit 12620 as TP2. Good Luck

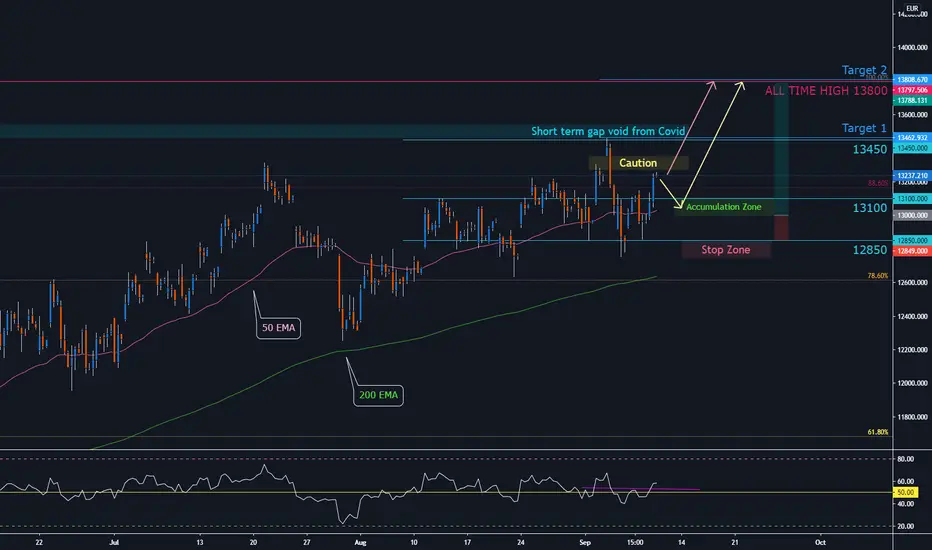
DAX Sights All Time High 13800Hello Fellow Traders!
Indices experienced slight recovery last night with SPX (US500) up 2%, Nasdaq up 2.94%, UK100 up 1.39% and DAX 2.07%
The SPX (US500) has broken pre Covid highs aided by the US tech sector, while the broader market has struggled to test related levels.
The DAX has positioned itself for an advance to reclaim historical levels.
Caution: This zone will act as resistance. Also, this trade is suggesting the global markets will bounce in the short term.
Key Points:
- Price holding above the 200 EMA
- Price holding above the 50 EMA
- Above all Fibonacci levels from the Covid range drop. Next resistance is the All Time High.
- Covid Gap from initial drop has yet to be filled.
- RSI positioned for upside
Key Levels:
Support – 13100, 50 EMA, 12850, 200 EMA
Resistance – Caution Zone, 13450, Above Covid Gap, 13800
Entry Zone:
Optimal entry provides the greatest reward to risk ratio while supporting entry is a zone for reversal signals.
Optimal Entry – 13000
Supporting Entry – 13100
Candle Reversals for entry
- Bullish Hammer
- Bullish Engulfing
- Bullish Piercing
The Risk:
As traders, it is your job to mitigate the risk and only trade structures that provide high probability and great reward to risk ratios.
If you are not comfortable with defined exit levels, experiment with Moving Averages to help set solid exit rules to protect your capital.
IF: Price breaks above 12850 level and/or violates 50 EMA – this would suggest the structure is not in our favour and would be wise to reduce exposure or close the trade until a solid signal gives us reasons to re-enter.
Reward / Reward Targets:
Optimal Entry 13000 – Target 1 13450 = 3x Reward to Risk
Optimal Entry 13000 – Target 2 13800 = 5x Reward to Risk
Supporting Entry 13100 – Target 1 13450 = 1.5x Reward to Risk
Supporting Entry 13100 – Target 2 13800 = 2.7x Reward to Risk
DAX trade planDAX is at an interesting level. Now price moves along the uptrend line, tried to break it but could not close below. Stuck between 50 and 200 SMA's showing consolidation.
1st trade is to wait for the break of 50SMA and the high of 13129 to buy and target higher levels.
2st trade is to wait for the break and close below the support zone and 200SMA to sell.
The selling strategy is higher risk, so we need some serious news in the market to improve our chances.
Please support the idea and share your thoughts on DAX!
Good Luck and Stay Healthy!

GER30Price just previously rejected a support at 12733.12 and a large time frame trend line. If the price breaks the trend line as indicated in the post and retest it on 1HR time frame, I'll on the long side to 13463.95 and stop at 12842.01

DAX30 Buy Limit SetupDAX30, remember there is news today. Still one more area for major liquidity before the take off.
Buy Limit @ 12874, Stop Loss @ 12700
Targets would be two for the most part, second one likely a swing
Targets 13250 and 13500

DAX In A Bull TrendHello traders,
DAX is trading bullish since March of 2020. We see four completed legs within a bigger impulse, with price specifically trading out of a triangle in wave IV. We see a sharp rally from the 12852 level, which is accompanied by a break above the triangle line, which is a strong indication that bulls within a wave V can be on the move. As such, be aware of further upside on DAX, which can be aiming for 14500/15000 region.

On the way to the All-time highs zone / DAXMain items we can see on the chart:
a) The price has been on a bullish trend since MARCH 2020
b) Currently, we can see the price outside the ascending channel
c) However, we do not consider it as a reversal signal yet
d) We expect the price to reach the next resistance zone (all-time highs) There we will pay attention for possible reversal or continuation patterns
e) Currently, we can see a small correction. (We expect a bullish resolution IF the price breaks above it)

Germany short positionMonday opened on an uptrend, so taking the chance to cash in some pips. Let's see how this day rolls :)

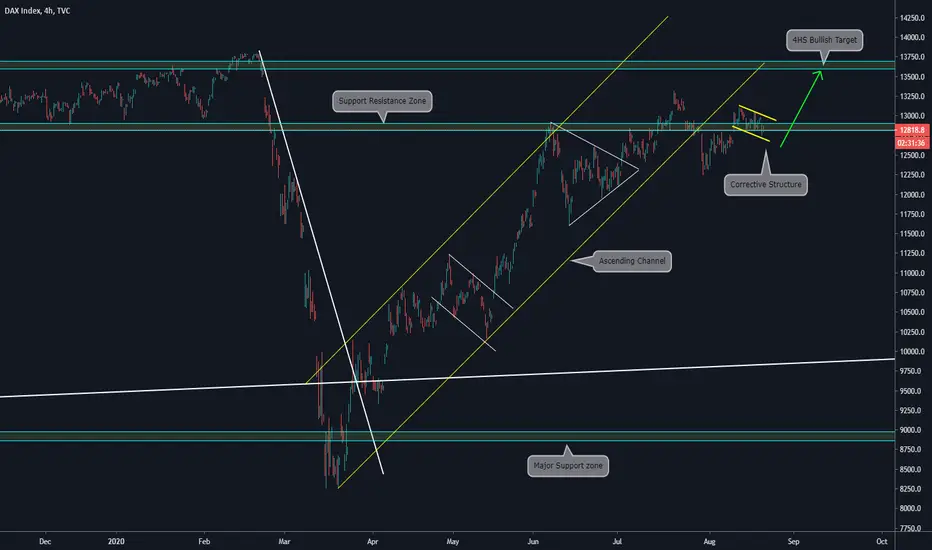
DAX / We are waiting for another bullish movementMain items we can see on the chart:
a) The price broke the ascending channel
b) Currently, the price is above a Support/Resistance zone
c) On the edge of that level, we can see a corrective structure
d) IF the price breaks above the corrective structure we expect a bullish movement towards the 4hs target
e) The key zone is above the yellow structure if the breakout doesn't happen we will invalidate our view
FDAX1! - Forecast - 19/08/2020FDAX1! - Forecast - 19/08/2020
SHORT FDAX1!
ENTRY LEVEL 1 @ 12860
SL @ 12956
TP @ 12560 RR3.12
Risk 1%
ENTRY LEVEL 2 @ 12882
SL @ 12956
TP @ 12560 RR4.35
Risk 0.5%
ENTRY LEVEL 3 @ 12925
SL @ 12956
TP @ 12560 RR11.77
Risk 0.5%

Short opportunity for DAXAfter the whole cycle of waves has been completed, it seems that wave 5 is now over. This will result in a short opportunity for Dax

BFRA Long-Term Targets 200% Potential ProfitsBFRA - Long-Term Targets (50% + Potential Profits)
This chart is setting itself up for long-term growth.
The purpose of this chart is to share with you the long-term targets
Here we are looking at %+ potential profits... after a massive drop
got question ? Feel free to leave a message.
Thanks a lot for your support.
company info:
BFRA
Biofrontera AG
Healthcare | Biotechnology | Germany

DAX - SWING Alert - Bearish Scenario / 10-15% GAINS !!!-NEW author on TradingView
-2+ years experience in markets
-Professional chart break downs
-Supply/Demand Zones
-Key S/R levels
-No junk on my charts
-Frequent updates
-Covering crypto/US stocks
XETR:DAX 90min: BEST level to SHORT 10-15% gains (SL/TP)(NEW)
IMPORTANT NOTE: speculative setup. do your own
due dill. use STOP LOSS. don't overleverage.
🔸 Summary and potential trade setup
::: XETR:DAX 90min chart review / outlook
::: bounce imminent right now
::: likely setting up for a bigger move downwards after filling the CME Gap (13400-13500)
::: however short-term I recommend to focus
::: on selling HIGH from confirmed resistance
::: In this Setup it is very important to be patient to not get frontrunned
::: key resistance: 13500 USD
::: key support level: 11400-12000 USD
::: recommended strategy: SHORT IT 13400-13500 USD
::: SL 13720 USD TP1 12000 USD TP2 11400 USD
::: If you like my content, please consider liking and commenting. So I can adjust my content to your feedback guys.
::: Good luck traders!

FDAX1! - Forecast - 14/08/2020SHORT FDAX1!
ENTRY LEVEL 1 @ 13150
SL @ 13230
TP @ 12925 RR2.81
Risk 1%
ENTRY LEVEL 2 @ 13185
SL @ 13230
TP @ 12925 RR3.25
Risk 1%
PIVOT @ 12925
BUY FDAX1!
ENTRY LEVEL 1 @ 12925
SL @ 12845
TP @ 13150 RR2.81
Risk 1%

FDAX1! - Forecast - 11/08/2020BUY FDAX1!
ENTRY LEVEL 1 @ 12680
SL @ 12500
TP1 @ 12990 RR1.72
TP2 @ 13065 RR2.14
TP3 @ 13225 RR3.03
TP4 @ 13305 RR3.47
Risk 1%
ENTRY LEVEL 2 @ 12600
SL @ 12500
TP1 @ 12990 RR3.90
TP2 @ 13065 RR4.65
TP3 @ 13225 RR6.25
TP4 @ 13305 RR7.05
Risk 1%

FDAX1! - Forecast - 12/08/2020SHORT FDAX1!
ENTRY LEVEL 1 @ 12920
SL @ 13000
TP1 @ 12735 RR2.31
TP2 @ 12545 RR4.68
Risk 1%
PIVOT @ 12730
If breakout and retest : ENTRY LEVEL 2 @ 12730
SL @ 12810
TP @ 12545 RR3.90
If not reverse : BUY Level 1 @ 12730
SL @ 12650
TP @ 12920 RR2.37
Risk 1%

The bullish trend continues towards the Next Resistance on DAXMain items we can see on the chart:
a) The price is on a bullish trend since March
b) Currently, we can see a corrective structure supported on a major zone
c) We had a breakout of the structure and we expect a continuation of the bullish movement
d) The target we will be aiming for is the next Resistance zone (Historical Higher Highs)
