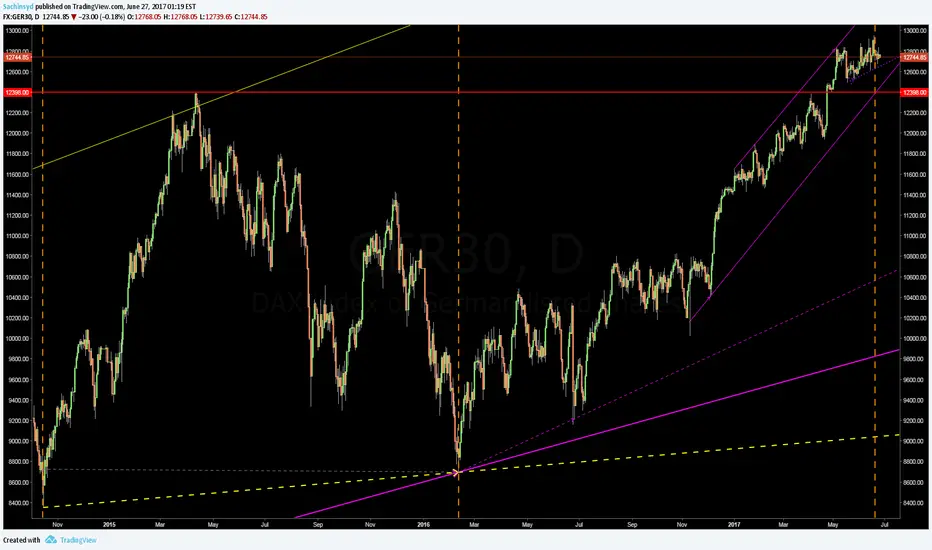
GER30 IN A TURNING POINT: ONE MORE WAVE UP OR BREAKDOWN?GER30 is in a strong uptrend but it's reaching the long term rising trendline. This could be a turning point: one more wave up or a breakdown? Potential targets on chart.
Germany30

DAX (Germany 30) Potential Long ReversalHi all,
I am looking for a potential reversal here (although for the very short term). Let's see if the price will manage to hold over the support level :)


DAX intradayPotencial Bullish Butterfly for DAX - ?
Potential targets on the chart.
Maybe elongation D-leg
High risk trade!
I will comment on the idea, as events unfold.
Thank you for your attention.

DAX30 Possible long, 12670 TargetPossible long in DAX30 as reversal of short till 12.200, trend channel.
Short in EURUSD required

DAX - Dragons' DenDAX - H4 potencial Bullish Dragon?
Possible scenario on the chart.
Targets on the chart.
TP1 - 12526 TP2 - 12638
TP3 - ? (12819) TP4 - ? (13015)
Alternative scenario under the Stop Zone.
High risk trade!
Thank you for your attention.

DAX - Potencial Bullish Dragon?DAX potencial Bullish Dragon?
Continue to move on the goals of Pattern Bullish Dragon.
Possible scenario on the chart.
Targets on the chart.
TP1 - 12495 TP2 - 12555
TP3 - ? (12653) TP4 - ? (12812)
Alternative scenario under the pink trendline (12390-12380).
High risk trade!
Thank you for your attention.

DAX intradayDAX wants to kiss EMA600, and maybe (maybe!) rebound.
Potencial Bearish Gartley Pattern - ?
Possible scenario on the chart.
12559 sales zone
Let`s see.
Targets on the chart.
TP1 - 12498
TP2 - 12460
TP3 - ?
I will comment on the idea.
High risk trade!

Edging on ICEGood morning Traders. How was the weekend ? Another trading week will start soon. so let's dig in.
The daily chart look's BULLISH. with US new high, looks like we heading towards 12730 - 12750.
BUT before we run and buy, we should look deeper
The 2hr chart is more BEARISH, so we can expect so some sell before US market opens.
not to mention that US might sell off a bit after weekend rally.
s3.amazonaws.com
Remember, you dont have to jump in. you can use the WEEKLY and DAILY pivots to try and enter.
the logic with pivots is - if price goes up towards S1 (top line) you might consider sell if it doesn't go above.
if price goes down towards P1 (bottom line) you can consider LONG if it won't breaks below the line.

DAX - intraday: Maybe Bearish Dragon?DAX potencial Bearish Dragon?
Continue to move on the goals of Pattern Bearish Dragon.
Possible scenario on the chart.
Targets on the chart.
TP1 - 12583 TP2 - 12532
TP3 - ? (12450) TP4 - ? (12317)
Alternative scenario on the chart (after breakout blue dotted trend line).
High risk trade!
Thank you for your attention.

GER30It looks now for the last high for me (may be one more high this week and then down to 12500 - 12000.
Good luck to all with your plan.

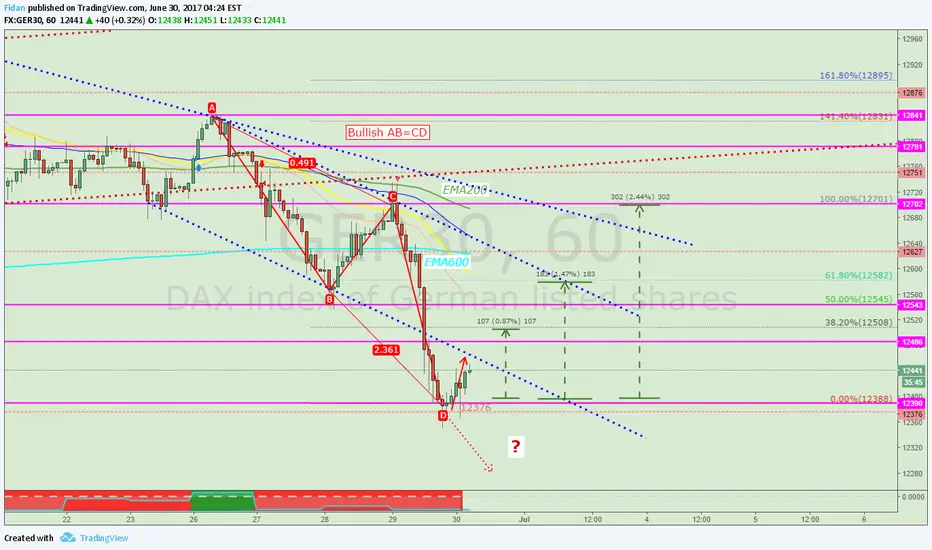
DAX intradayDAX potencial Bullish AB=CD - ?
Possible scenario on the chart.
Targets on the chart.
Alternative scenario on the chart.
Thank you for your attention.

Wiser Look - Wider viewHi traders. weekend is here. time to relax and look back.
They say older people are wiser, since they know what happened in the past, hence they git a wider view.
Weekly chart we can see a great divergence, meaning we should welcome the BEARS are enjoy the downhill ride.
It doesn't mean it will happen on Monday, but bear in mind - it will come sooner then later.
and when the bears will hit, it will be painful.
targets are as always the 0.618% fib retrace.
BUT, we gotta keep respect Daxi, and price action. so looking at daily time frame will be our helping hand.
Enjoy your weekend !


Intraday view for DAX. We see a correction on the DAX.
Today we can continue the shorts.
DAX kissed the EMA 200. And upborder of red dot channel. And rebound?
Prospective Bearish Bat Pattern.
Possible scenario on the chart.
Targets on the chart.
Alternative scenario - red dotted arrow.
Let`s see.

Bulls Morning in Bear MarketGood morning traders. after the rain come sun. i will take the Long ride today.
Might be good to wait for cash market to open, for a bit of sell off, but the rest of the day should be BULLS win today.
first target @ pivot and then fib's level
Enjoy the ride

$GER30 $DAX completed a perfect L-L-H$GER30 $DAX completed a perfect L-L-H. Calls for medium term top . Sell any rally to Upper BBand
What A DAY ?? !!Hi traders. i hope today was profitable. its was great trading day. very classic.
look how nicely fibs level help us find targets.
enjoy the rest of the day. you sure earned it.
See you on the next ride !

DAX / H2-m15-m2 : Multi Timeframe Intraday AnalysisThis study shows what are my projections for the german index. Still to early too jump into short but certainly not buying anything here as we have a nice reversal on top of the H2 timeframe. Price are probably just pulling back to form Elliott wave 2 point and head to the big wave 3 that should be the extended wave of the bear impulse that I expect the prices to show later. In ploted on this chart the theoric targets I'm looking forward to sell the index again with low risk entries.

DAX / H4 : Ending Diagonal to terminate this impulse ?Just as the DOW count revealed, the DAX 0.76% may be creating an ending diagonal formation on fifth and final wave of the current count that started upon Trump's election and fueled the price without a single retracement (as 2 & 4 were both flat corrections ).
Anyway we might be reaching a market top as suggested and as we didn't have any retracement and that this wave was basically based on promises that will less likely come afterwards.. I anticipate that we should have a profound 50% retracement of this wave. Maybe more if we have some catalysts in the meantime.
For agressive traders, there is still one subwave count to finish in this possible ending diagonal as subwave are supposed to be in ZigZags. So we have wave A, now retracing to B point that we should reach soon, that leaves us with a C wave to look for before considering agressive shorts. Generally we use the fibo extension of 78,6% of previous wave as target... you have it on the chart !
For less agressive ones, of course waiting for the wedge to break down. Remember that ending diagonal breakouts generally creates strong movements with extended 1st wave impulse as first A retracement wave. So there's plenty of room to go close this Macron gap I guess ! That will be Target 1 for ;)
Hope this idea will inspire some of you ! I'm pretty new to TradingView so I'ld appreciate any like/follow if you feel like it deserve it ;)
You can check my indicators via my TradingView's Profile : @PRO_Indicators


Projection DE30, looking for year high 13700~From a 100% technical perspective, my chart is telling me DE30 looking for top of bullish channel since post subprime crisis rally. Before this happens though, I'd like to see a drop to 12316 - 12392 (2015 high) for a healthy climb the coming weeks. So to conclude my thoughts I think we've seen swing high looking for swing low to a new all time high that might roll over very fast because of the lack of confidence in stocks that are already overvalued.
